Charts give a fast overview of the amount and distribution of different types of content according to their status.
A set of statistics chars are available from on the Compliance Desktop showing the distribution of the different types of process diagrams (BusinessProcessNetworks, WorkflowDiagram, BusinessProcessDiagrams), audit, non-conformancies, and change requests according to their governance status.
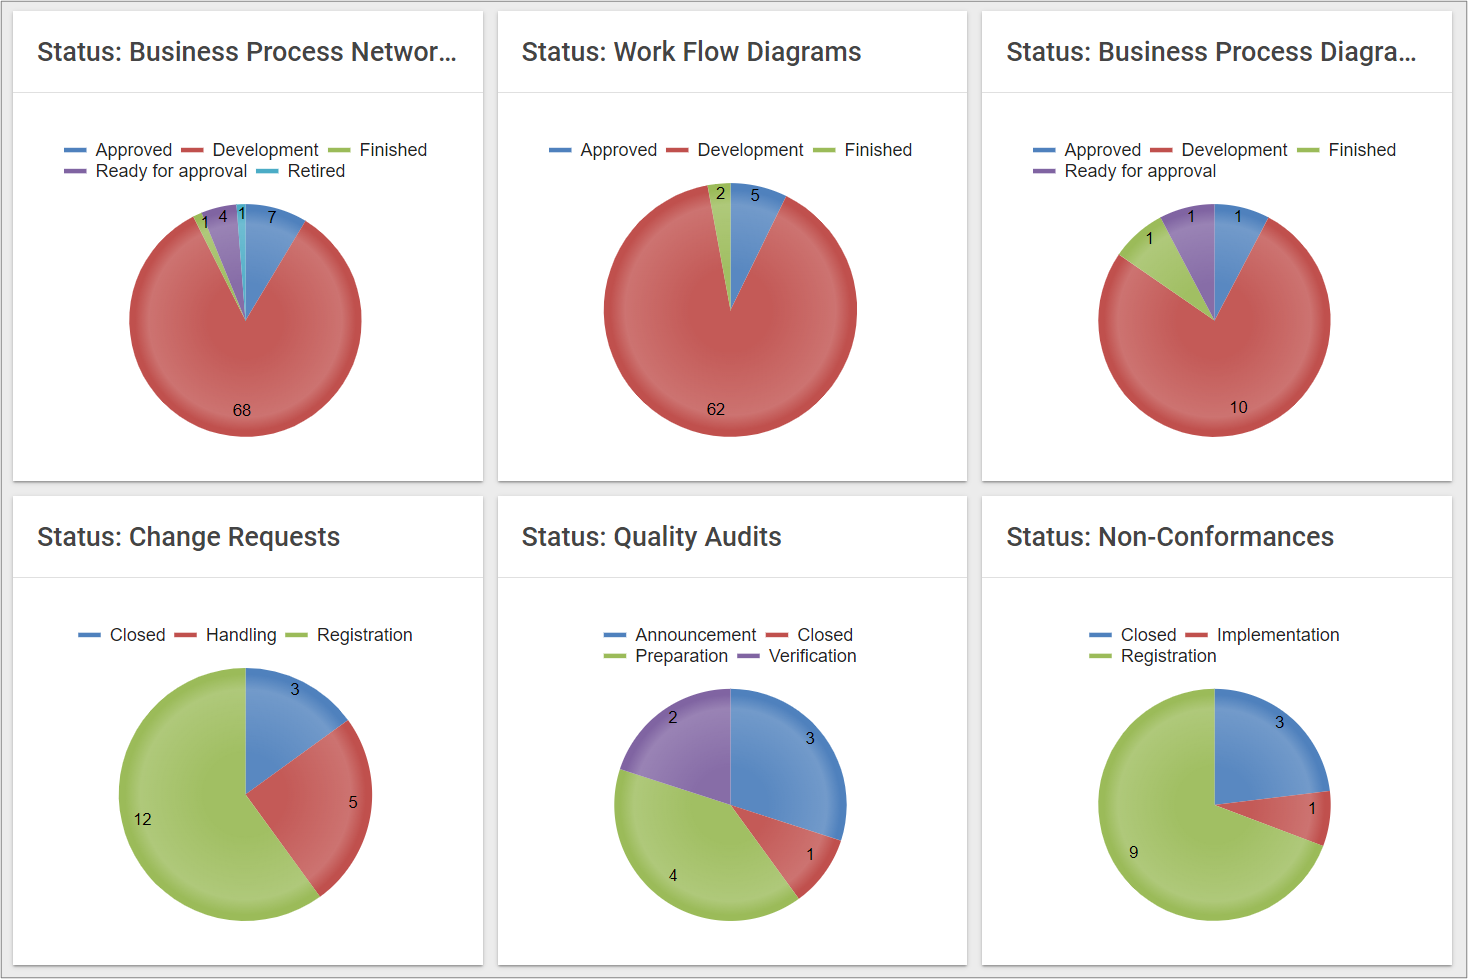
The charts group the different types of objects and displays the number of objects in each of the governance stages. The governance stages are defined as part of the governance workflow for the different types of objects.