Reverse and forward Engineering
The RelationalDiagram can be used to Reverse engineer a database.
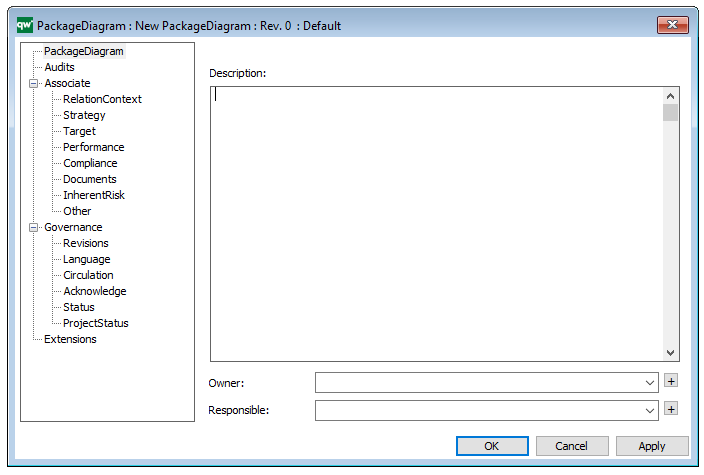
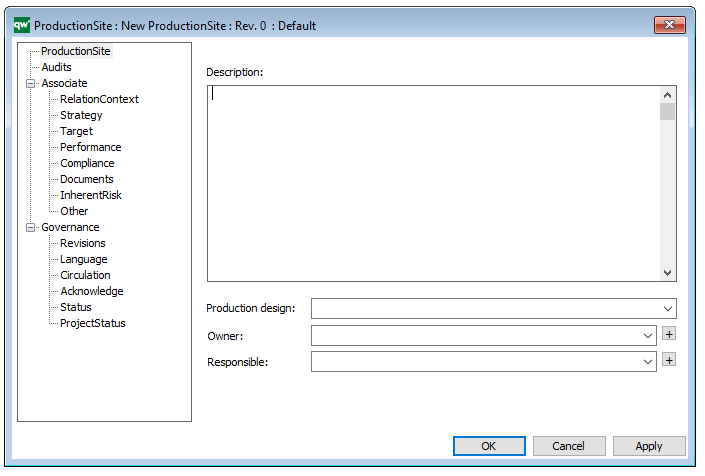
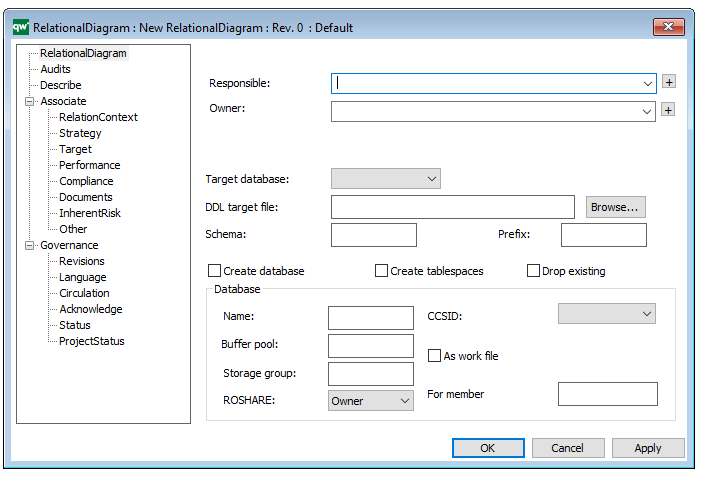
Right click on the white canvas to open the dialog for the Diagram.
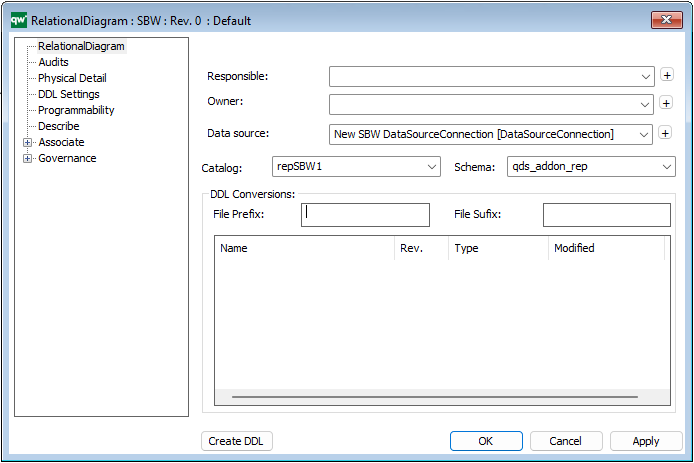
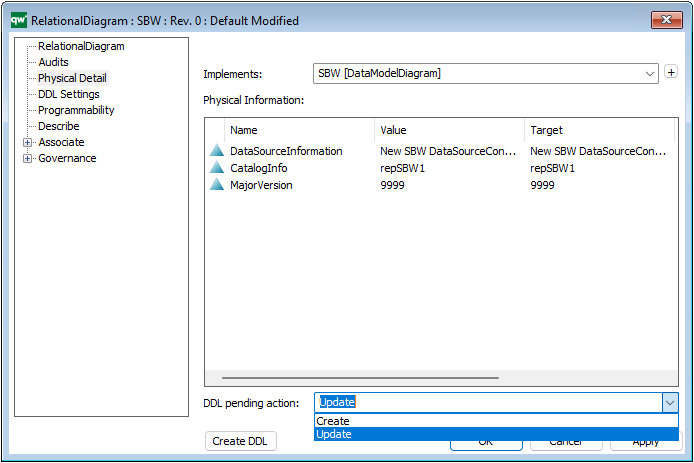
On the main tab you can add a link to a Data Source (linking a DataSourceConnection).
Once you can have addded a DataSource you can select Catalogue and Schema from the drop-down menu. If the drop-down list is empty, then the DataSourceConnection isn’t working, and you have to test it, see more.
NOTE there need to be a parent SubjectArea for the diagram for this to work, if not you will get this message.
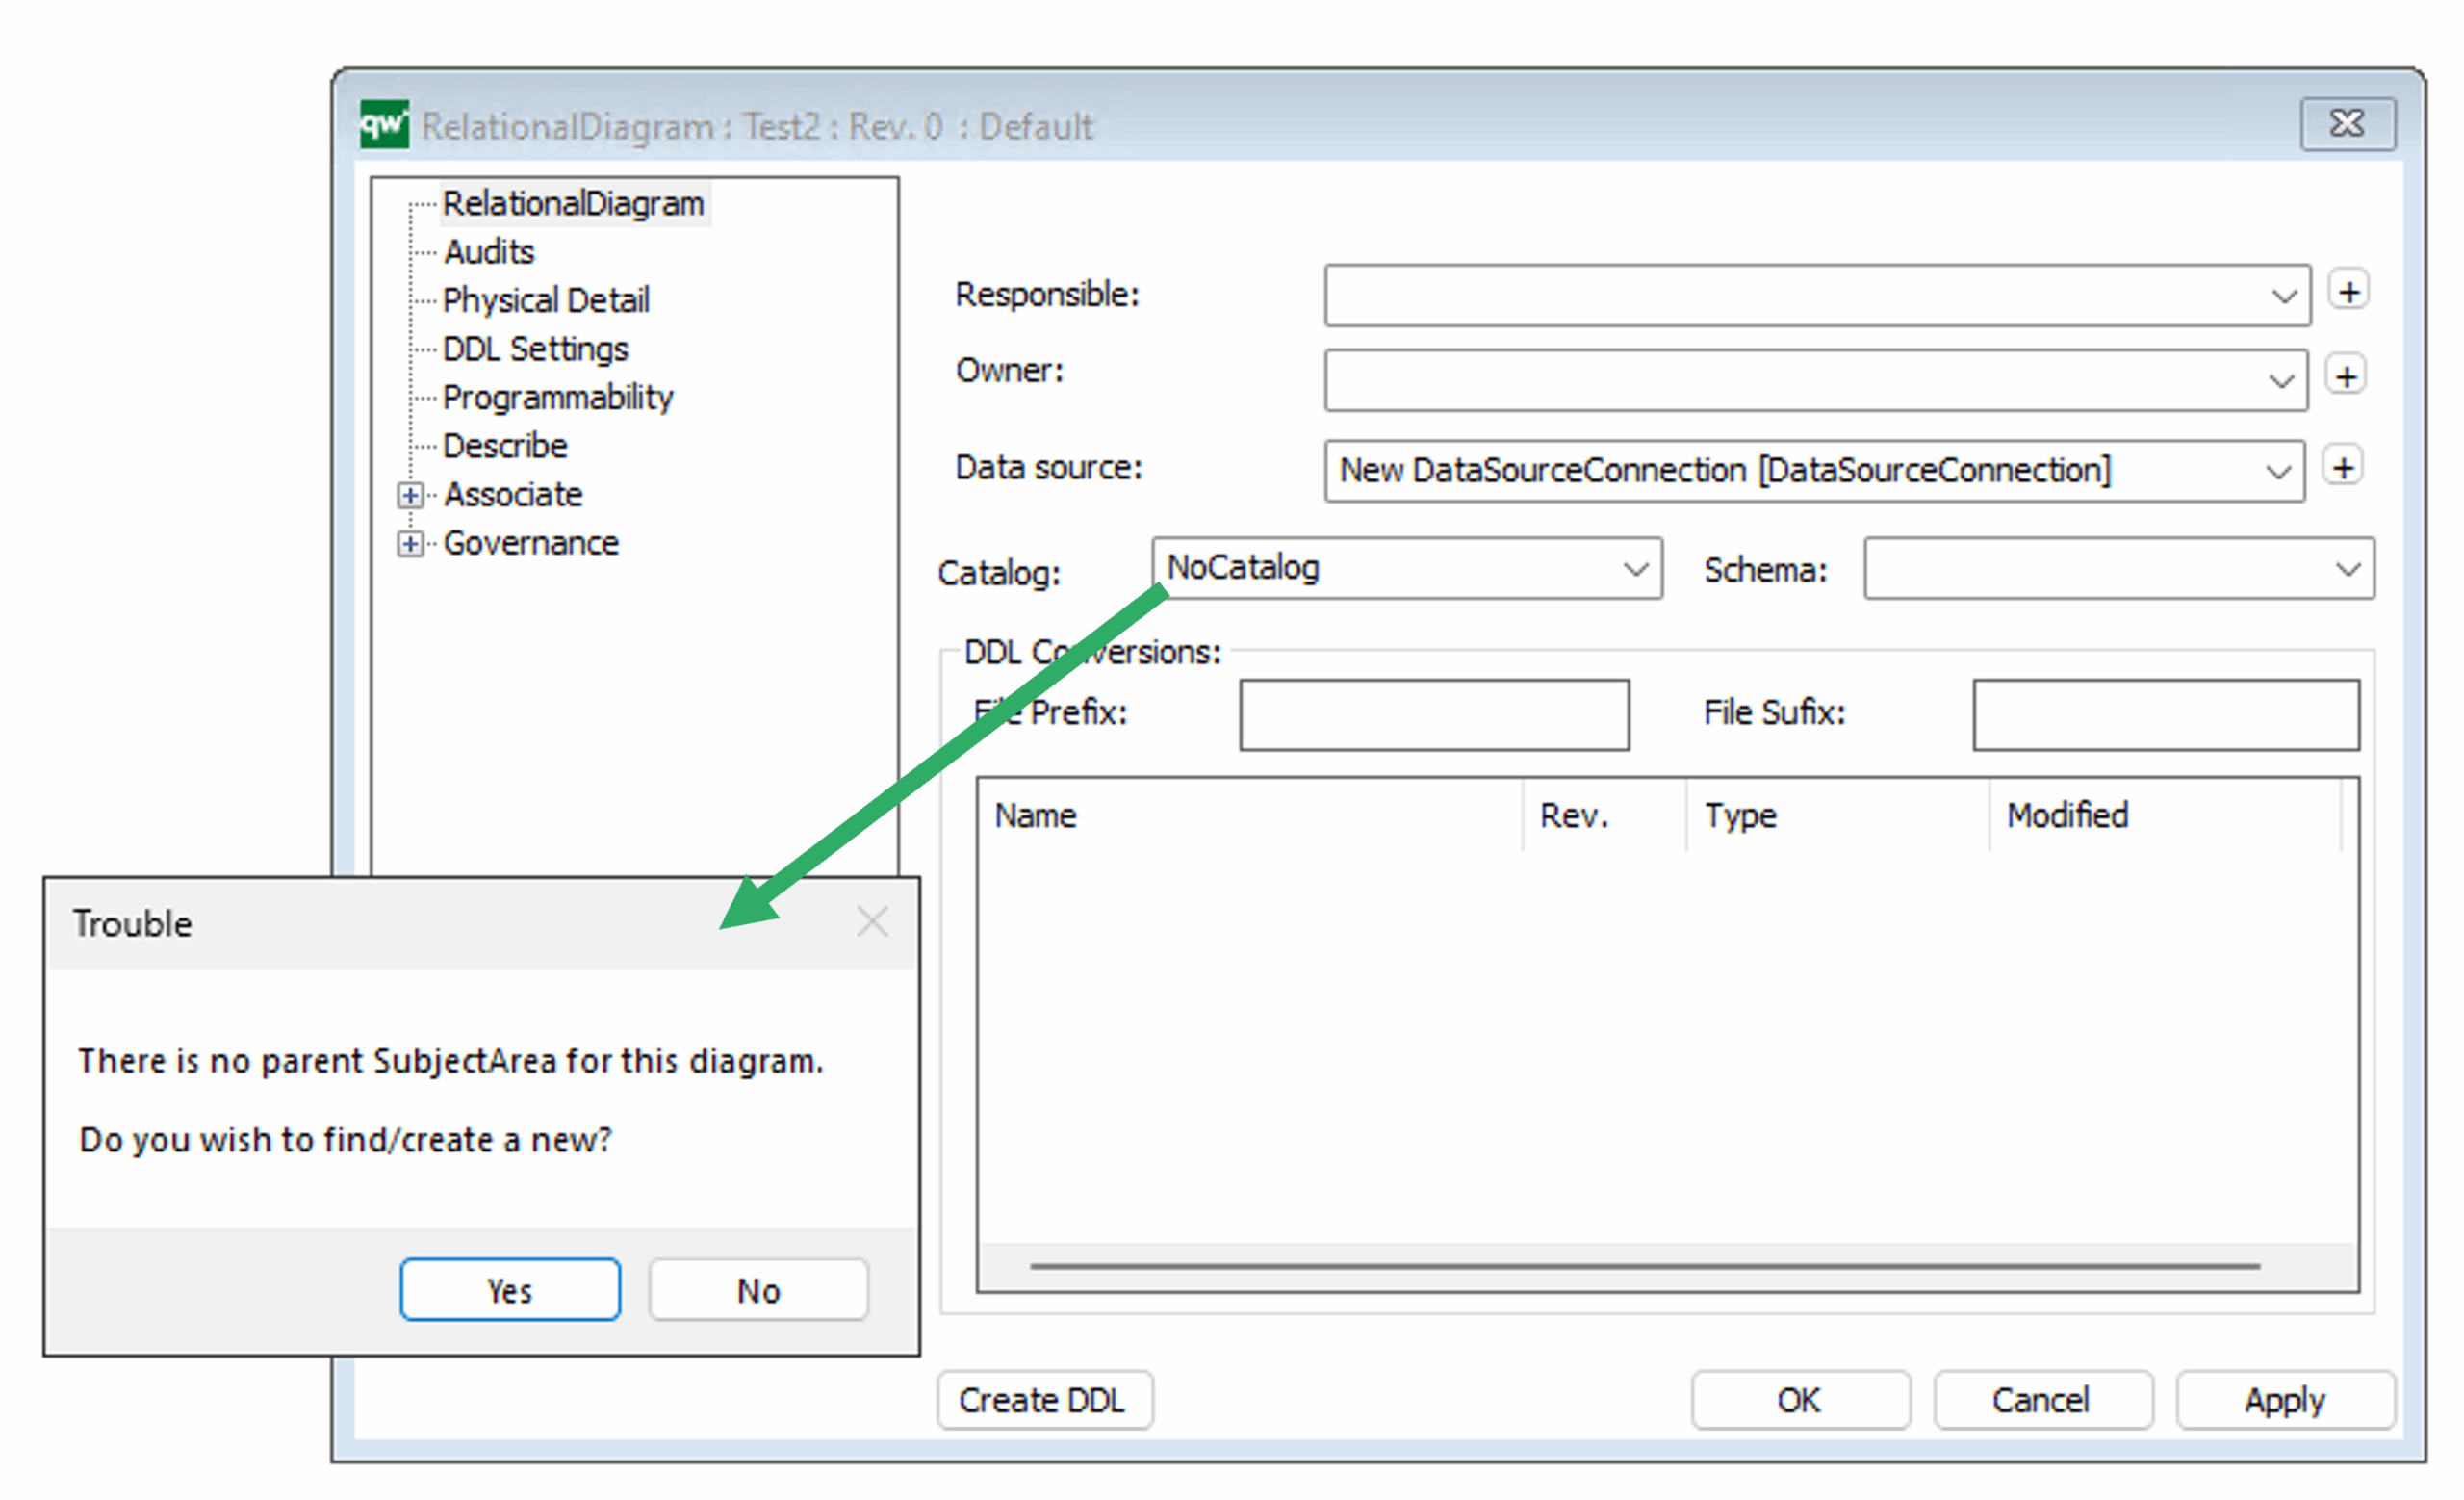
You can link a SubjectArea to a RelationalDiagram from the SubjectArea, see more here.
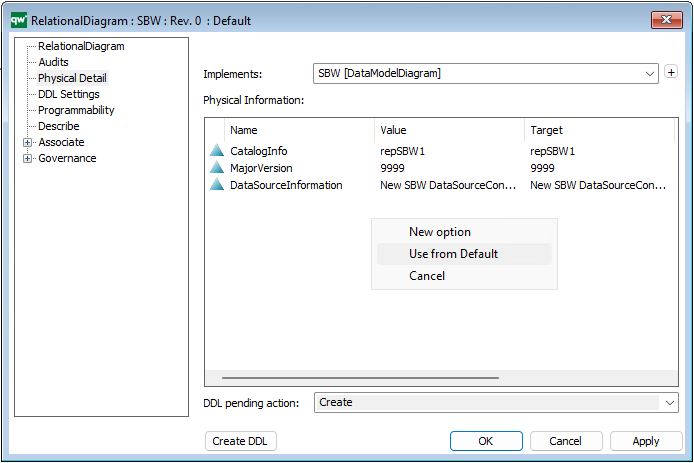
Physical Detail
Add the default values by right clicking and select “Use from Default”
Reverse Engineer
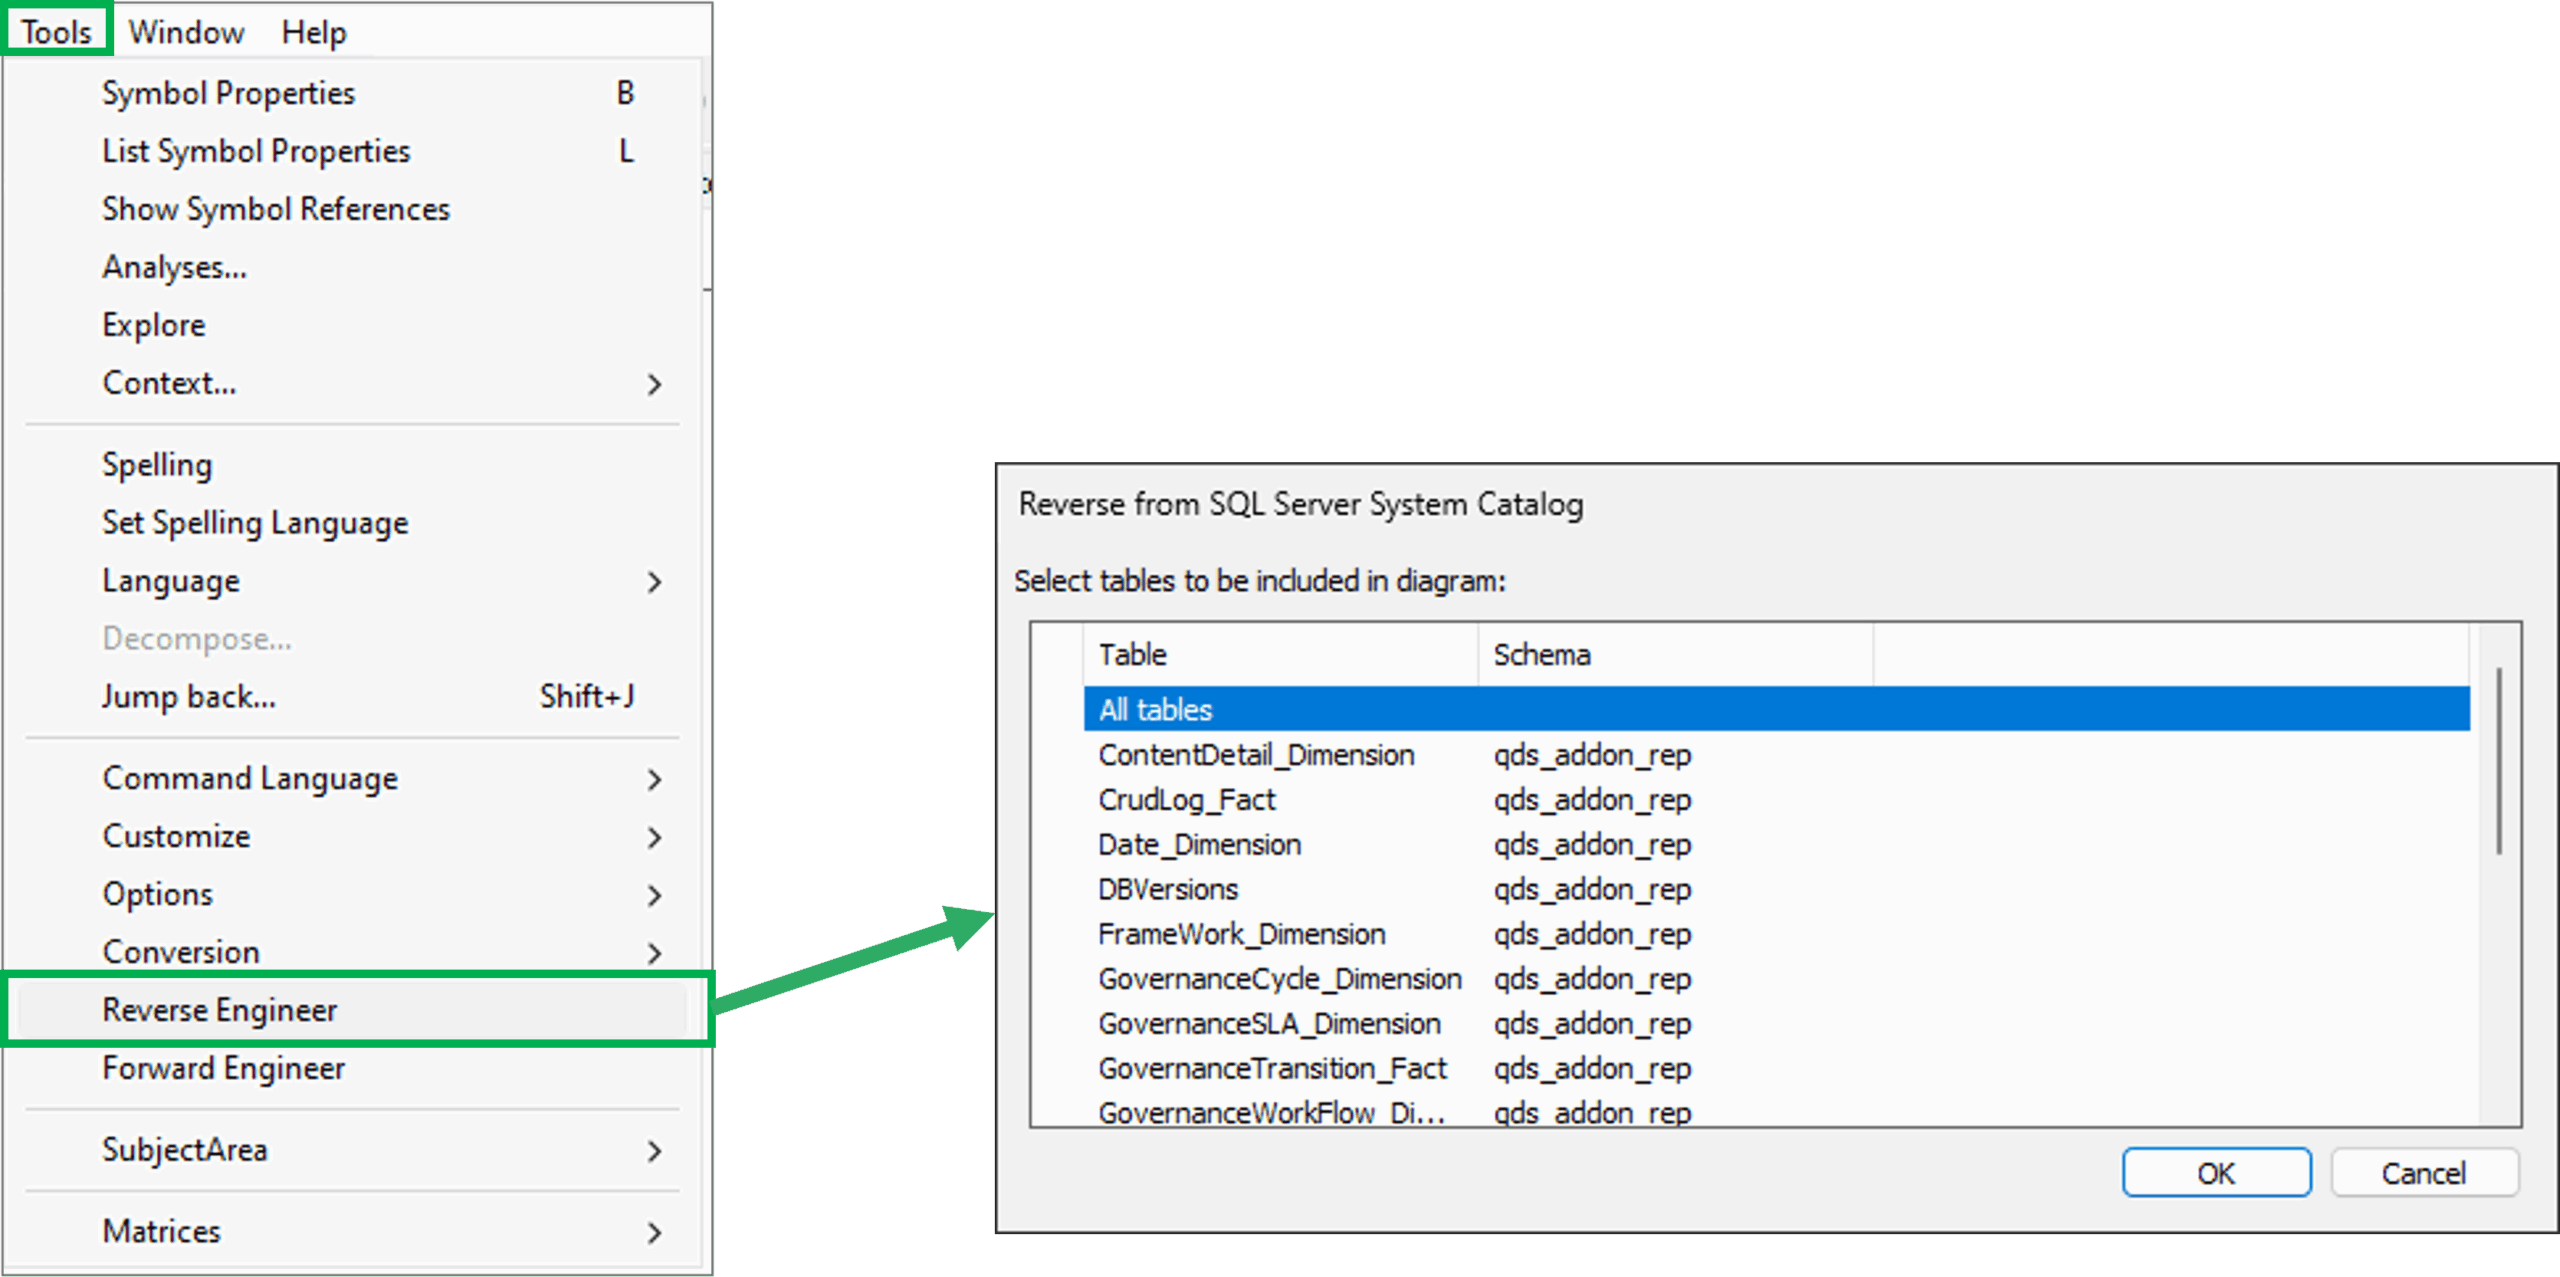
It is now possible to reverse engineer the Relational Diagram using the Setting from above (DataSourceConnection, Catalog, Schema, and Setting on Physical Detail).
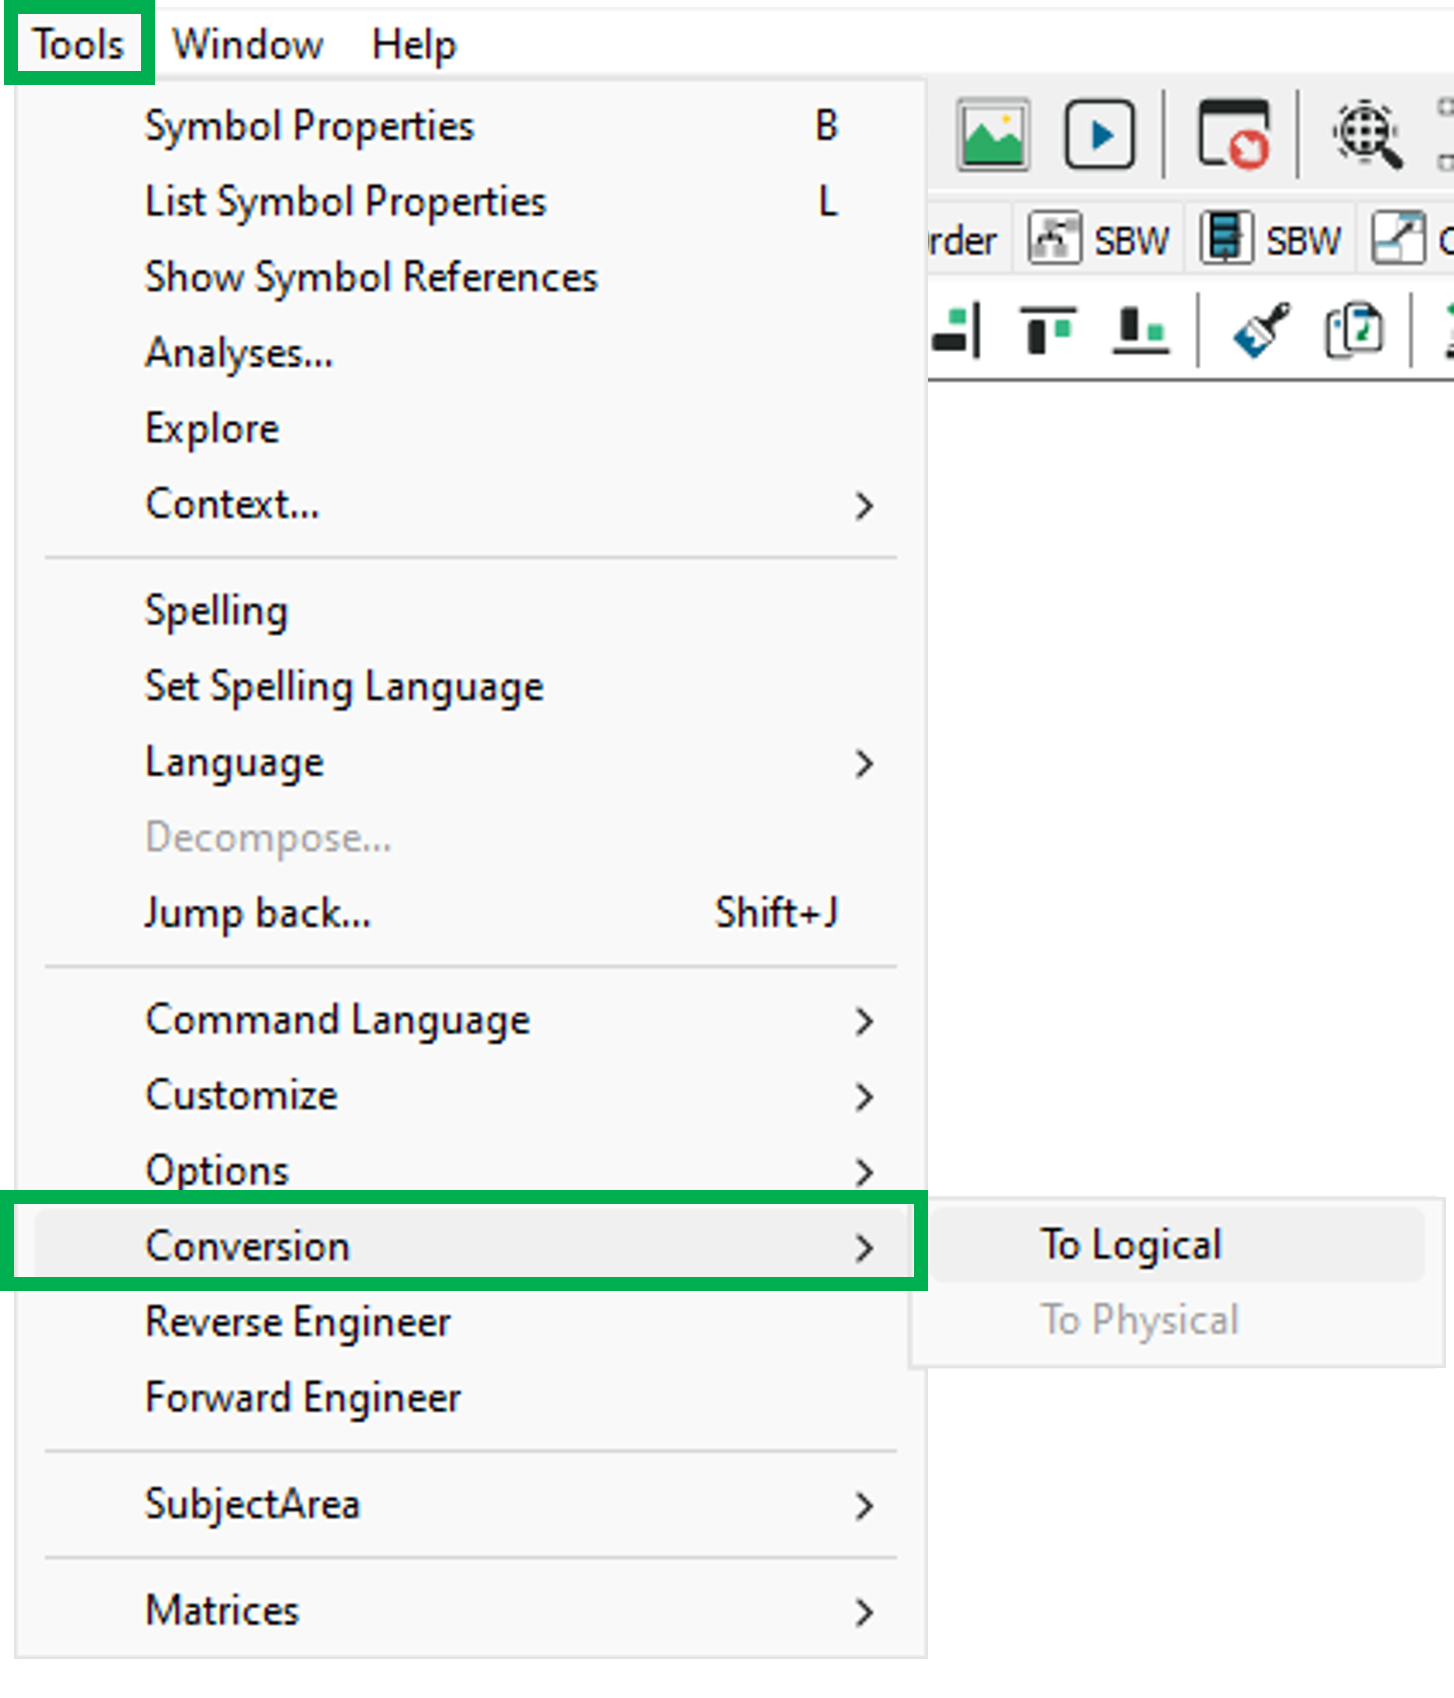
Select Reverse Engineer from the Tools menu i QLM, and select the tables to be included in the Diagram.
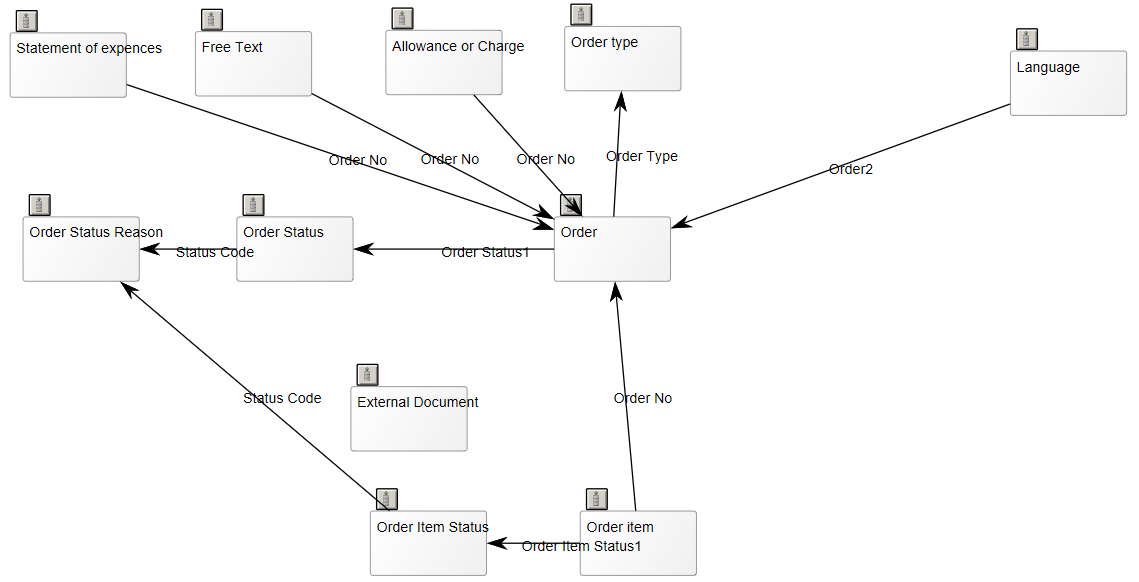
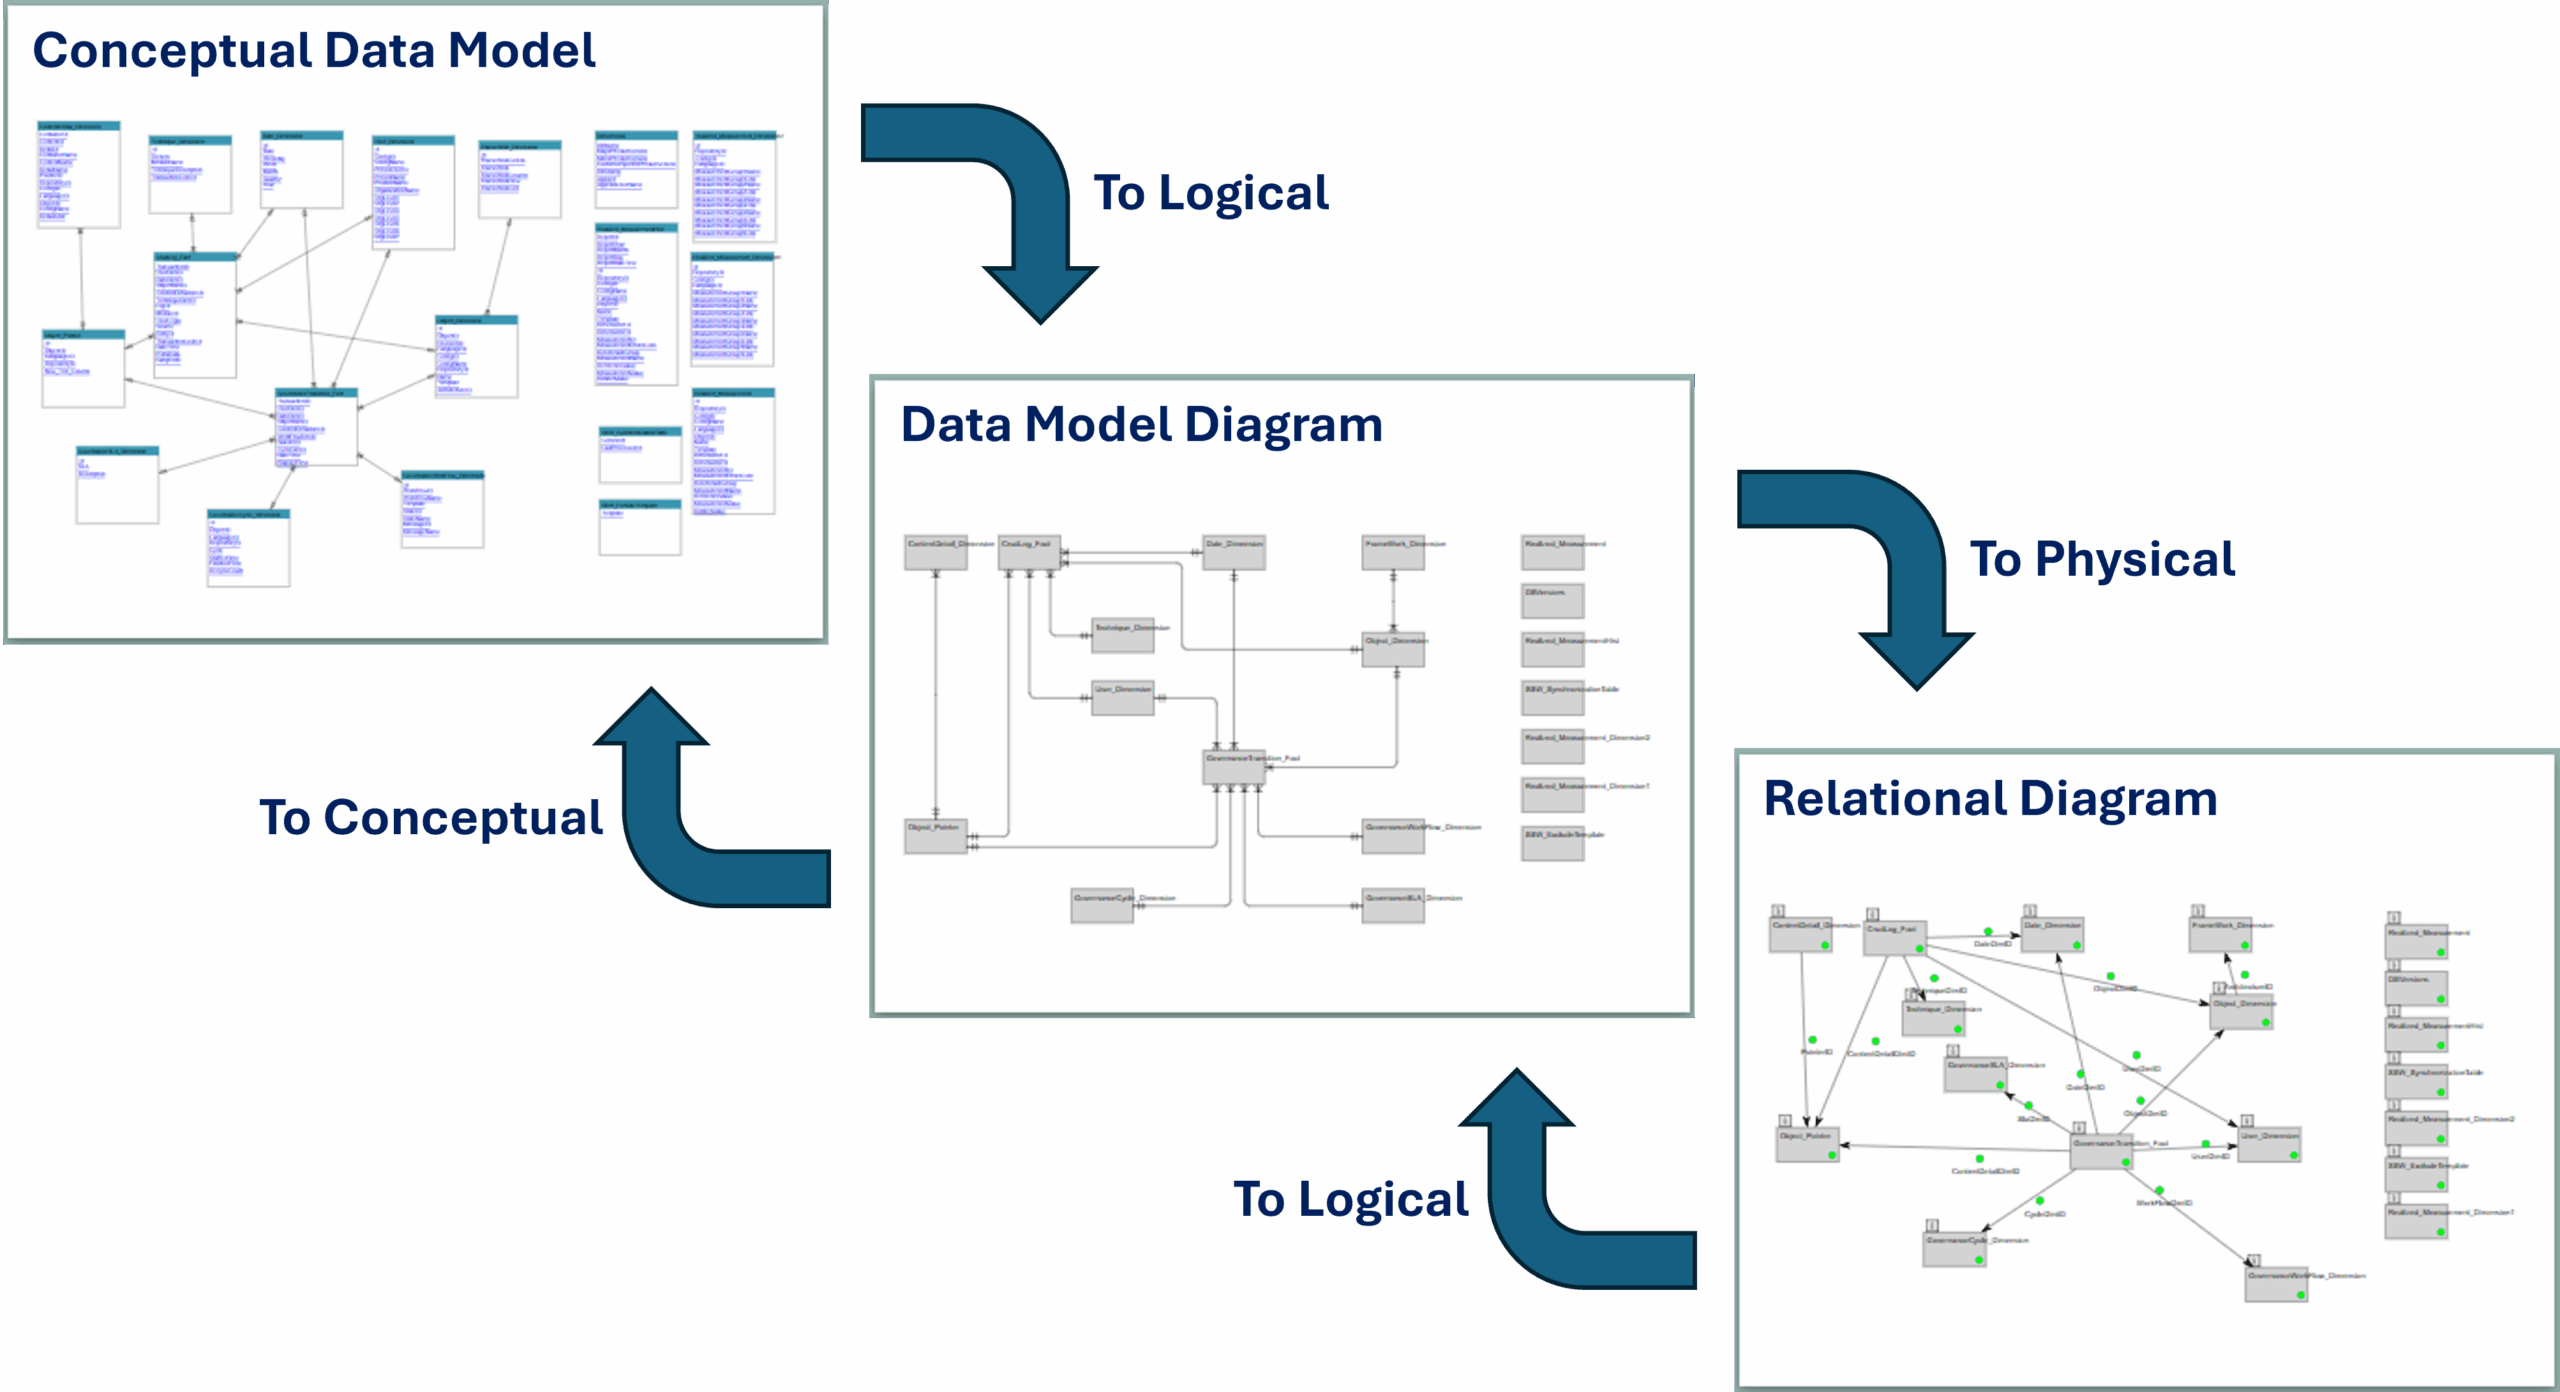
After a little while the Diagram is created (reverse engineered)
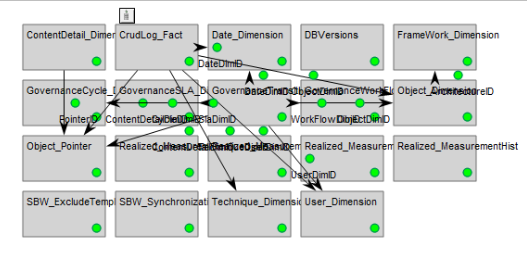
You can re-arrange the symbols to get a good representation.
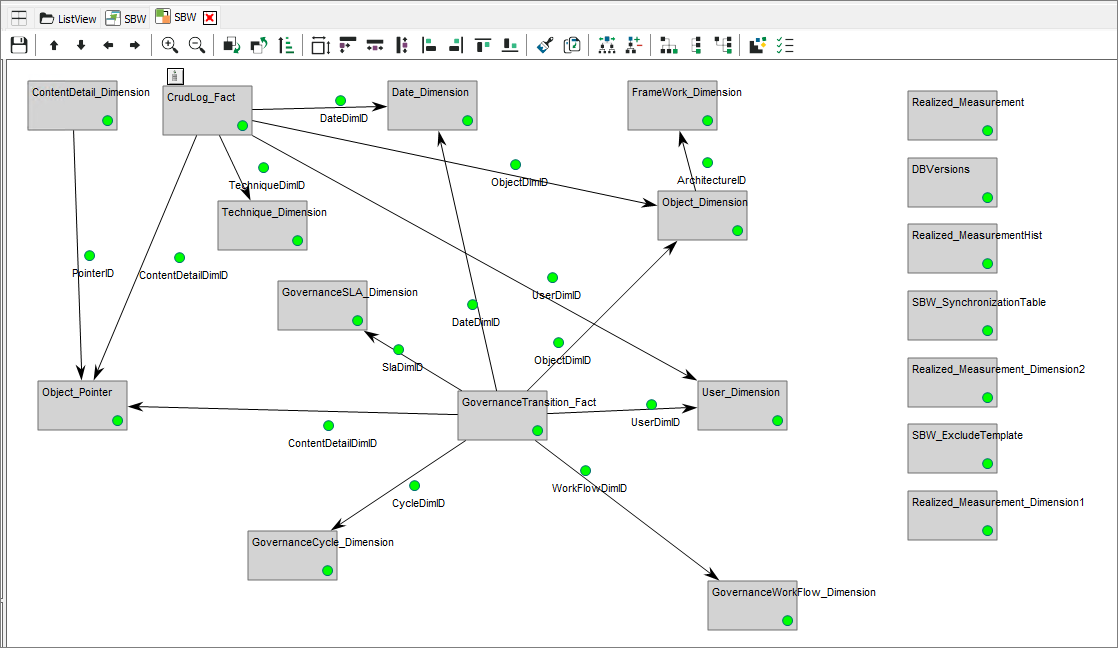
The Green dots represent that the Model correspond to the real Database.
You can open the properties of the tables on the diagram.
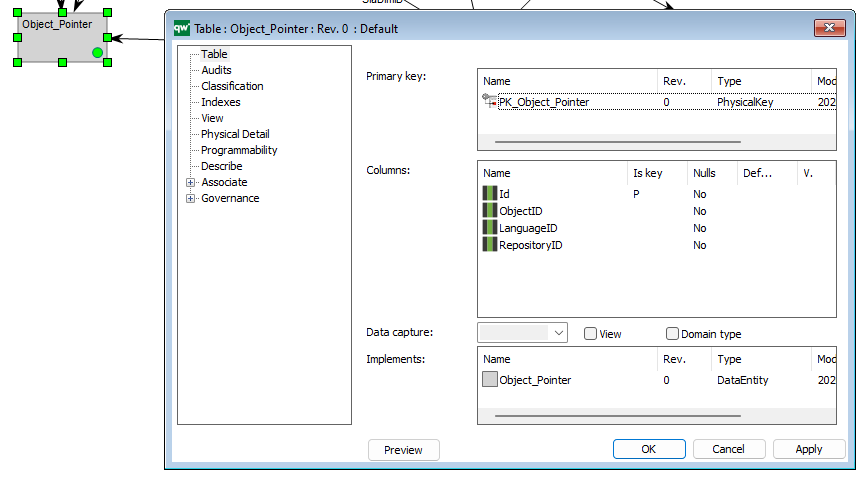
If you change the properties of the table so that it no longer corresponds to the databasestructure, the dot turns from green to yellow on the diagram.
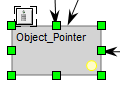
Table – Physical Detail
On the Physical Detail tab, it is possible to change the target value and options for the details.
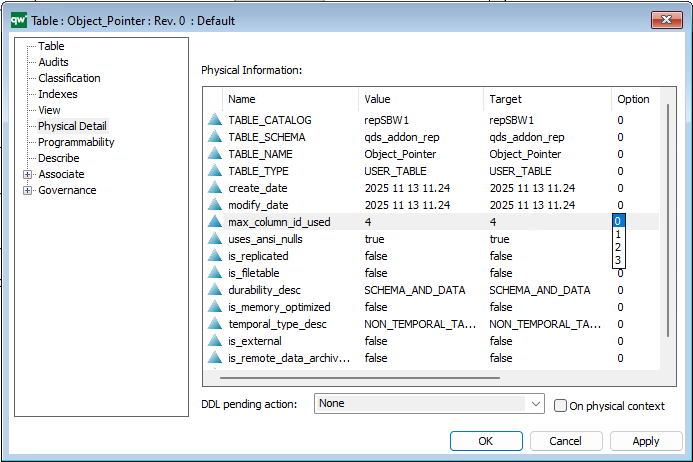
Hint: All fields are read-only by default. Move the horizontal cursor to the left and select the Option will enable 4 options:
- 0 => Read only
- 1 => Editable as string
- 2=> By choice e.g. True or False
- 3=> Object selection filtered by template
Forward Engineering
It is possible to forward engineer from the RelationalDiagram to the physical database. This can be executed from the Tools menu in QLM.
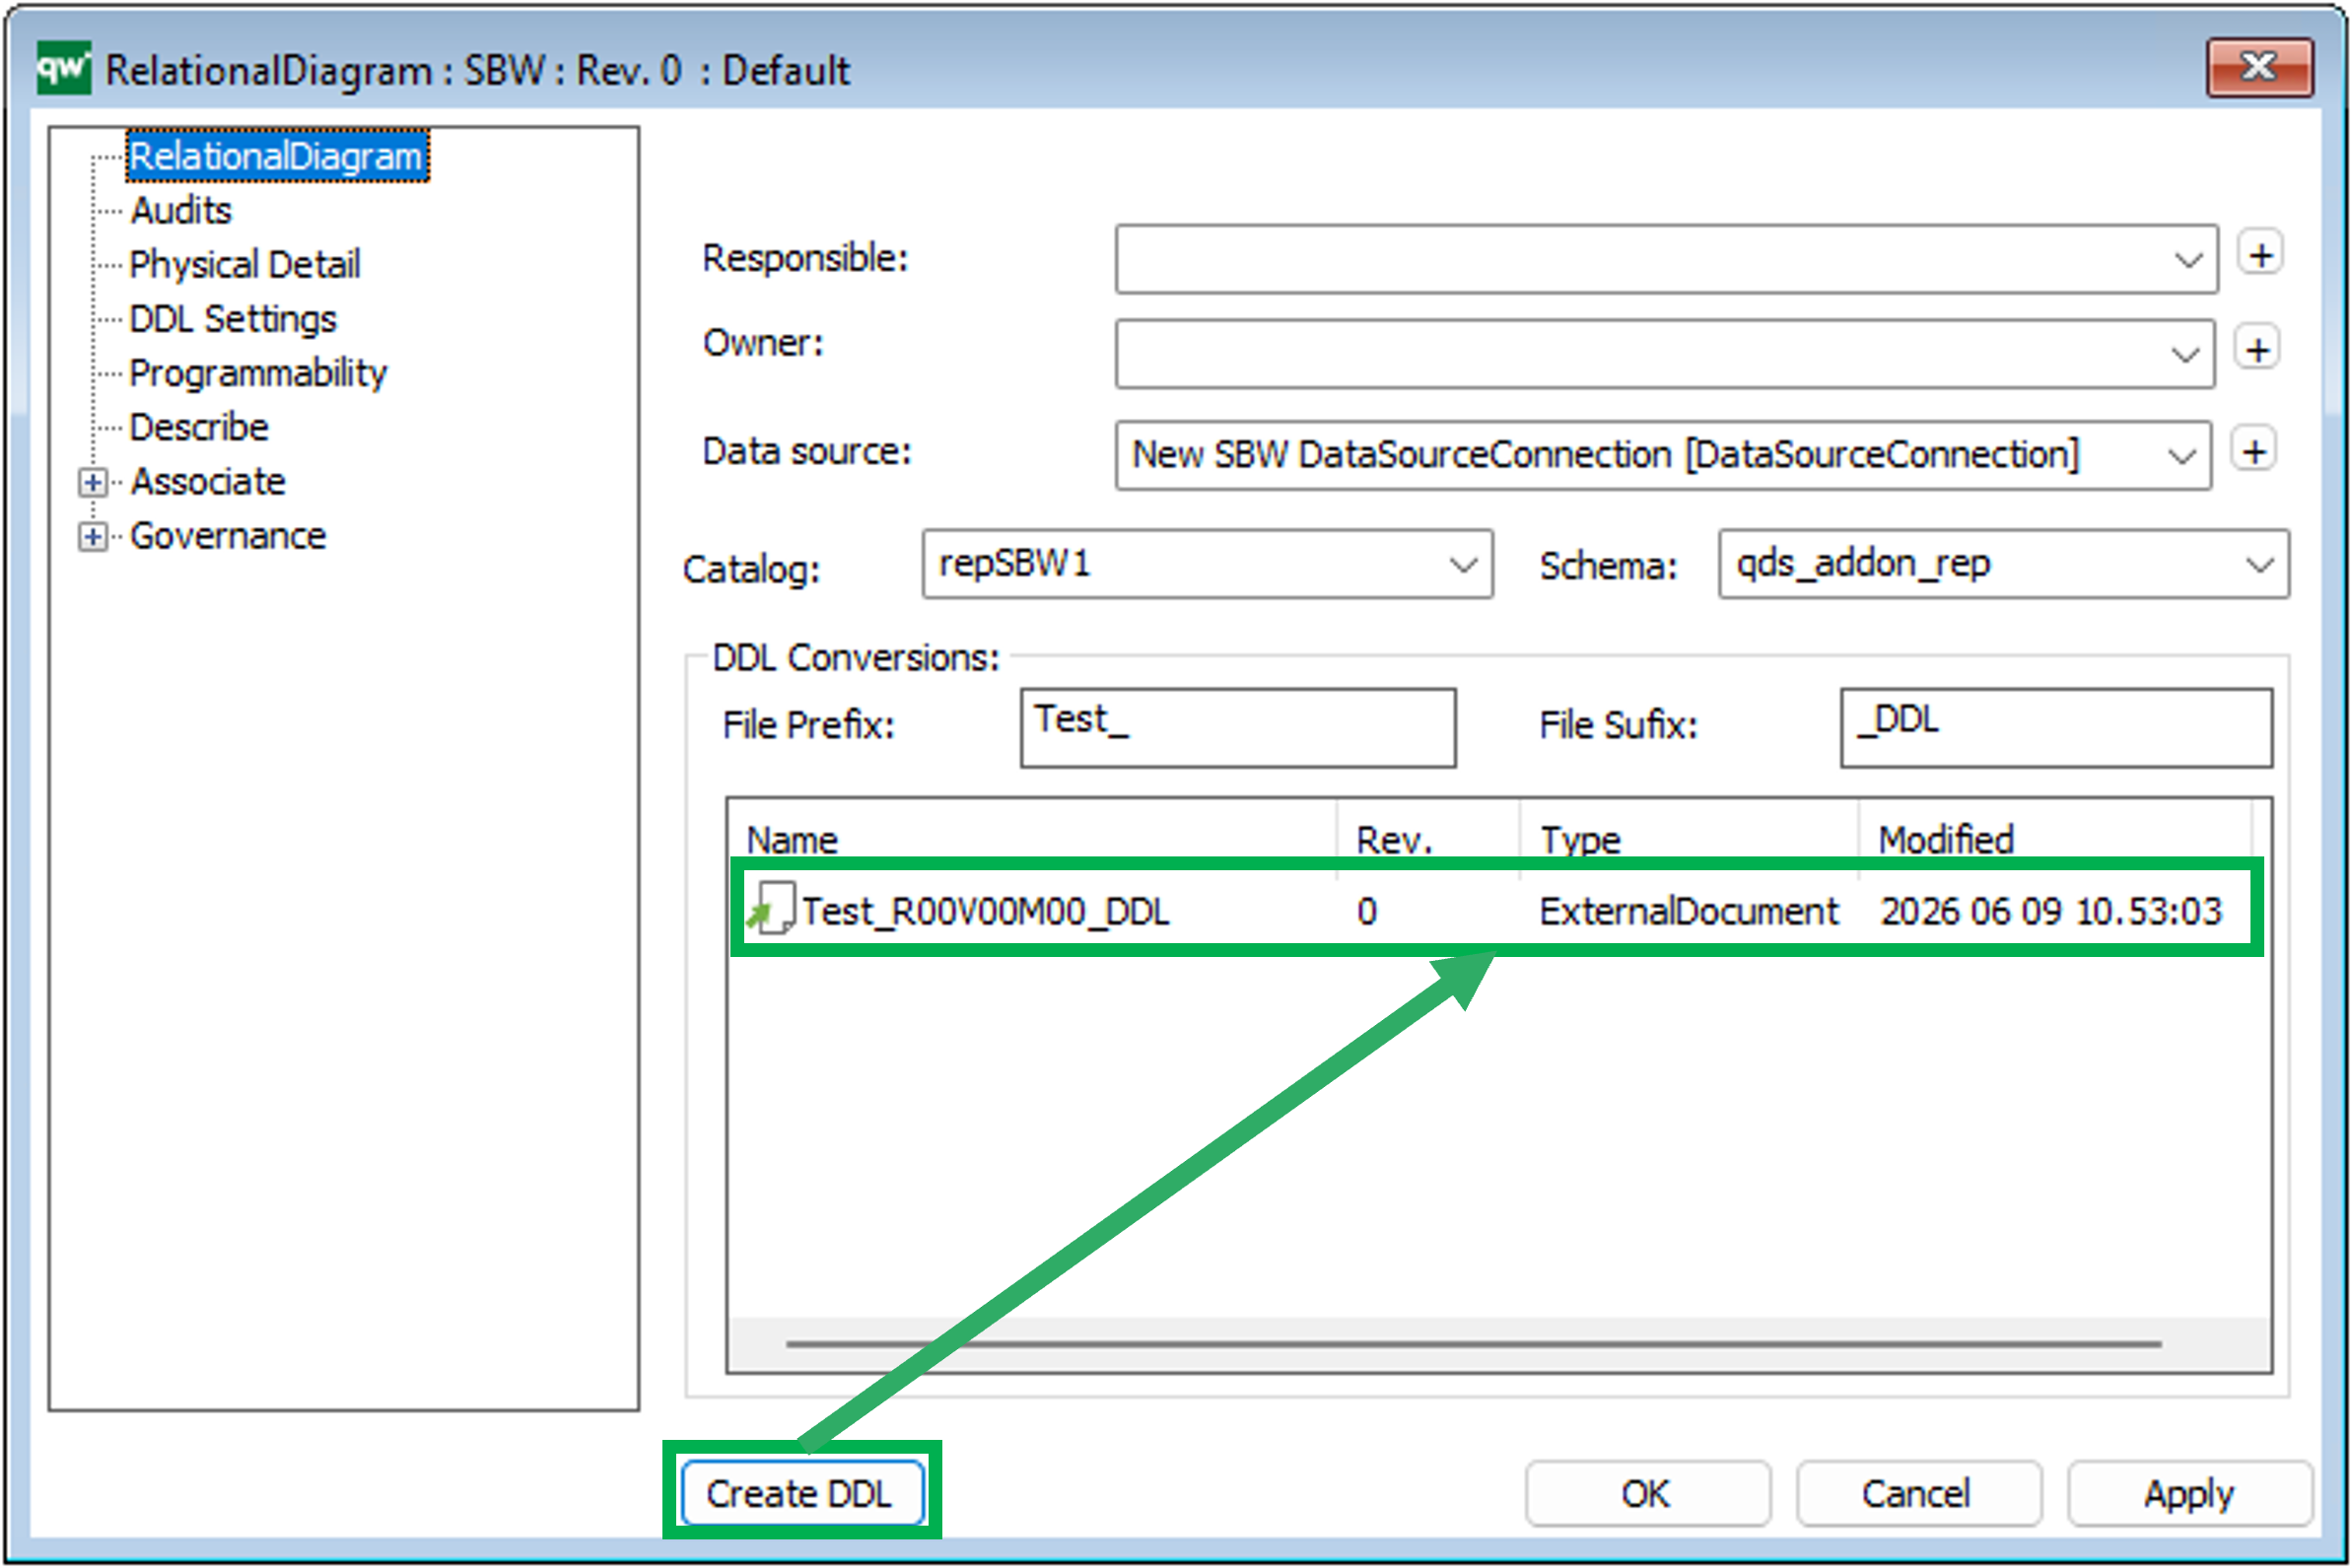
Create DDL
From the RelationalDiagram it is possible to create DDL code that can be used to create or update a database.
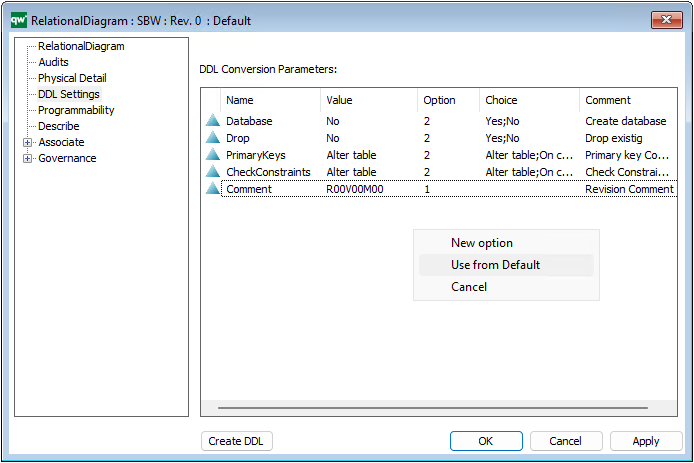
DDL conversion parameters are set on the DDL Settings tab. You can right click the box to Use default.
On the Physical Details tab you can similary add the Default settings, and choose the DDL pending action (Update/Create).
When the Create DDL is activated, an ExternalDocument will be created based upon the settings and added to the list of DDL Conversions on the RelationalDiagram.