Release Notes 10.8

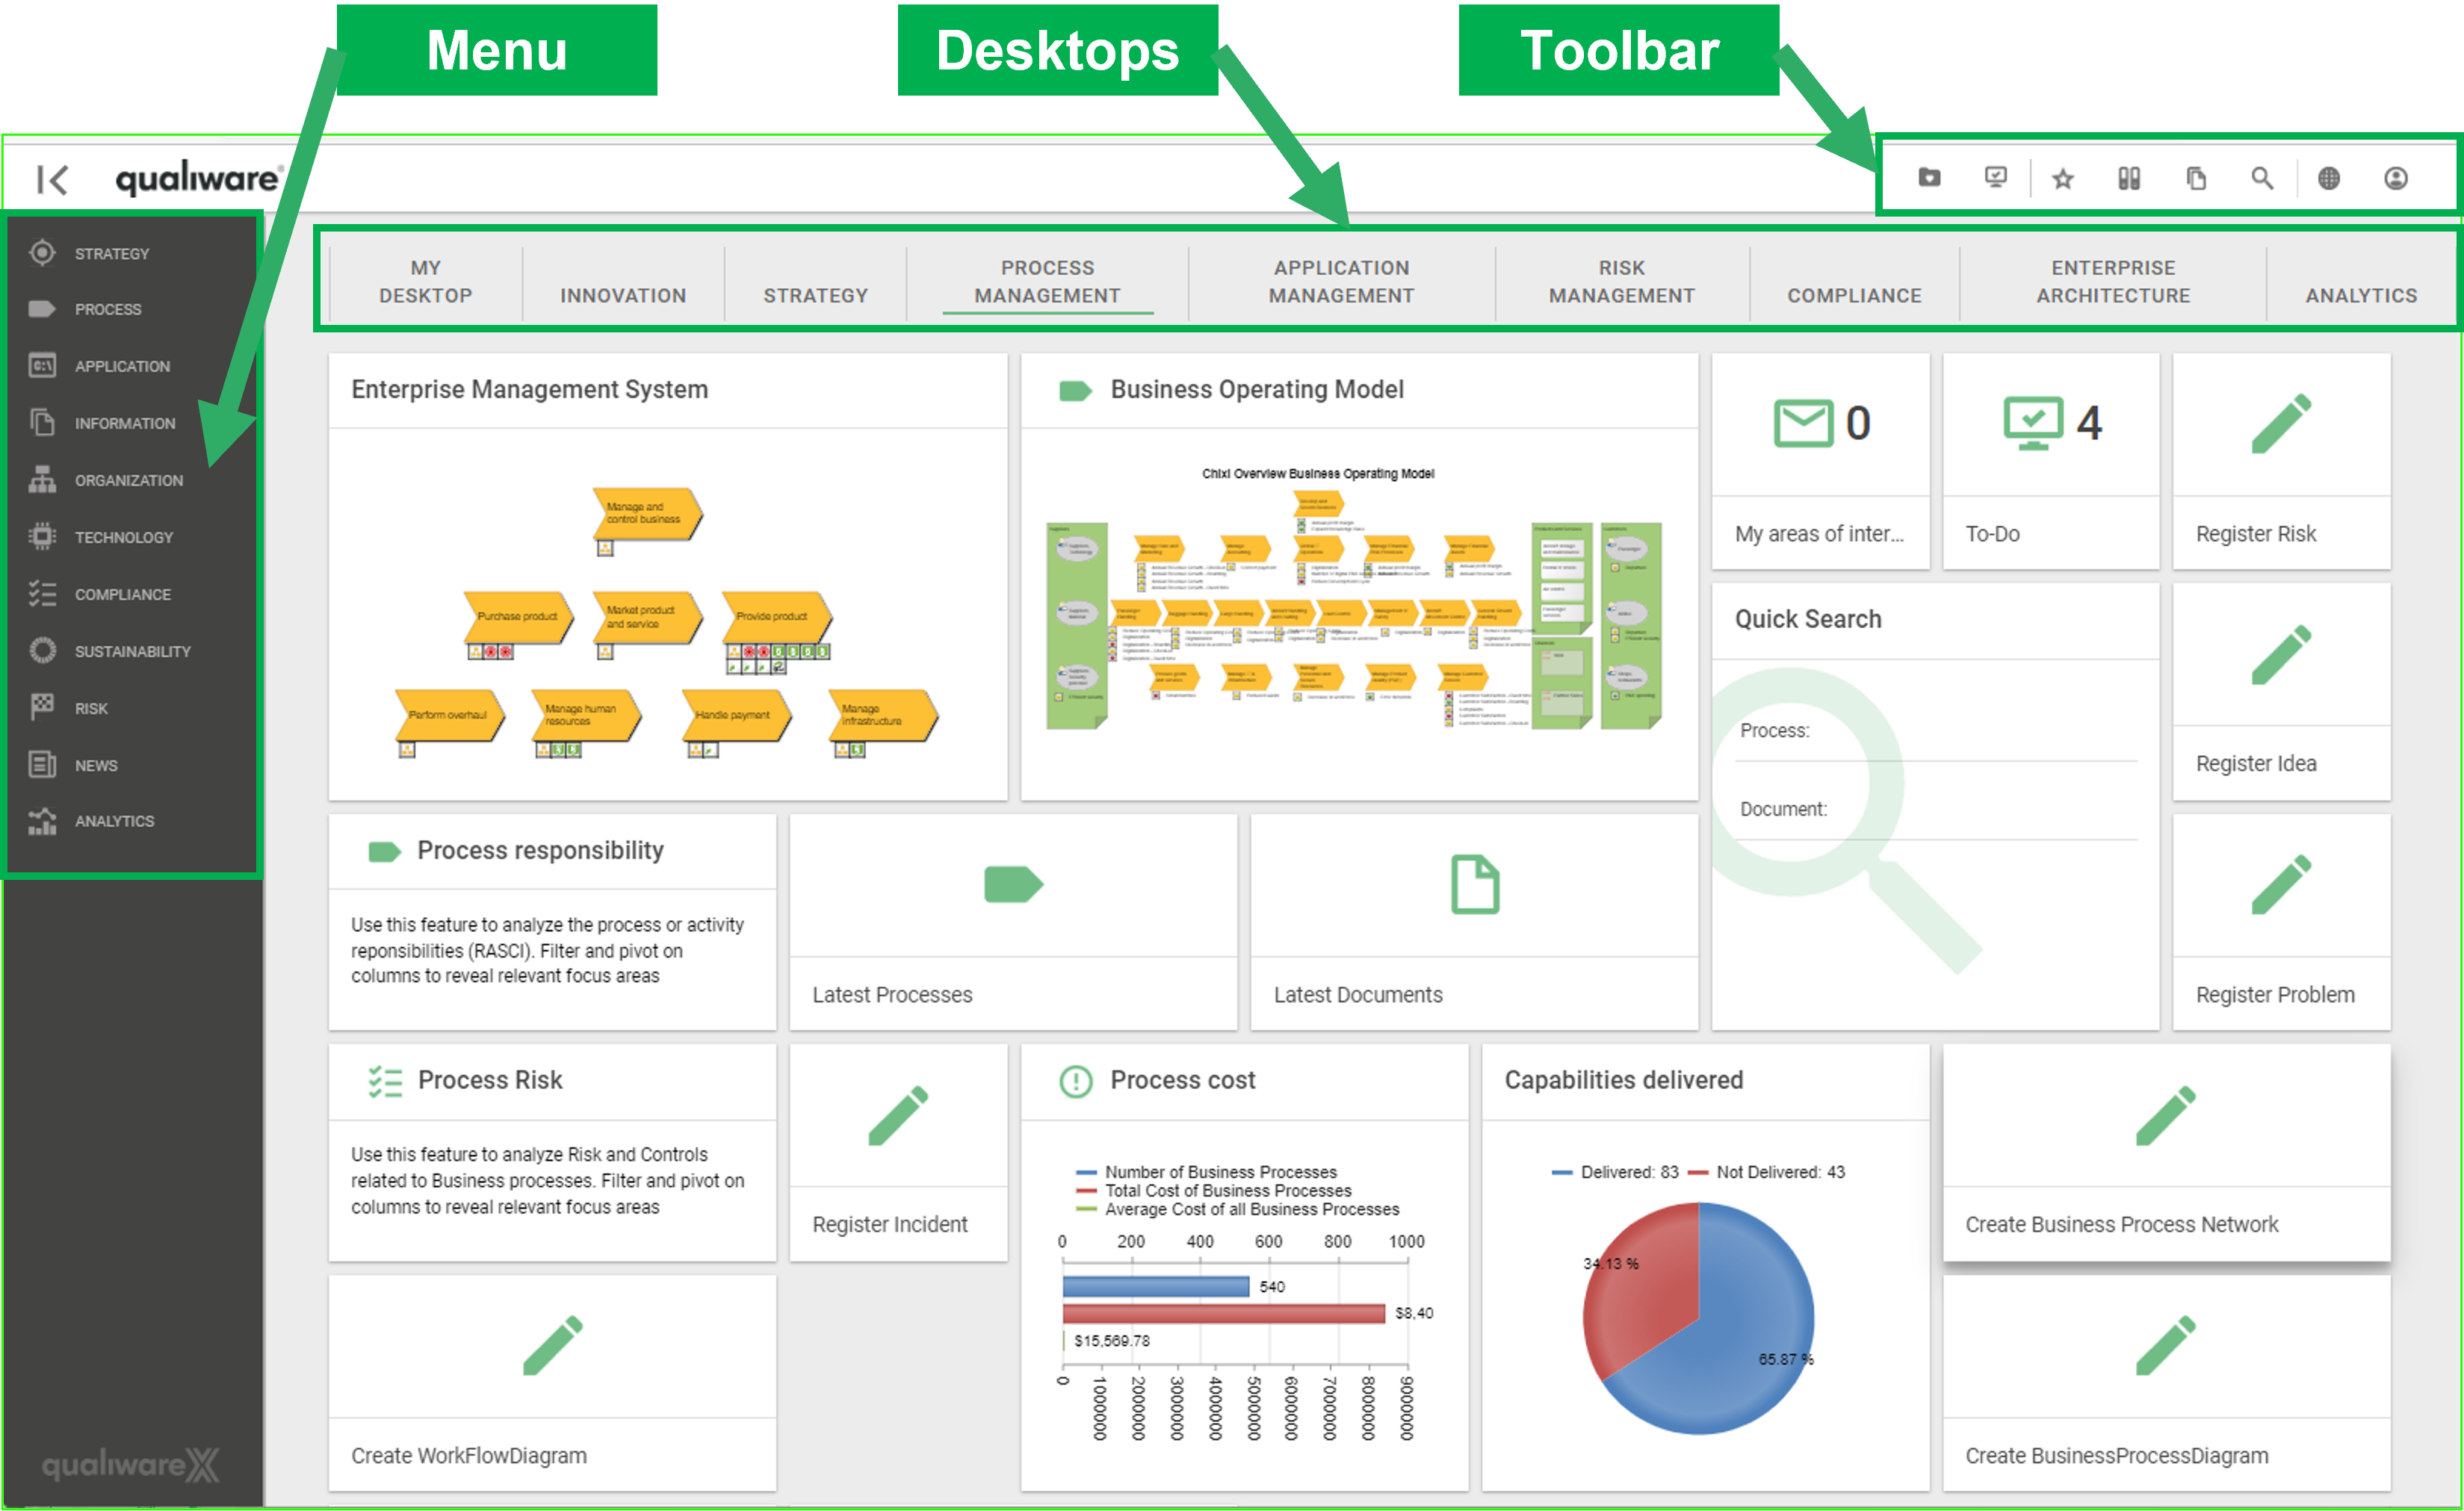
New Dashboard feature

QualiWare 10.8 introduces a new Dashboard layout with multiple new features:

  • it is possible to set up multiple layouts for a diagram type, e.g. browsing view for the content user; and a analyzing and improving view for for the content owner
  • the dashboards can be customized by the user
  • the content is responsive, showing associated data either for the diagram as a whole or for the selected object
  • a set of new tiles have been added to provide easy access to associated features, well known as well as cool new features

See more details about the new Dashboards on the feature page.

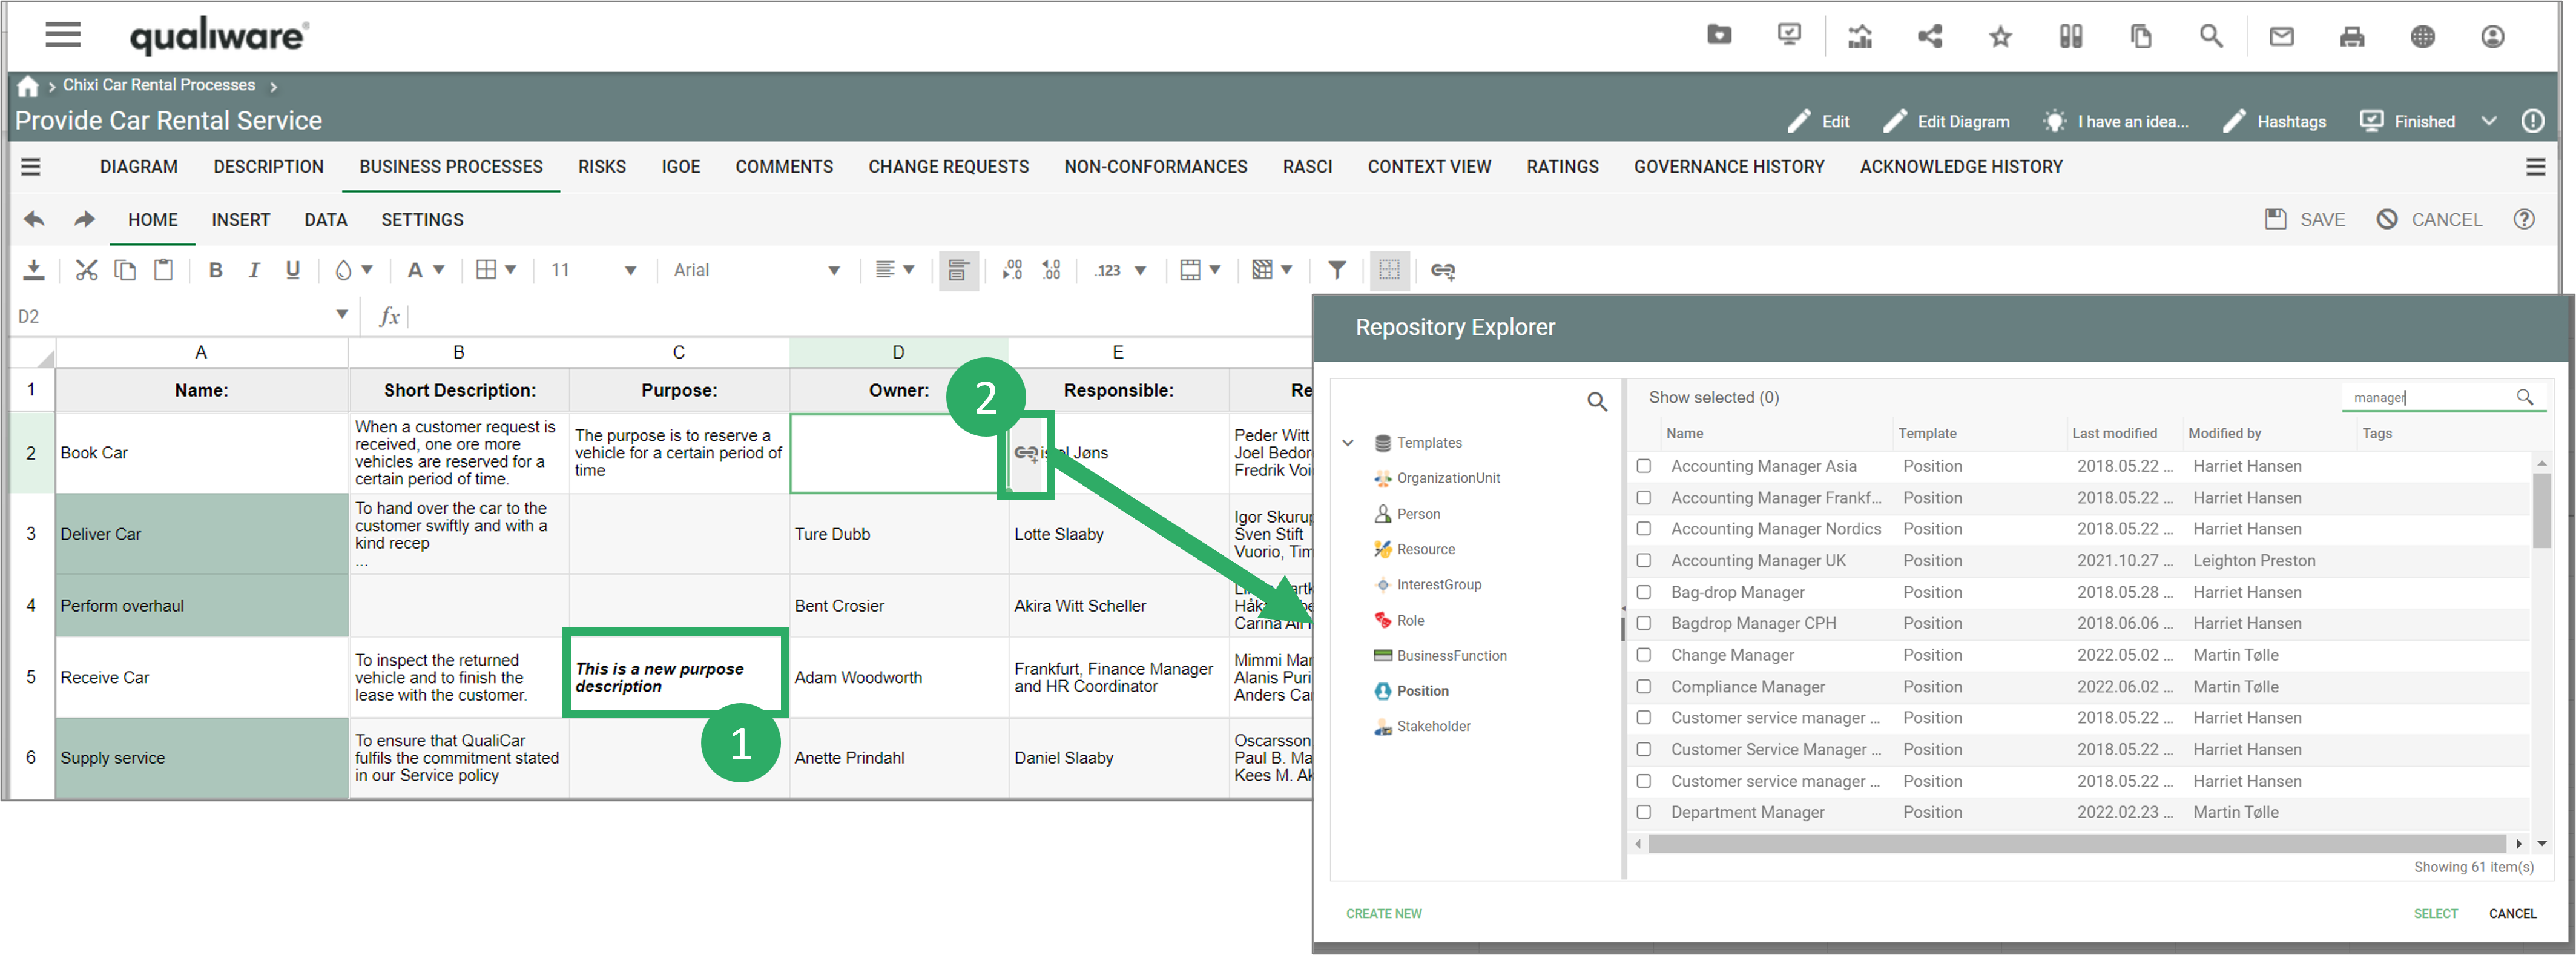
New Table-to-model feature

A new table-to-model feature has been introducced in the webmodeller to facilitate a fast and efficient creation of workflow diagrams and BPMN diagrams.

See more about the web-modeler here

More ready-made statics for GRC

A set of new lists have been included in the left menu, under “Process”, 2 lists under “High level processes/Value Streams”, and 2 under “Work processes”.

Business Process Network – GRC”  lists all the business process network with the essentional revison information (revision number, validation dates and governance state), along with information about the owner and responsible.

The list is configured, using “Postions” as process owner and responsible, and shows the person holding the position, as well as Termination Date (if available) of the person.

This list gives you get a comprehensive status of all the processes, and can used to monitors the status of the processes:

  • when has is last been modified (are they updated recently)
  • is the process still valid
  • does the process have an assigned postion as process owner and process responsible
  • does the position have a postion holder
  • and is the person still employed, or will he/she leave the company soon?

If the termination date has passed the cell will be collered red.

BPN, WFD, BPD – GRC” are structured the same way, as the one above, showing status of all process diagrams (Business Process Networks, Work Flow Diagrams and Business Process Networks) in the repository.

Business Process Completion” lists all the Business Process Networks and their Business Process and calculates a compleness score for the diagram as well as each business process.

The compleness score of the diagram is a calculated based upon how many of the following fields have been filled out:

  1. Owner (OwnedBy),
  2. Responsible (HasResponsible),
  3. Description (Description),
  4. Valid from (RevisionValidFrom),
  5. Valid to (RevisionValidTo)

The compleness score of the business process is a calculated based upon how many of the following fields have been filled out:

  1. Owner (OwnedBy),
  2. Responsible (HasResponsible),
  3. ShortDescription (ShortDescription),
  4. Description (Description),
  5. Purpose (Purpose),
  6. Ressources (Employs),
  7. UsesInformation (UsesInformation),
  8. IT Support (HasITSupport),
  9. Deliver Capability (DeliverCapability),
  10. Compliance With (ComplianceWith),
  11. Associated Document (AssociatedDocument),
  12. Valid from (RevisionValidFrom),
  13. Valid to (RevisionValidTo)

It is possible to configure the scope of the completeness score, selecting the approprate fields in the underlying query.

Work Process Completion”  lists all WorkFlowDiagrams and BusinessProcessDiagrams and their Activities, and calculates their completeness score for the diagram and each of the activities.

The calculation is similar to the one above for the Business Process Network. The only exception is that the activity completion is calculated based upon 12 fields, since “Purpose” is not part of an activity-object.

New charts on the Compliance Desktop

In addition to the new list a new set of statistics charts have been included in the Compliance Desktop, showing the distribution of the different types of process diagrams, audit, non-conformancies, and change requests according to their governance status.

Cloud Architecture Metamodel

This Meta Model customization has been created with the aim to embrace various Cloud Services providers’ solutions. In this customization, cloud services are “first” provider agnostic (they appear as “green cloud” symbols), but at time the provider is defined for a “Cloud Architecture Diagram”, the symbols in the diagram adapt their appearance to the corresponding symbol of the provider, as characterized along categories and instances defined for this provider.

As an example, the sample diagram, in the picture below, is a “Cloud Architecture Diagram” qualified with “AWS” as provider.

Another example in the picture below, is a “Cloud Architecture Diagram” qualified with “Azure” as provider.

Read more about the Cloud Architecture Metamodel here.

API Architecture Metamodel

QualiWare now supports a range of new templates to enable enterprise architects to model APIs within their existing EA repository. These templates are automatically leveraged upon the creation of an API using OpenAPI.

Architecting APIs in QualiWare can be automated using our new Web Ontology Diagrams, and the APIs themselves can be tested and interacted with directly from the QualiWare front-end by leveraging our adoption of the OpenAPI specification.

See more about the API Architecture metamodel, and how it can be used here.

G-OWL Metamodel

QualiWare 10.8 includes a G-OWL metamodel.

G-OWL is a Graphical Ontology Web Language, used to document ontologies.

An ontology is a representation of concepts and relationships among them within a domain of interest

EDGY Metamodel

QualiWare support the EDGY-language created by the Intersection Group.

EDGY introduces a set of reusable Enterprise Elements as a simple but powerful graphical language everybody can understand and relate to. This is a tool that enables designers, architects and change makers to co-design a coherent enterprise by collaboratively exploring the most impactful perspectives and translating between them.

Facet elements

  • Identity: describing the identifying elements that explain why the enterprise exists and what it seeks to achieve.
    – Purpose: A reason why our enterprise exists and what our people pursue and believe in.
    – Story: how we make sense of our enterprise and communicate to people what it does.
    – Content: what we communicate to people, expressed in information and media.
  • Architecture: describing the way the enterprise works and how its different parts fit together to deliver.
    – Capability: what we can do by orchestrating our people and assets.
    – Process: a set of related activities our enterprise carries out.
    – Asset: something we need and use to perform our mission.
  • Experience: describing the way the enterprise seeks to appear in and add value to people’s lives:
    – Task: what people want to achieve and get done (with our help)..
    – Journey: what people go through in their lives (and when interacting with us).
    – Channel: the way people engage and interact with our enterprise.


Intersection elements

  • Product: what we make, offer and deliver for people’s benefit.
  • Brand: our name and what it stands for, our reputation and image.
  • Organisation: a group of people working together to create intended outcomes.


Common base elements

  • People: individuals or groups of people relevant for the enterprise.
  • Outcome: a result, goal or change we achieve within our enterprise or its ecosystem.
  • Structure: a object or entity that is relevant to our enterprise.
  • Activity: what is being done or going on in our enterprise or its ecosystem

Parameterized GenericQueries

In QualiWare 10.8 we have introduced a new parameterized feature related to the generic queries. This allows you to re-use your the same generic query for multiple purpose.

A example of how this is used, can be seen in the new charts on the compliance desktop.

Learn more about how to create parameterized generic queries.

Cluster analysis in 3D visualization

Clustering provides users with a new way of interacting with content in their repository. It provides an enhanced analysis capability directly from the 3D Visualiser by logically grouping objects based on their relationships, concepts, and definitions. Filters can be applied to the clusters through the table-based view using existing functionality to focus analysis efforts (for example only clustering objects that are related to a risk with a high impact). The number of clusters can also be defined by the user to provide a broader or more concise result.

Once clusters have been created, users can select a specific cluster or sub-cluster to view the relevant grouping of objects. Users will also be provided with a word-cloud which is generated from various attributes of the objects in the cluster.

These clusters can be given a specific name or theme, and the selected objects can be “tagged” using an existing hashtag or by creating a new hashtag. Once the objects from a cluster have been tagged, users can easily navigate to the repository explorer to further interact with individual objects for further analysis. This provides an entirely new way of creating logical groupings of objects based on their concepts or relationships without needing to create custom folders. Identifying patterns and outliers in the repository is a valuable tool for conducting analysis, rationalisation, and transformation activities.

See more details about the new clustering feature here.

Model Gallery

A new visualization feature has been created, which make it possible to visualize multiple diagrams in one picture.

In the example below all diagrams on the “next level” is shown.

You can also explore the processes end-to-end via the connecting business event.

RepositoryExplorer – treeview

A treeview has been added to the web Repository Explorer.

This feature allows the ability to explore links between objects, such as objects contained on a diagram, or links through other attributes.

New pre-defined reports

A set of new standard reports have been created.

The reports are available from the new dashboards for the following diagrams: BusinessProcessNetwork, WorkflowDiagram, BusinessProcessDiagram, ApplicationArchitectureDiagram.

It is still possible to access available report(s) via the “Print” icon in the toolbar in the top right corner.

Here, the new standard report for the OrganizationDiagram can be found.

Required actions on governance tasks

There has been added a new tab “Required Actions” on the governance state. This is a text field, where you can use to describe/guide the user what actions that is required for the governance task.

Unattended installation

QualiWare version 10.8 now includes an unattended installer.

The unattended installer is meant for IT departments with high volume of installations, automatic deployment environments and environments with a high focus on correct initial configuration. For single deployments, the tutorial based graphical installer is recommended.

The unattended installer will install QualiWare Execution Framework (QEF) and all available modules. After the installation configuration of AccessLog databases, Repository databases, licenses and directory services must be completed.

QualiTube

Videos about QualiWare X

Release Webinar 10.9

ArchiMate 3.2. Support and ArchiMate Dashboards

EDGY 23 in QualiWare 10.9

New Features in the Web-Modeler

Repository Explorer in 10.9

QualiWare X 10.8 Highlights

QualiWare X 10.8 New Diagram Dashboards

QualiWare X 10.4 Webinar Recording

Make Smarter Strategic Decisions

Using the table to model in the Web-Modeler in QualiWare X 10.8

Repository Explorer and Context menu

Business Continuity Planning in QualiWare

QualiWare X 10.8 New Diagram Dashboards - Analyzing and Improving

Building a Business Process Network in the Web-Modeler

ArchiMate 3.1 in the web-modeler

Repository Compare

Governance, Risk and Compliance

Compliance Management

Governance Workflow in QualiWare

Business Continuity in QualiWare

Gather all your GRC efforts in one solution

The Compliance Desktop

Enterprise Architecture Use Cases

Application Portfolio Management in QualiWare

Enterprise Architecture Management

Support Transformation and Optimization

Assess and Manage an Evolving IT Portfolio

Capture, Structure, Analyze and Present Models

Innovation with QualiWare

Configuration - QualiWare X 10.8

Configuring Dashboards - QualiWare X 10.8

Configuring the Highlight DashboardItem - QualiWare X 10.8

Configuring the Visualize DashboardItem - QualiWare X 10.8

Configuring Analyses, Edit and other DashboardItems - QualiWare X 10.8

Configuring the Align with DashboardItem - QualiWare X 10.8

Parameterized Generic Queries in QualiWare X 10.8

Configuration

Creating a Gantt chart

Reverse engineering of SQL Server database

Composite Query Design

Creating a cross reference spreadsheet

Migrating external content into QualiWare

Qualiware

APM introduction

Why do organisations need Application Portfolio Management (APM)?

It has become rare for employees to experience a working environment that lacks some form of Information Technology. Applications and their supporting technologies have become critical in delivering business services. Understanding and managing when and where different applications are used, and their role in providing business capabilities is crucial for effective cost and resource management and reducing complexity.

Because IT is so dynamic and plays such a crucial role within all enterprises, it is challenging to manage without a proper tool that accounts for all the applications and their costs, resources, and interdependencies. This challenge is especially evident when keeping track of implemented, upcoming and ongoing changes to mission-critical applications while in continuous operation.

In increasingly complex environments where the IT function could exist in several departments or branches of the business, organisations are also facing so-called “Shadow IT”, where there is no clear overview and governance of the IT portfolio, leading to a situation that becomes unmanageable and increasingly difficult to address the challenges and opportunities which the business is faced with.

Furthermore, the costs of supporting and maintaining all the applications may not be optimised, as some applications may be redundant or not aligned with business capabilities.

By attending to APM as a strategic approach to managing and optimising the portfolio of applications, organisations can make more informed decisions on which applications should be included or excluded from their portfolio.

Business benefits of APM – IT as a strategic partner of the business

In short, APM facilitates the strategic alignment of the IT environment with the organisation’s business goals and objectives. A general overall efficiency in IT investment also becomes evident – where IT becomes a strategic partner of the business to ensure competitive advantage. This partnership is critical for organisations who wish to step away from silos and accelerate Digital Transformation.

Some of the key business benefits of APM include:

  • Cost Reduction and Optimization
  • Application Rationalization
  • Decision-Making
  • Increased Agility and Innovation
  • Risk Mitigation and Compliance Management

Cost Reduction and Optimization

APM enables organisations to assess the costs associated with applications in their IT portfolio. By evaluating the costs of the application – organisations can realise value, optimise spending, and reduce costly expenses on IT systems.
Organisations may find some applications underutilised or redundant in functionality, and that licences, maintenance and support costs may be excessive.

Getting notified

When a user becomes responsible for a task, they get notified in QualiWare. The system will guide them and show their required actions on the task.

It is easy to access a task in the personal to-do list from the dashboard in QualiWare.

Screenshot of the Qualiware system and where to find notifications

Spreadsheet

A new way to work

The spreadsheet functionality in QualiWare enables you easy to explore and edit the properties and the relationships for objects in the repository.

QualiWare X merges the functionalities of a spreadsheet with the functionalities of property matrices known by super users from QLM. This means that you can not only edit collections of objects and their attributes, but you can also enrich the spreadsheet with extra columns and rows, where you add notes, perform calculations and analyze the information.

It is possible to edit the objects directly from the spreadsheet by either editing their property columns directly or by selecting the object row and clicking on the “Edit” button to open the web-form for that object template.

  1. Text-fields can be edited directly in the cell.
  2. Other fields link to other objects. These can be updated by clicking on the link symbol.

Explore and update the properties on your models via spreadsheet

Properties of the object on a diagram, e.g. the Processes on a diagram can easily be described/ modified using the Spreadsheet view (“Business Processes”).

Any changes made will be highlighted in bold + italic and will only be applied to the objects once the “Save” button is clicked. As soon as the save button is clicked the QualiWare X Spreadsheet will attempt to edit the properties of all the objects with changes and will notify you if any objects are locked or can otherwise not be edited.

Objects that are locked (e.g. approved, or the user don’t have governance rights) have green background collar, and the cells in the row are grey.

Spreadsheets can be found in the left menu, and in the standard tabs for different diagrams types.

Easy access to spreadsheet from the Dashboard (introduced in QualiWare 10.8)

Video Highlights

Introduction to Spreadsheet:

This video shows how to enrich the objects (BusinessProcesses) for a particular diagram, using the standard spreadsheet view of a process network diagram.

Introduction to Spreadsheet:

Editing dropdown items, dates and numbers:

Editing text fields:

Filter and sort columns:

Adding rows, performing calculations and editing colorings:

Creating a cross reference spreadsheet

For Administrators

You create the spreadsheets in QLM using the intuitive QueryDesign approach which then generates a GenericQuery which is used in the new Spreadsheet template.

QualiWare X Spreadsheet is a new and much improved incarnation of the Property Matrix and can be used to easily get an overview over a large selection of objects in the repository and even for mass-editing data.

Unlike Property Matrices the QualiWare X Spreadsheet is available on the web front-end and can be used across the organization.

For the full list of functions that you can use in the QualiWare X Spreadsheet you can consult its technical guide: Spreadsheet Technical Guide

Smart Content Search

QualiWare X Search Engine (QSE) enables users to quickly search through the whole repository from both the web and QLM. Where the Quick Search tile only searches the names of targeted objects, the new smart content search includes searches of objects’ attributes (such as description fields and links to responsible and owners). Aside from this, the new smart content search can search though documents that have been uploaded to QualiWare. 

The search engine can be found in the upper right corner on the web by clicking on the small magnifying glass:

The search engine indexes and searches through all repository objects and their content – including the content of files that are uploaded to QualiWare via ExternalDocuments. From the web, the search result is then presented with the search term highlighted for usability:

In QLM, the search engine can be found in the right side of the tools menu, also illustrated by a magnifying glass:

In QLM, the search result is presented in an expanded message window with the search term presented in bold writing:

In QLM you can also access a search function via the top-menu, from the “Edit” menu:

From this function you have the possibility to specify search criterias, e.g. searching the whole repository or a specific template type:

If your repository has any language variants, the search engine can search through the current working language of the user as well as the repository default language. If no search results are found in the working language the search is automatically expanded to include objects from the default repository language.

QualiWare X Search Engine is built using the Lucene.Net search component and supports advanced conditional queries such as (Description:Postage) AND (AuditGS: Approved) AND (Date#AuditMD: [2017 201806]) which returns all the approved objects modified between 2017 and June 2018 with the word “Postage” in the description field.

Additional examples of supported queries can be found here.

For Administrators

In order to work, the search engine must be enabled and the repository indexed. This is done from the Repository Administrator module, which can be accessed from QEF.

The Repository Administrator module can be found in QEF under Modules:

In Repository Administrator, you need to index the repository. This is done under “Service Operations” where you click on “Recreate” under “Full-Text Search Index”. Here you can also see when the repository was last indexed:

You also need to enable the Full-Text Search. This is done under “Full-Text Search” for the Repository. Here you need to check the Status box, which can be accessed by pressing “Edit” (se the picture below). If the Full-Text Search is marked as not up-to-date, it means that you need to index the repository. Note that the repository must be offline when you implement these changes.

Intelligent Collaboration Platform

QualiWare Workspace

The QualiWare workspace is a collaboration platform, composed of one or more desktops, a left menu and toolbar.

The workspace is role-based, and configurable, so the relevant menus and desktops can be made available for a certain user role, and tiles are dynamically updated to user-specific content.

Desktop(s)

It is possible to create multiple Desktops. Each desktop can have a different focus e.g. “My Desktop”, “Process Management” or “Risk Management”. All desktops can be configured for different users and roles, i.e. both the number of desktops shown as well as the content on each desktop.

The tiles on a desktop provides access to further details and actions, including links to:

  • diagrams workspace
  • lists and queries
  • actions buttons to create new diagrams or objects
  • tiles with the users “To-Dos” or other user-specific content

Diagram Workspace - Multiple Layout

It is possible to create multiple layouts for a Diagram workspace:

  • The classic diagram workspace layout introduced in QualiWare X
  • From QualiWare 10.8 it is possible to create multiple Dashboard views for a template. Each dashboard can have a different focus e.g. “Browsing” or “Analyze and improve”.

You can configure which layouts should be available for the different diagram/template types.

Diagram Workspace - Classic Layout

The “Classic” Diagram Workspace includes a:

  1. Left window (collapsible) with information about the diagram and content related to the diagram
  2. Center tabs with specific diagram information, analytics and editing capabilities
  3. Right window (collapsible) with Business information charts

In the top right you can find diagram specific actions (governance actions and features). These enables the user to give input to the content (Create Change Request, Create Non-Conformance), Comment, Rate, Subscribe, Register an idea, add Hashtag, and being a content owner the user can also edit the diagram/Create a new revision of an approved diagram (Read more about governance workflow here).

Diagram Workspace - New Dashboards Layouts

QualiWare 10.8 introduces a new Dashboard layout with multiple new features:

  • it is possible to set up multiple layouts for a diagram type
  • the dashboards can be customized by the user
  • the content is responsive, showing associated data either for the diagram as a whole or for the selected object
  • a set of new tiles have been added to provide easy access to associated features, well known as well as cool new features

Left Menu

From the Menu in the left a user can access to comprehensive set of standard queries.

The standard menu is structured around the enterprise architecture dimensions and other focus areas.

As with everything else, the menu can be customised to contain the relevant content.

The menu can be hide/shown by clicking the icon in the top left corner.

Toolbar with action buttons

The toolbar on the upper right side gives you immediate access to your subscriptions and tasks without having to navigate to the home page. If you are viewing a diagram, this is also where you will find links to the print functionality. Aside from this, the new toolbar gives access to your latest visits, hierarchy view, repository explorer, repository compare and repository search.

The profile button in the toolbar presents a drop-down menu where you can see your username and shift between roles, configurations and languages. If you remove the profile custom button from the HTMLPublisher, your profile name will appear in the left-hand side (as it was before) and the configuration and language buttons will be shown in the upper right-hand side. If you have the profile button and add any other custom button, they will be added to the profile drop-down menu.

Video Highlights

Governance Tasks

Folding Panels

Profile Button

Subscriptions

Tiles

The tiles can also be configured, you can specify size and colors for the tiles and the color of the text will be either black or white to match the color of the tile.

In addition to the standard tiles that are well-known from previous versions of QualiWare several new tiles have been added:

  • My To-Do List is the new name of the Governance Tasks tile
  • The tile named “Help” opens the QualiWare Center of Excellence website
  • Active Users shows the number of active users both on the web and in QLM
  • Activity shows the amount of reads and changes in the repository within the last 10 minutes
  • My Ideas combines the change requests and ideas in one tile

You can now also view dynamic charts on your personal front page via tiles. An example of dynamic charts in QualiWare X could be:

  • Top 5 processes: an dynamic overview of the governance states of the top five processes. The data for the chart is collected from the users use of the QualiWare platform and the chart will change in real time.
  • Capabilities delivered: an overview of the ratio between delivered and not delivered capabilities. The data can for example be collected from measurements from KPI’s.

To learn more about QualiWare X’ Dynamic Operational Information monitoring, click here

Configuring the Workspace

All workspace content can be configured, for the organization and the different user roles:

  • Available desktops and content (tiles) on the desktop(s)
  • Look and feel for the different template types. For instance, it is possible to add information to both the right and the left side of template definitions (the view you have when you, for example, look at a diagram).
  • Content in the leftmenu

The look and feel of the collaboration platform can be configured via the HTMLPublisher.

Template Definitions

In the Template Definitions, you can specify the appearance and layout of a template-type (e.g. a Process-diagram), including if it should apply the classic view and/or the new dashboard layout.

For the Classic diagram workspace, you can specify the content for both the right and the left side, as well as add tabs in the center . You can choose if the content at the sides should be shown when the page is opened, or if they should be collapsed as default.

If you have a small screen, the tabs (on the right and left side) will automatically collapse so you have more space to read the main content – they can of course be expanded again.

Repository Compare

The Repository Compare functionality has the potential to aid all types of users. Quality Managers can for example promote the right subsets of their work from a project repository to the base configuration – thus ensuring that all of the Quality Team’s work has been considered. Project Managers on the other hand can use this feature to re-use information from other projects in their project repository, thus decreasing the need for re-work.

The Repository Compare feature enables you to open a repository explorer for two different repositories at the same time, with a column in the middle to show whether the content is alike or not. Thus differences between different configurations and/or repositories can easily be analyzed – for example between a private workspace and its base or different project repositories on the same QualiWare Integration Server.

For convenience the compare functionality is available from the Repository Explorer on the web front-end.

Video Highlight

Repository Compare

Using the Repository Compare Feature

When on the web front-end click on the Repository Explorer button in the upper right corner. This makes the Repository Compare button available.

Once clicked the Repository Compare feature will open and enable you to select two different repositories and/or configurations from the drop-down menus.

As soon as both repositories have loaded the column in the center will display any differences between the two repositories.

3 different types of signs are used to display the difference between the two repositories:

  •  The repository on the right contains an object that is not present in the location on the left
  •  The repository on the left contains an object that is not present in the location on the right
  •  Both repositories contain the same object, but the properties of the object differ across the two locations
  •  Both repositories contain the same object and the properties of the object are consistent across the two locations

For a better overview it is possible to toggle the desired comparison options to be shown via the toolbar.

The first option shows all objects. The second option shows only objects that are alike across the two repositories. The third option shows only the objects that are different across the two repositories.

If there is a difference in the properties of an object across the two locations the property difference can be analyzed by clicking on the drop-down arrow to display the difference.

The contents can then be copied either from the left location to the right or vice versa.

Added in QualiWare 10.1

Use tasks to schedule replication between repositories
Use the new “shopping cart” functionality to create lists of repository objects. If no lists exist, click in the top of the Repository Compare and click Create.
To add repository objects to a list, select one or more objects, right click on the object. Under the “Add to list” available lists will be shown. Select the list where objects should be added.

A new task scheduler enables a timer-based trigger to copy a list of objects from one repository to another. To access the task scheduler, press the “Tasks” button at the top of the object list
This will open the task schedule overview:

A Task contains:

  • Trigger: The trigger is the timer triggering the task. This can be defined as one time, minute, hour, day, week, month and year.
  • Action: The action contains the sources, destinations and lists. The Source and destination are lists of repositories with configuration/private workspace, role and language specified. The list is a selection of lists to be copied.

When adding a new source or destination it is possible to add a new QEF instance. This new feature provides the ability to copy lists between QualiWare installations.

Folders and Hashtags

Folders and hashtags, make it easier for users to find the content they are looking for. Folders and hashtags, enable you to find content in the same way as you do on social media. You can organize content according to many different views together with people you don’t know.

  • Hashtags are markers that can be attached to any object regardless if it is frozen. They can be added to an object from either QLM or the web.
  • Folders offer access to specific groupings of objects, making objects easily accessible to the relevant stakeholders. The groupings can be based on dynamic search criteria, for example showing objects the viewer has created, or pointing to a set of objects that satisfy the criteria specified for that folder.

By using hashtags and folders, you can structure and organize content in QualiWare targeting specific users or user groups.

Video Highlight

Hashtags

Hashtags

You can edit the hashtags for objects in both QLM and on the web. The hashtags can be added and removed from objects regardless if the objects are approved or in development.

From the web, you edit the hashtags for a diagram by clicking the “Hashtags” icon in the diagram’s toolbar:

When clicking the hashtags icon, a dialog will appear where you can add new hashtags by typing them and choosing submit. You can also remove hashtags. When you hover your curser over the hashtags an X will appear. If you click on the X, that hashtag will be removed from the diagram. To save the changes, close the dialog by clicking “Submit”:

In QLM, hashtags are added and removed from the objects property dialog in the “Tags” tab

When pressing on ‘Add Tag’ you get to ad either an existing tag or create a new tag:

There will be an organization of your content into the groups where it belongs – just because you add the hashtags. Once you have added hashtags to objects in QualiWare, they can easily be linked to corresponding folders. This means that stakeholder specific views now can become easily available.

Folders

Folders offer access to specific groupings of objects, making objects easily accessible to the relevant stakeholders. The template name for folders in QualiWare is “RepositoryFolder”.

The folders all point to a logical set of objects in the repository, meaning a folder points to a set of objects that satisfy the criteria specified for that folder. As such, an object may be present in multiple folders, but only exist as a single object in the repository.

By creating standard setup structures in the folders, you can replicate the structure of the business that people work. This means, that if people are familiar with the organizational structure, they can easily find the relevant content under their department. If they are more familiar with the product structure, they can find the same content under the product names, partner names and so on.

On the web, you can find the folders in the Repository Explorer menu, which can be navigated to via the new tool bar:

Here you can create new folders and edit existing ones by using the tool menu. This is also where you can browse selected template types for easy access.

In QLM, the folders can be accessed and edited in the repository explorer by clicking on the folders icon in the repository views (see picture below). This will prompt a list of folders to pop up in the repository explorer.

When you expand a folder by clicking on the plus on its left, content and sub-folders are shown. There may be several folders within the folders.

When right-clicking on a folder, you can choose to add content to it, add a new sub-folder or open the properties for the folder.

There are four tabs in the properties of the folders you can edit:

  • RepositoryFolder: here you can add a short description, include objects based on tags, exclude objects based on tags, and define the folder as a root folder – meaning the folder is present at the first level of the folder structure.
  • Objects: Here, you can include specific objects or repository folders.
  • Advanced: In this tab, you can include objects based on search conditions or relations.
  • Visibility: In this tab, you can specify which persons and roles the folder should be visible to

For more details see the description of the Repository Folder template

Navigating Revolutions – Book By Book

#DigitalRevolution and #4IR and many other hashtags related to “digital” are trending on social media. Because “digital” is a key concern in enterprises everywhere. We’re facing/undergoing a revolution (digital, industrial,..whatever, but “a revolution“). Digital this, digital that. And, Digital to the Core as Gartner pointed out in their book last year.

So, what to read this year? What’s on your holiday reading list? I will spend my summer reading about “revolution”. 

Did you know that Amazon has more than 150.000 books on “revolution”? So where to start? Hannah Arendt’s classic On Revolution? Or perhaps something more recent?

If you are interested in some “social reading” and want to join a study group, let’s arrange physical and/or virtual meetups! I’d be happy to host meetups – in my garden, at QualiWare in Farum, or in WebEx. So let me know if you’re interested!

My current reading list has the five books listed here below. They’re chosen because they’re recent and relevant.

Andrew Mcafee and Erik Brynjolfsson: Machine, Platform, Crowd: Harnessing the Digital Revolution

We live in strange times. Andrew McAfee and Erik Brynjolfsson know what it takes to master the digital-powered shift: we must rethink the integration of minds and machines, of products and platforms, and of the core and the crowd. The balance now favours the second element of the pair, with massive implications for how we run our companies and live our lives.

Klaus Schwab: The Fourth Industrial Revolution

We are on the brink of the Fourth Industrial Revolution. And this one will be unlike any other in human history. Characterized by new technologies fusing the physical, digital and biological worlds, the Fourth Industrial Revolution will impact all disciplines, economies and industries – and it will do so at an unprecedented rate. In The Fourth Industrial Revolution, Schwab (World Economic Forum) outlines the key technologies driving this revolution, discusses the major impacts on governments, businesses, civil society and individuals, and offers bold ideas for what can be done to shape a better future for all.

Don Tapscott and Alex Tapscott: Blockchain Revolution: How the Technology Behind Bitcoin Is Changing Money, Business and the World

Blockchain is the ingeniously simple technology that powers Bitcoin. But it is much more than that, too. It is a public ledger to which everyone has access, but which no single person controls. It allows for companies and individuals to collaborate with an unprecedented degree of trust and transparency. It is cryptographically secure, but fundamentally open. And soon it will be everywhere.

Patrick Hoverstadt and Lucy Loh: Patterns of Strategy

Patterns of Strategy shows how the strategic fit between organisations drives strategic direction. It is essential reading for those who wish to understand how to manoeuvre their organisation to change its strategic fit to their advantage. The 80 ‘patterns’ of strategy help you explore options for collaboration and competition within your strategic ecosystem. A practical and authoritative guide, you can use it to plan and navigate your strategic future.

Roger Tregear: Reimagining Management

Reimagining Management introduces the concepts of the 7Enablers of BPM and the Tregear Circles as part of a practical framework for the positive and controlled evolution of management practice; an approach to organizational management that focuses on the creation, accumulation, and delivery of value to customers and other stakeholders. Using this book as a guide, it’s time to reimagine management.