Add to QualiHelp
Configure the WEB
Introduction to how to configure your QualiWare web solution
One of the strengths of QualiWare is the ability to configure it to your organizations specific needs.
These needs might change as the organization grows and starts to explore different areas of QualiWare.
Through our different quides you will be able to configure your QauliWare solution. Wether it be creating your own dashboards, setting up user roles or creating your own querries.
BCM introduction
Why do organisations need Business Capability Management (BCM)?
Business Capabilities are imperative for organizations as they represent the skills, processes, resources, technologies, and competencies that enables them to achieve the strategic objectives and deliver value to its customers. Business Capabilities are in essence answering the question of “What is a company doing?” to achieve its Business Model and strategic Goals that have been set by the organization.
When organizations have a clear overview of their Business Capabilities, they may find an increased ability to:
- Adapt and be agile ✅
- Allocate resources where necessary ✅
- Innovate to stay ahead of the curve ✅
- Assess areas of the business that are a risk in realizing the Business Model ✅
All this ensures that Enterprise Architecture and Business Architecture can evolve and be optimized.
Business Capabilities in QualiWare
In QualiWare, Capabilities can be linked to areas across the business through the relevant templates. This makes Capabilities actionable by tying all relevant business operations, resources, and information to the relevant Capabilities.
To map out Business Capabilities you will often formalize a Business Capability Map/Model. A Business Capability Map which allows people from across the business to see the structural elements of what the organization is doing, how important each element is and how well it is performing in executing it. The Business Capability Map enhances decision-making across departments so that the business is aligned and can be optimized strategically and operationally in the future.
Who to involve when defining Business Capabilities?
There are various opinions on the matter of who to involve, when defining the Business Capabilities of an organization. Some advocate for a top-down approach, where other approaches emphasize a holistic inclusion of actors in the organization that make up ‘What’ the organization is delivering to maintain a competitive advantage and produce its products.
Oftentimes the Business Capabilities are made from a top-down approach with stakeholders who come from more senior business leaders and specialized technical roles. This is an enterprise-level perspective. However, other frameworks such as EDGY emphasize the need for Architectural thinking to be applied by multiple business experts across the business as part of a collaborative co-design process. EDGY argues that failing to realize Business Capabilities more holistically will result in IT heavy capability maps rather than Business Capability Maps. This is a more bottom-up approach, that allows an enterprise-wide Business Capability map. However, it is generally advised that the bottom-up approach need to be strongly guided by strong governance and senior leadership support.
The organization must internally make decisions on who makes and how the Business Capabilities are defined. Oftentimes a mixed approach is feasible where initially a top-down approach may be driven in the first instance of the formulation of capabilities, where at later stages a bottom-up approach can be included in the co-creation of business capabilities from across the business that creates the enterprise-wide business capability map.
QualiWare supports working with Business Capabilities from various viewpoints and templates in BusinessCapability, EDGYCapability and ArchimateCapability.
Difference between Business Capabilities and Processes
Business Capabilities, concerned with “what” an organization is doing must not be confused with Business Processes, which explain the “How” an organization is performing said Business Capabilities. The Business Capability is there for realized by skills, processes, technology and resources. Business Capabilities is to be seen in a strategic view, while Processes are what drives the transformation.
Read more
QualiAI
Introducing QualiAI QualiWare’s Cutting-Edge Generative Artificial Intelligence
- AI-Powered Diagram Creation: With QualiAI, harness the power of artificial intelligence to automatically generate diagrams from various types of context, making the diagram creation process more efficient and user-friendly.
- Intelligent Context Analysis: QualiAI analyzes the given context to create initial diagram drafts, providing a valuable starting point and streamlining the diagramming process for creators.
- KnowledgeScope Templates: Utilize our innovative KnowledgeScope system to guide the AI, ensuring the diagrams generated meet your specific needs and context requirements.
Getting Started with QualiAI
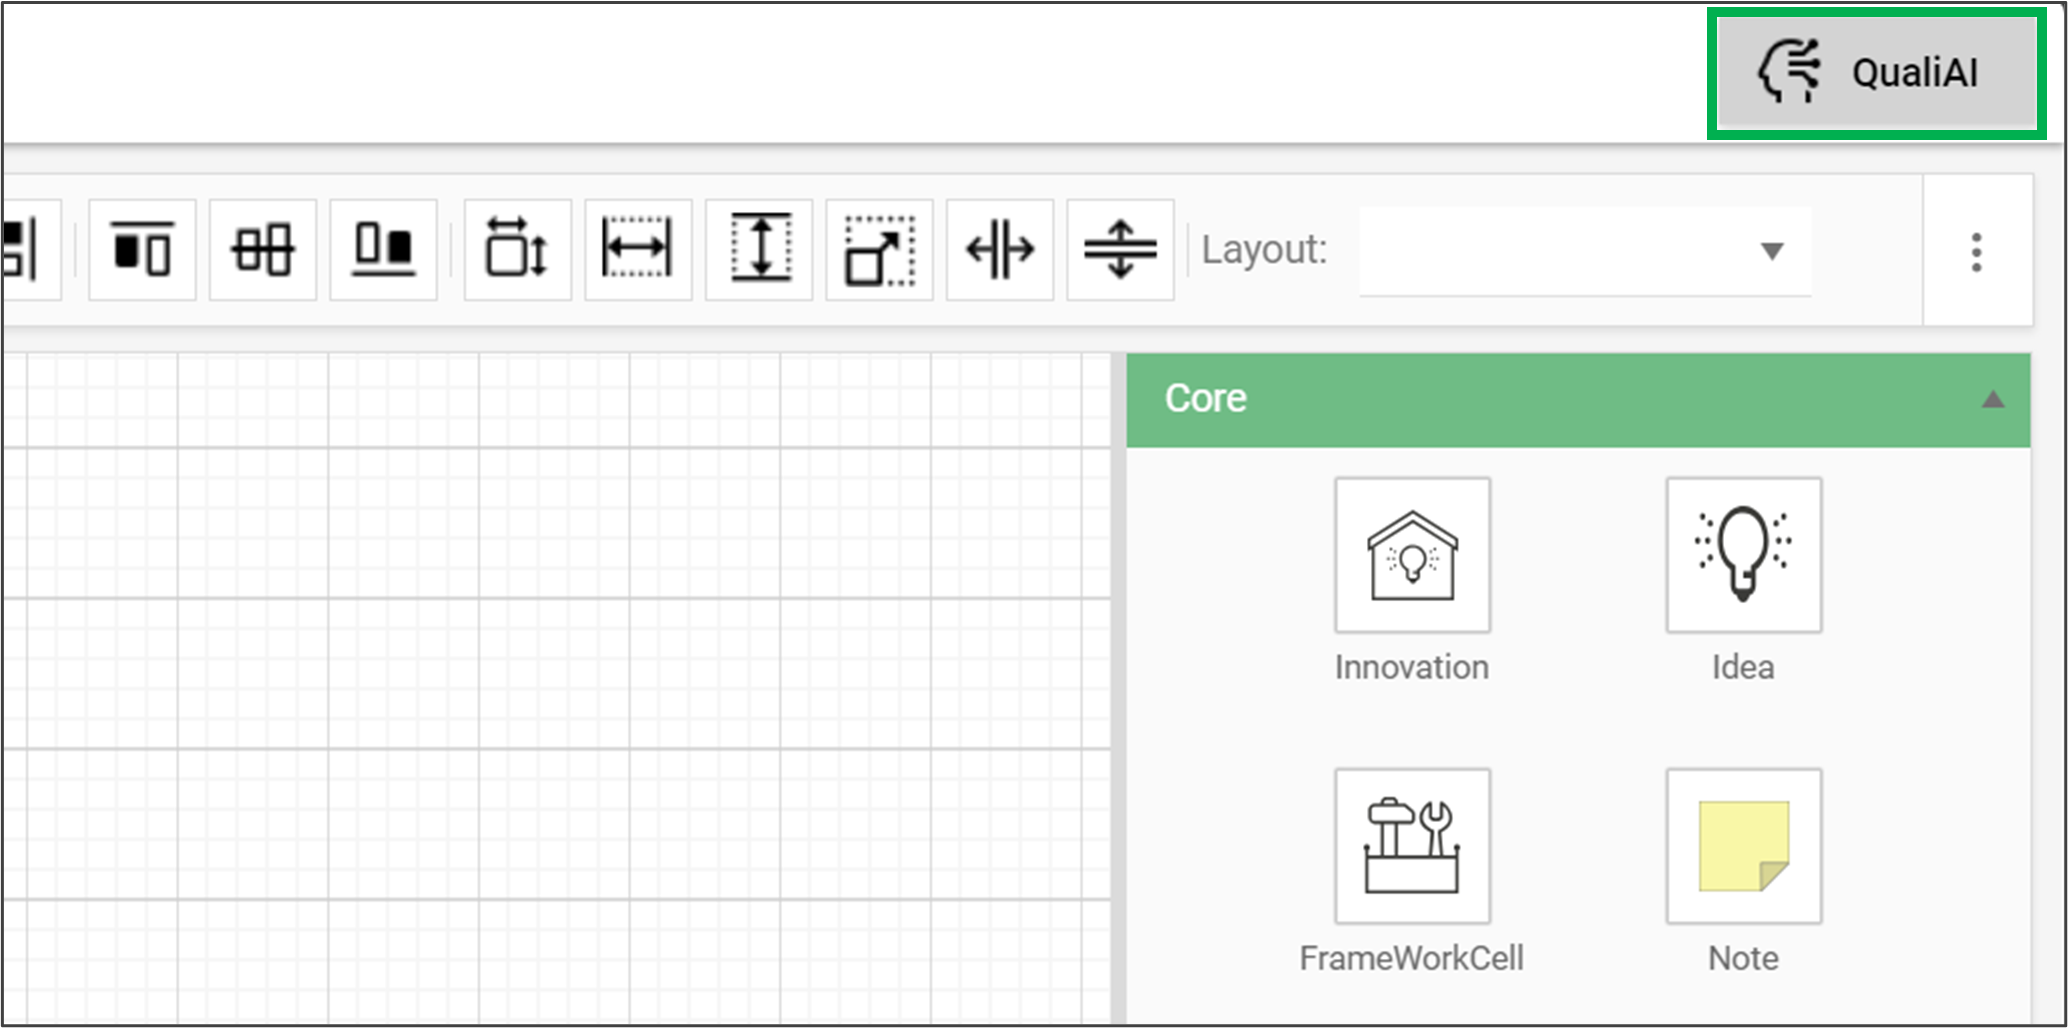
When you open the Web-Modeler, you will find a new button in the upper right corner of the interface. This button is your access point to enable QualiAI. Should the button display in grey, it indicates that QualiAI is either not configured or incorrectly set up.
For assistance with setting up QualiAI, please refer to this link.
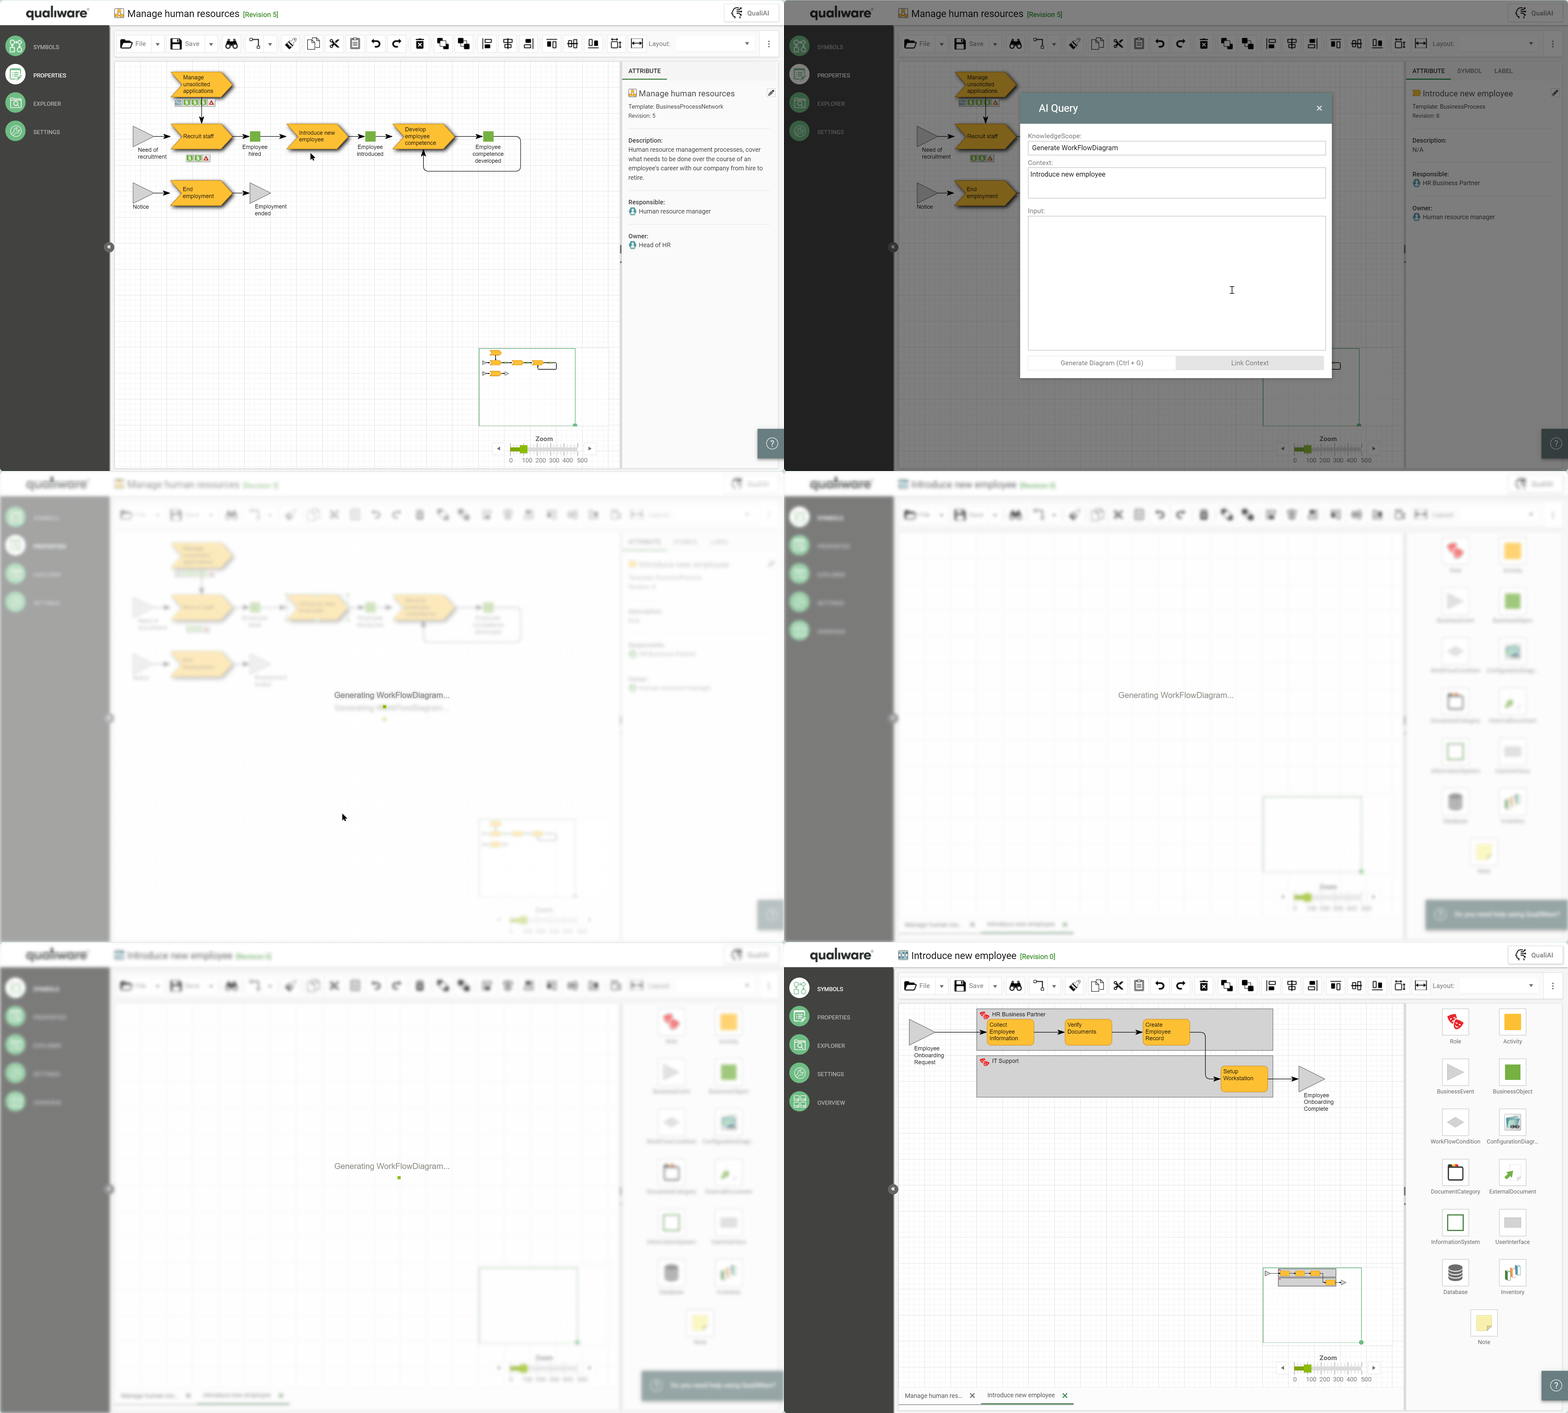
AI Query Window
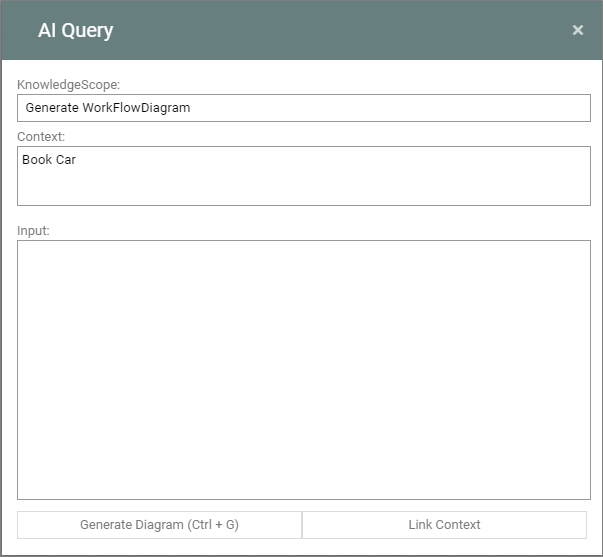
- KnowledgeScope: Clicking the QualiAI button prompts the system to determine the relevant KnowledgeScope based on your current position in the product or the objects selected. If multiple KnowledgeScopes are deemed relevant you will be able to choose from a list.
- Context: The Context field will show what object(s) are currently used as context for the AI.
- Input: The input text field is for any additional Context or Instructions for the AI to create the desired content.
- Buttons:
- Generate Diagram: Use the ‘Generate Diagram’ button to start the AI Generation.
- Link Context: Use the ‘Link Context’ button to specify context from the KnowledgeScope’s predefined templates.
Crafting Your Diagram
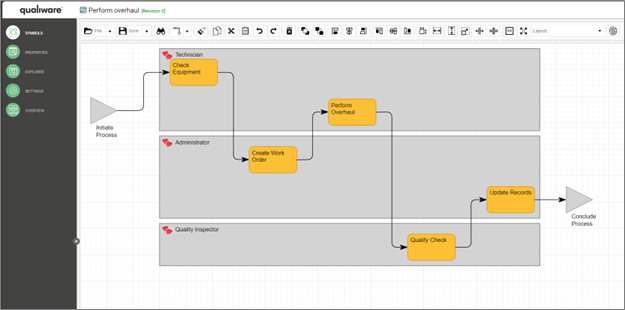
Using QualiAI for Diagram Drafting After providing context and instructions, QualiAI will proceed to generate a draft of your diagram. This can be displayed in a new tab or directly in the current editor, contingent upon the context source.
Example Workflow:
- Diagram Drafting: An example of QualiAI’s capabilities is the creation of a WorkFlow Diagram for a process titled ‘Perform Overhaul’.
Final Touches:
After QualiAI provides the draft, you can refine and finalize the diagram, ensuring it meets all your requirements and standards.
Support & Resources:
- Setup Guide: Access a step-by-step guide to setting up QualiAI for your organization.
- KnowledgeScope Details: Learn more about tailoring KnowledgeScope templates for optimal AI performance. (Include link to KnowledgeScope page)
Remember, while QualiAI aims to facilitate diagram creation, the generated diagrams are drafts to be perfected by you, the creators, ensuring that the final product is precise and tailored to your specific needs.
More information:
Release Notes 10.9
- Multi diagram support in web-modeler
- New Diagram Types in the web-modeler
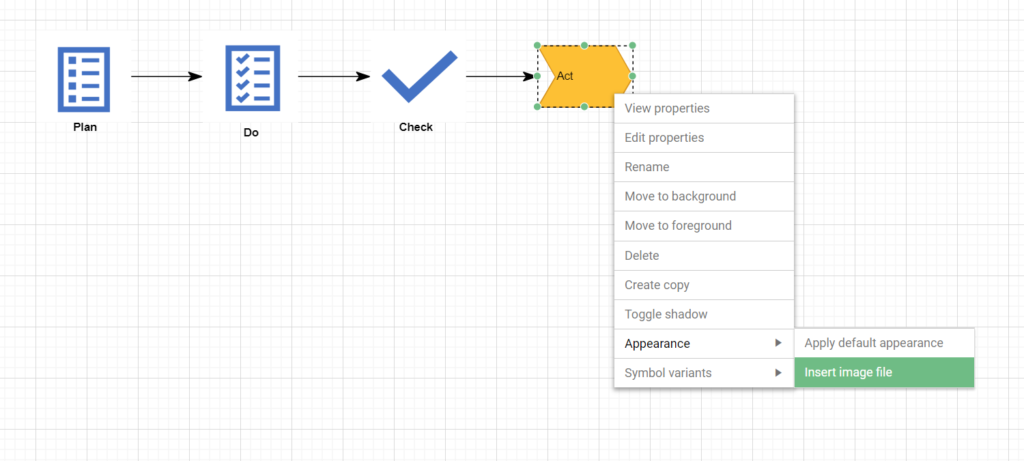
- Paste custom picture on symbol
- Graphical compare in web-modeler
- QualiHelp
- ArchiMate 3.2 support
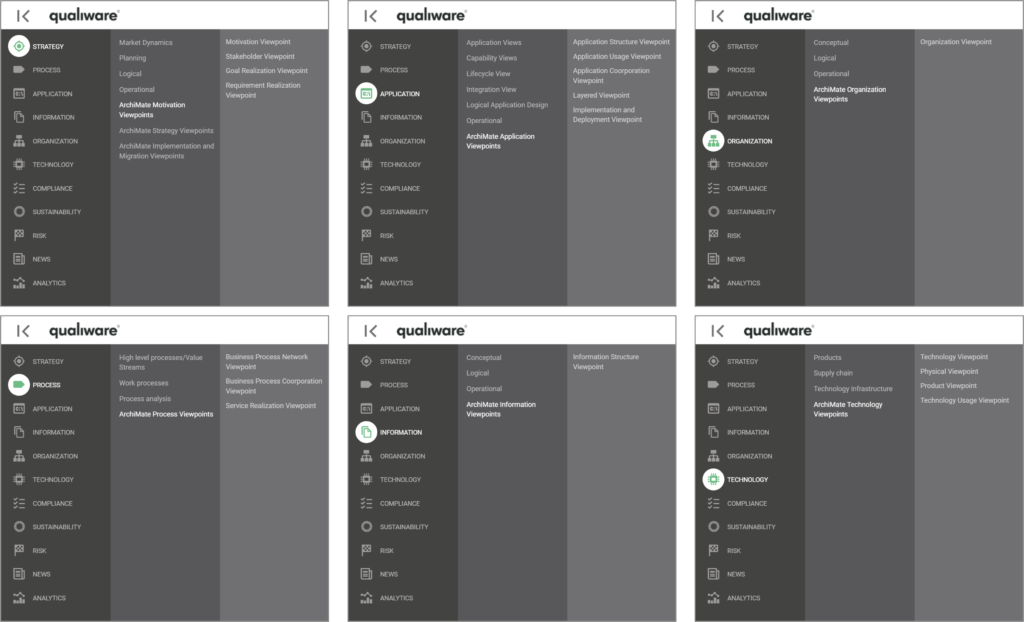
- ArchiMate specific dashboards
- EDGY desktops, dashboards, relations and visualizations
- Business Architecture Desktop (PRG Framework)
- Governance: Allow Object Owner to handle changes
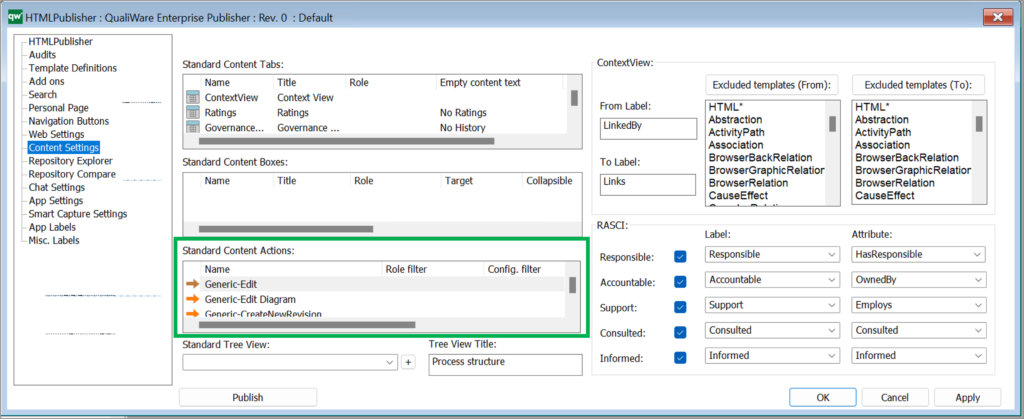
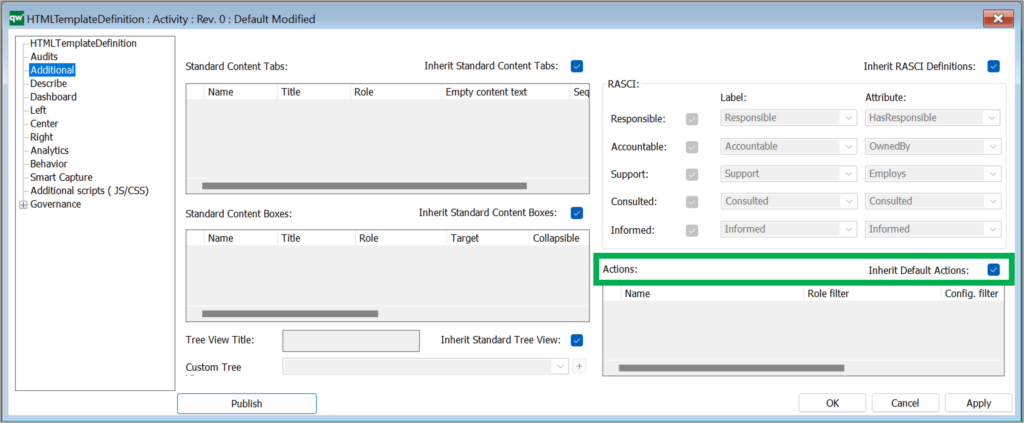
- Governance: HTMLPublisher define default actions/features for objects not under Governance.
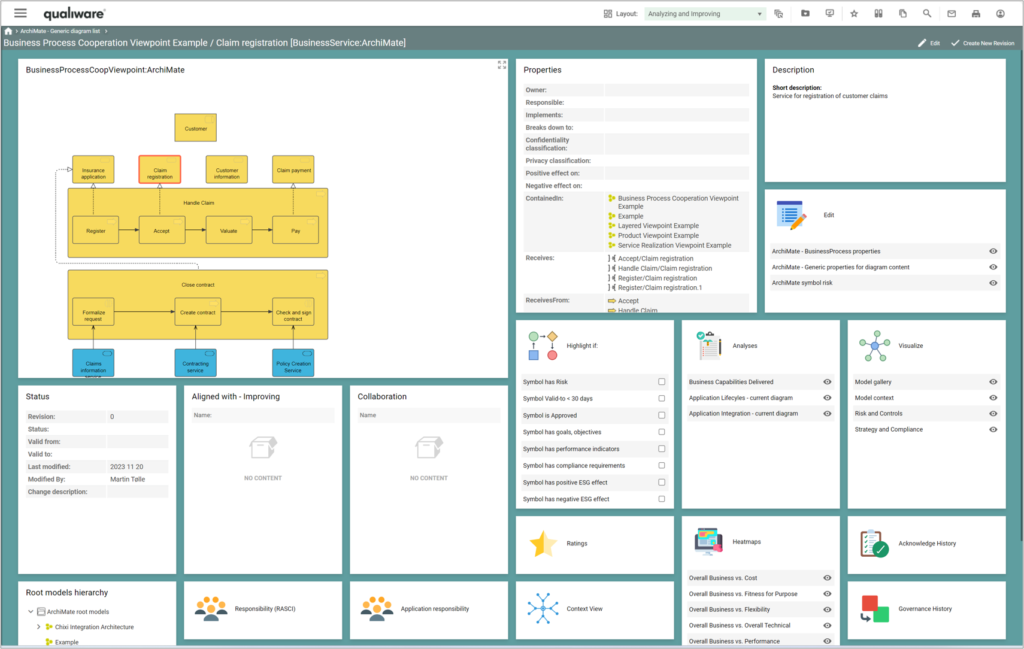
- HTMLDashboard: Context Dependent Tiles
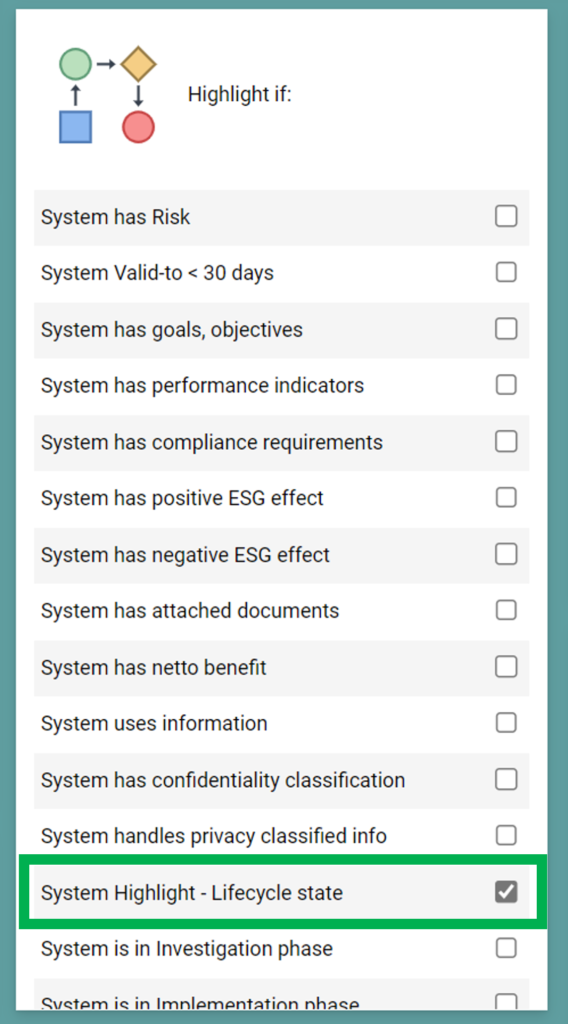
- Dashboard: Multiple Highlights (e.g. Application LifeCycle)
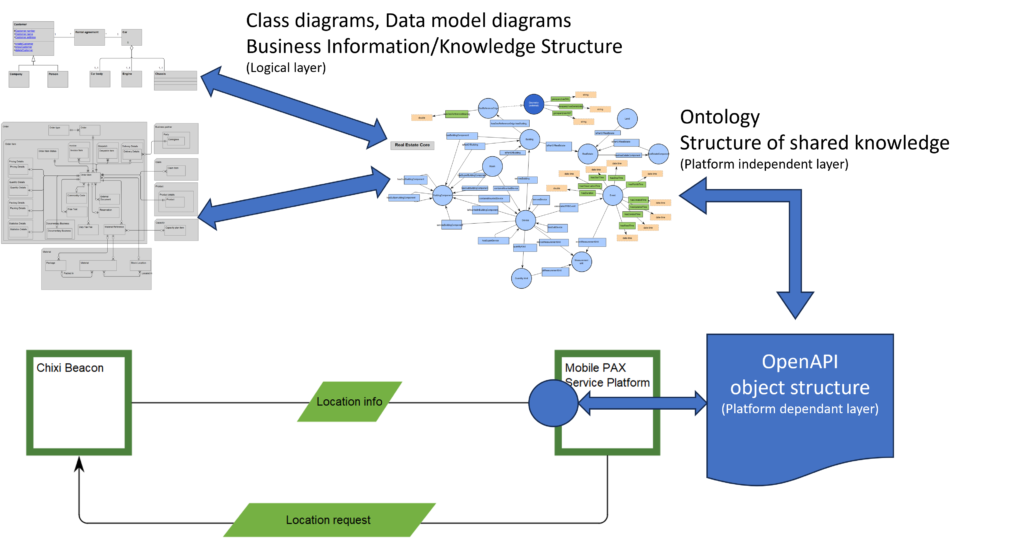
- Information model -> Ontology -> OpenAPI
- Standard properties in HTML Dialogs
- Object ACL management
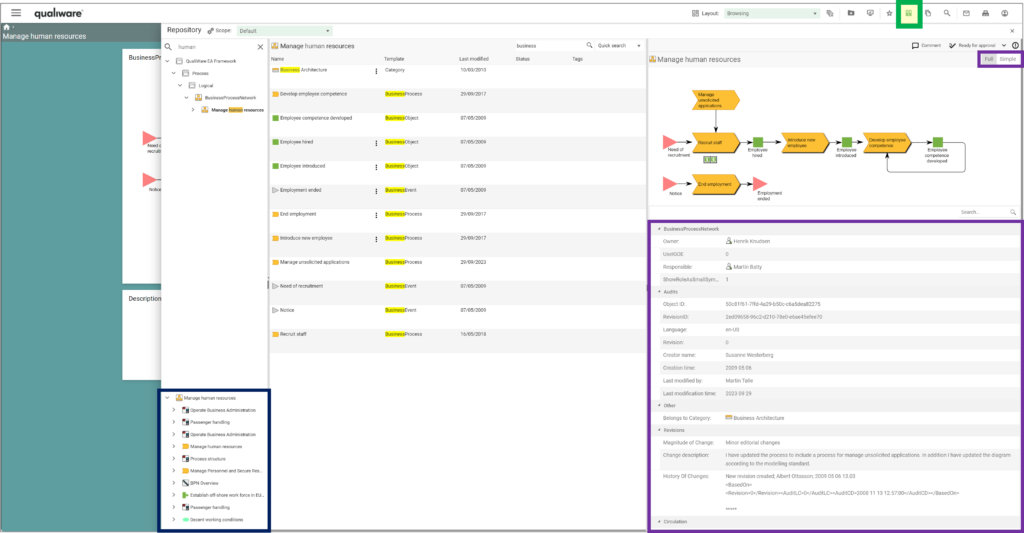
- Repository Explorer Properties
- Save/Load dumps from RA
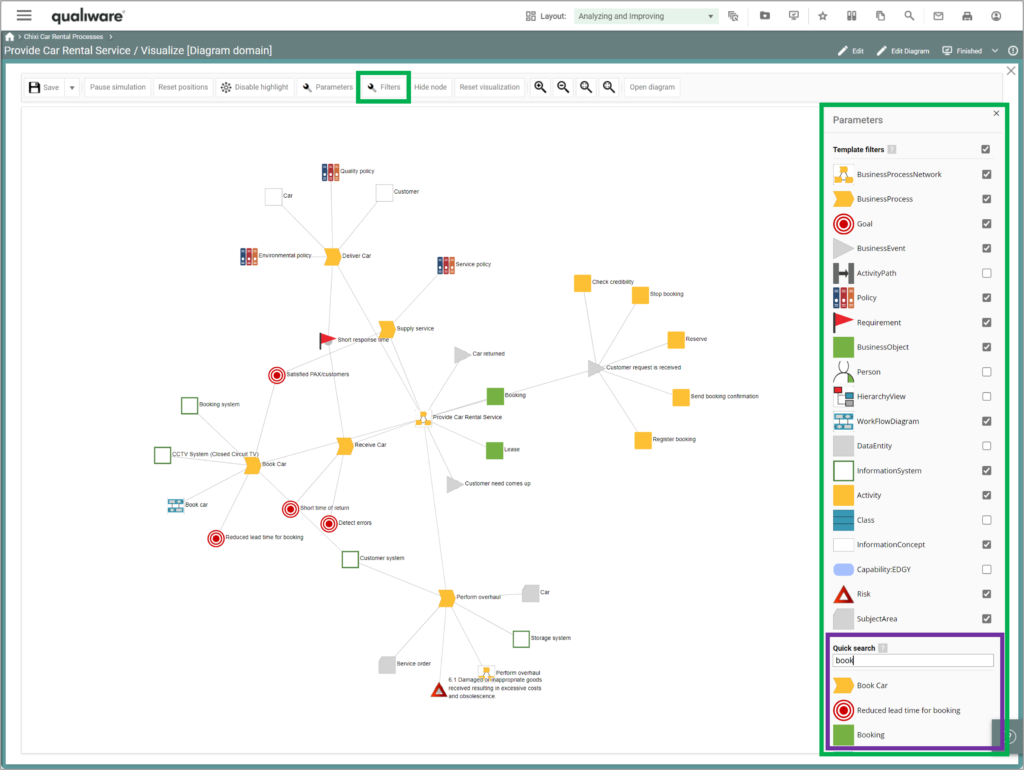
- Visualizer features
- QuickSearch: Search in specified attribute
- Translation: LL on dialog text
- Generic REST API (QCL, QTS, JS)
- AI-generation of diagram and content
More web-modeler enabled diagrams
- BalancedScorecardDiagram
- BusinessObjectModel
- Firewall
- FreeHandDiagram
- IntegrationView
- LifeCycleAssessmentDiagram
- ProductArchitecture
- ProductCanvas
- ProductionSite
- ProductRoadmap
- TransformationPlan
- UseCaseDiagram
And a whole new diagram type has been intoduced in QualiWare 10.9:
See more about the web-modeler here
Paste picture on symbol
This can be used to make your models more graphically and personalised.
Graphical compare in web-modeler
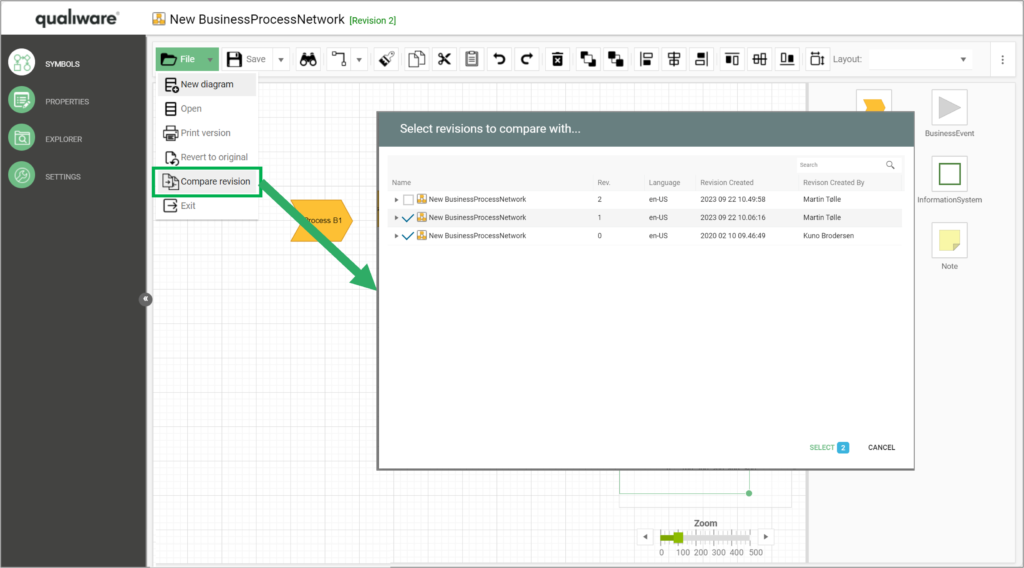
Select “Compare revison” in the File menu, and select the revions you want to compare with the most recent version.
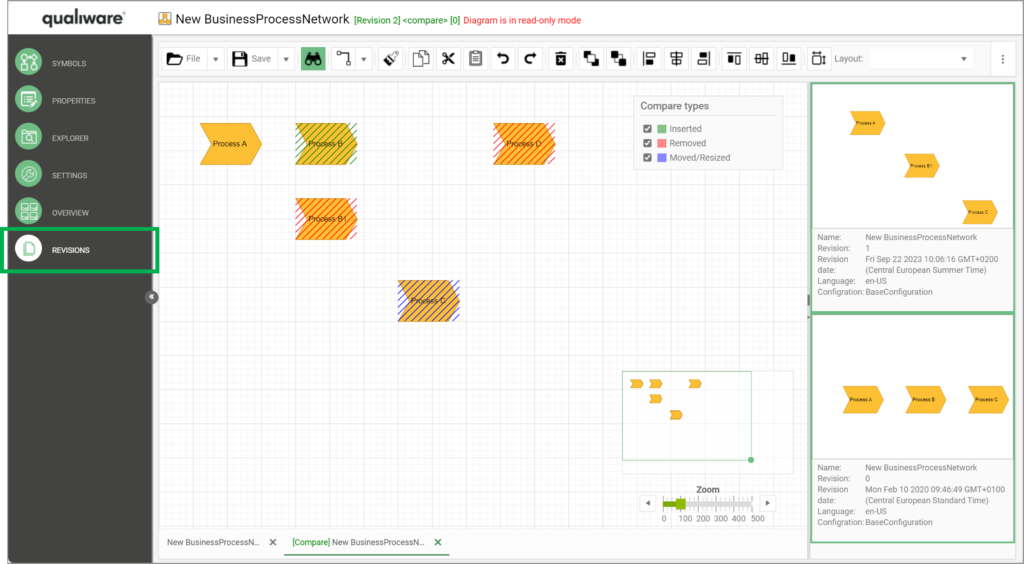
The feature creates a new tab with a graphical comparison. In the right pane you can select the revision you what to compare with the current revision. The windows highlighst the changes in the objects between the two revisions.
QualiHelp
Inside the Web-Modeler
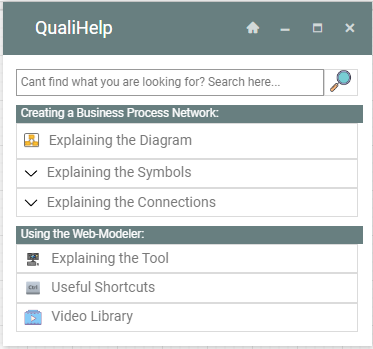
- User-Centric Design: Designed with you in mind, QualiHelp delivers timely and relevant assistance when creating the diagram.
- Smart Context Recognition: Working on a diagram in the web-modeler? QualiHelp discerns the context and swiftly retrieves the relevant guides for you.
- Comprehensive Guidance: Be it the diagram, symbols, or connections, QualiHelp ensures you’re equipped with the right information every time.
Outside the Web-Modeler
- Extended Support: QualiHelp serves as a comprehensive resource center, providing easy access to a wide range of QualiWare tools and resources, catering to diverse user needs beyond the Web-Modeler.
- Static Resource Access: This mode offers direct links to essential resources such as Getting Started guides, FAQs, and the latest QualiWare updates, ensuring key information is readily available.
- Consistent User Experience: QualiHelp ensures a uniform, user-friendly experience across the QualiWare platform, offering the necessary support and information regardless of where you are in your QualiWare journey.
Read more about QualiHelp here
ArchiMate 3.2 support
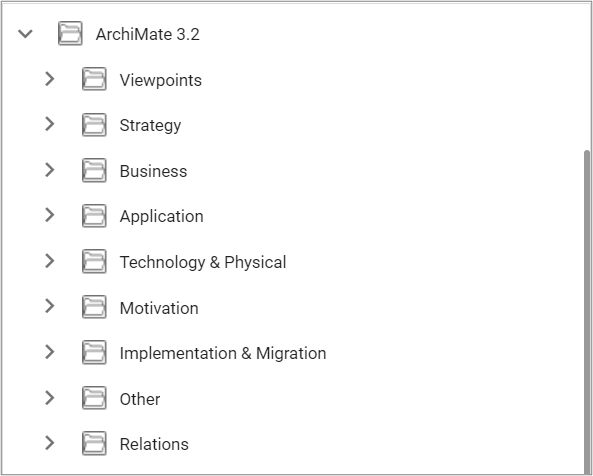
As a member of the Open Group QualiWare has been supporting ArchiMate for many years, and has updated the tool to support the latest version of the ArchiMate 3.2.
ArchiMate Specific Dashboards
The new dashboards contains the new standard property tiles, spredsheets and highligh features.
EDGY desktops, dashboards, relations and visualizations
A whole new set of desktops and dashboards have been developed together witht the Intersection Group, and the underlying metamodel have been updated to the latest version of “EDGY 23: Language Foundations”
The dashboards for the different EDGY maps have been updated to reflect the latest changes in the language, including the relationship between the different EDGY elements.
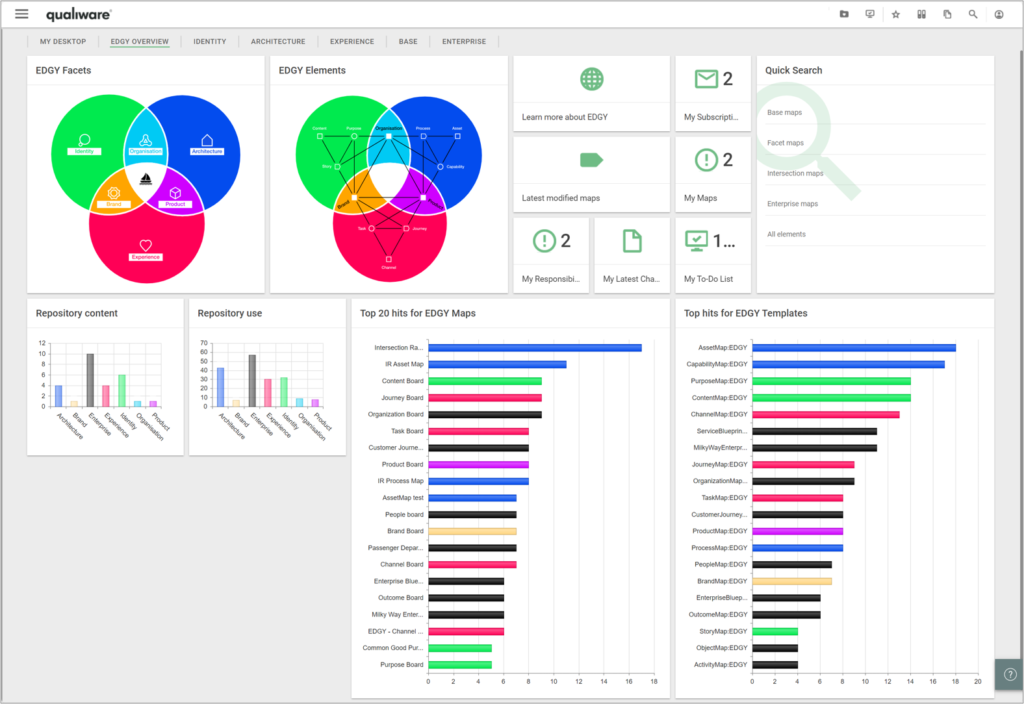
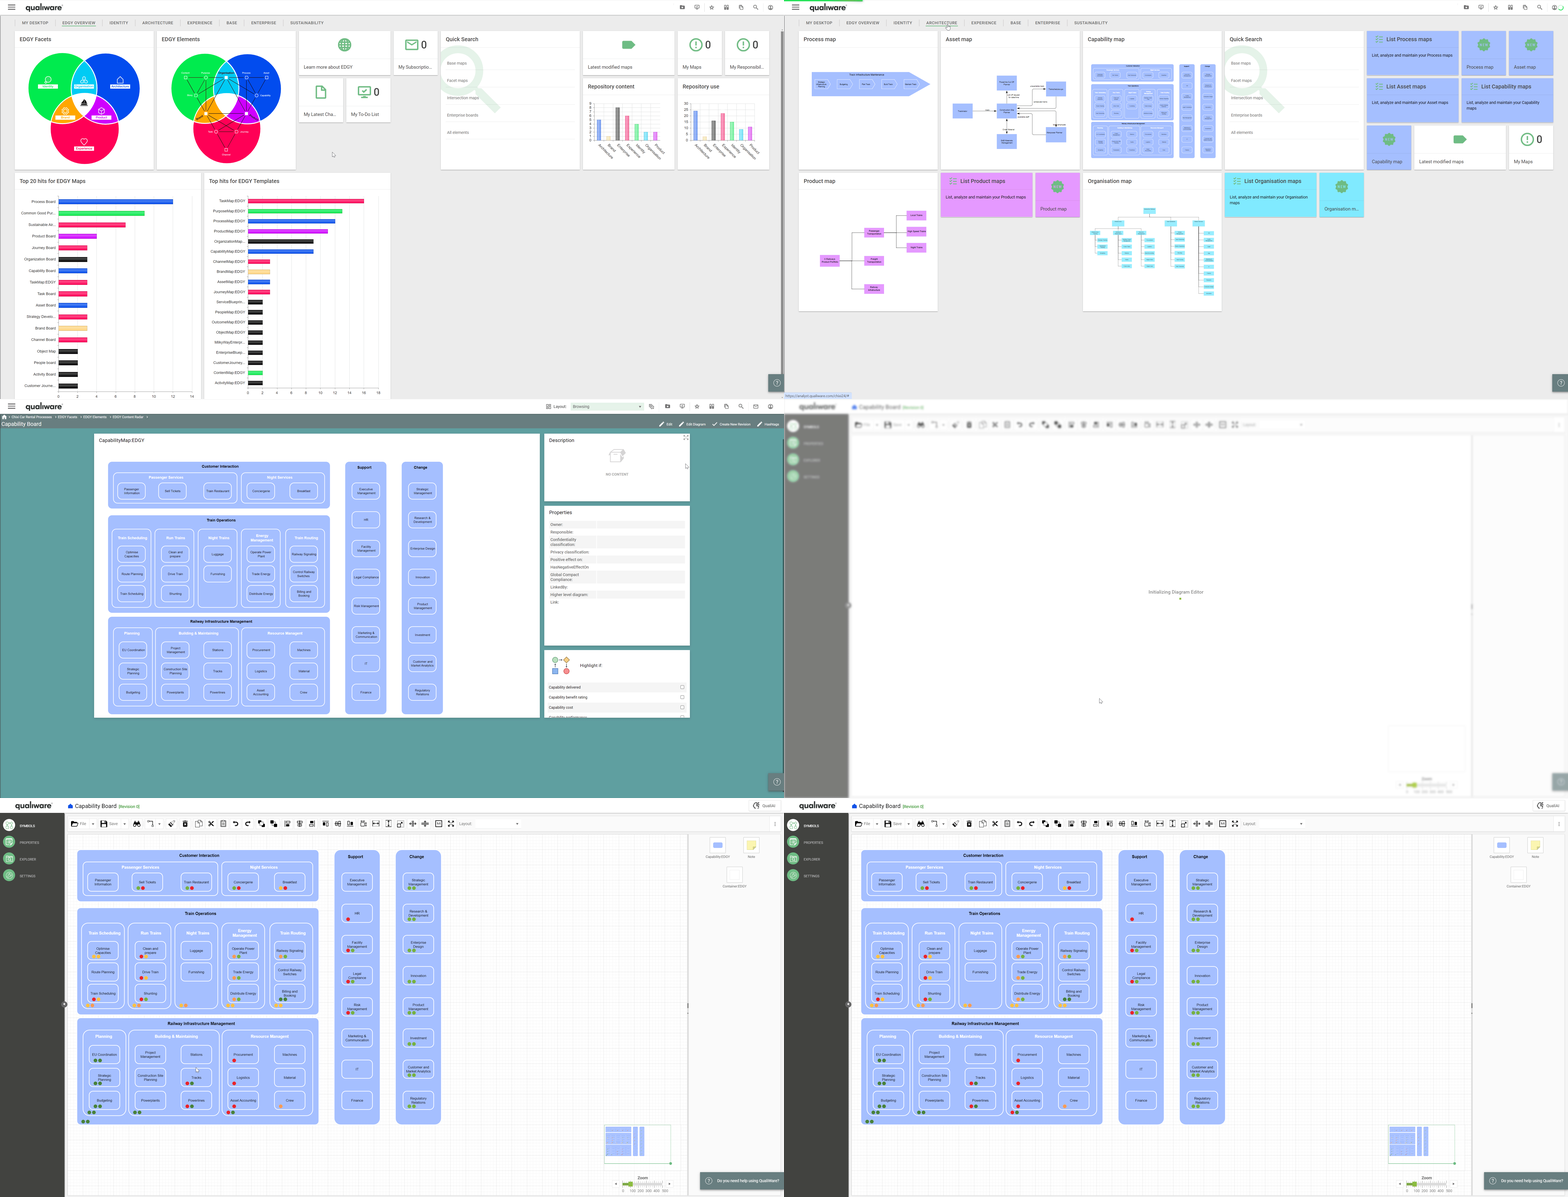
The EDGY overview desktop gives fast access to most recent changes, your maps, and to-do lists, as well as shows the amount and usage of content in the respository.
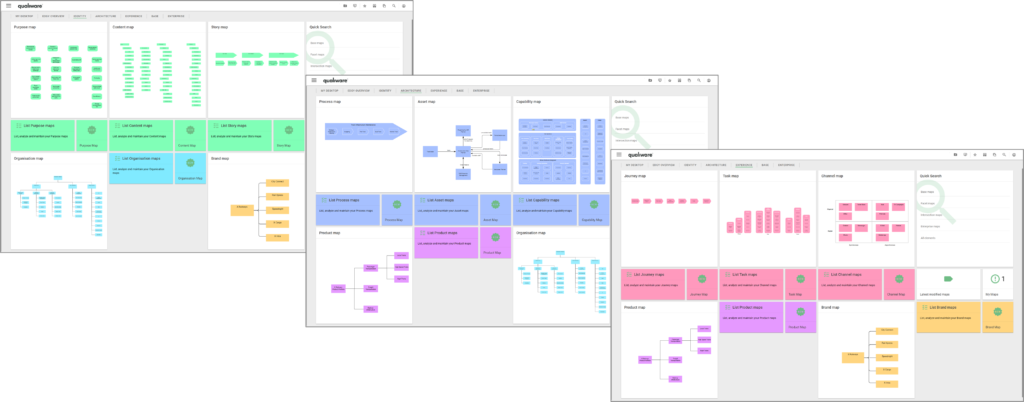
In addition, dedicated desktops have been created for each of the 3 facets, and for the base and enterprise level.
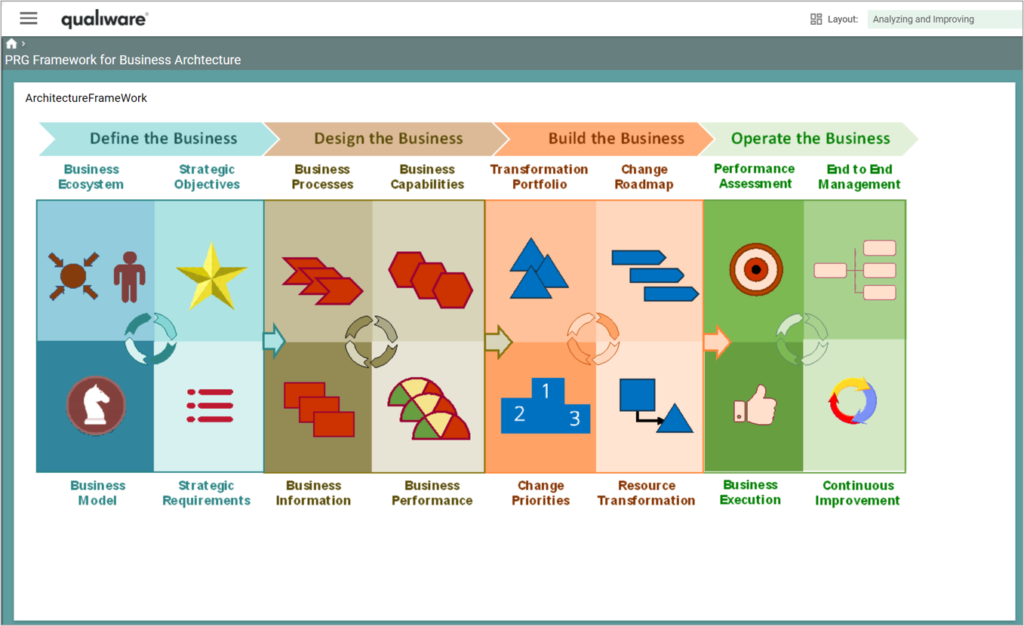
Business Architecture Desktop (PRG Framework)
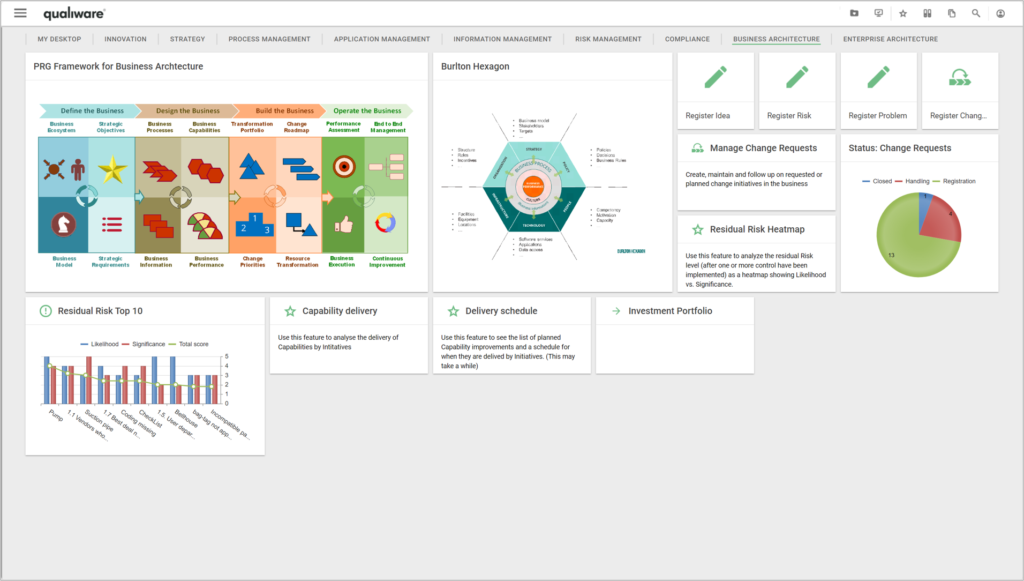
The Business Architecture desktop includes the PRG Framework, and the Burlton Hexagon.
The framework support the phases from defining the business to its operation:
- Define the Business
- Design the Business
- Build the Business
- Operate the Business
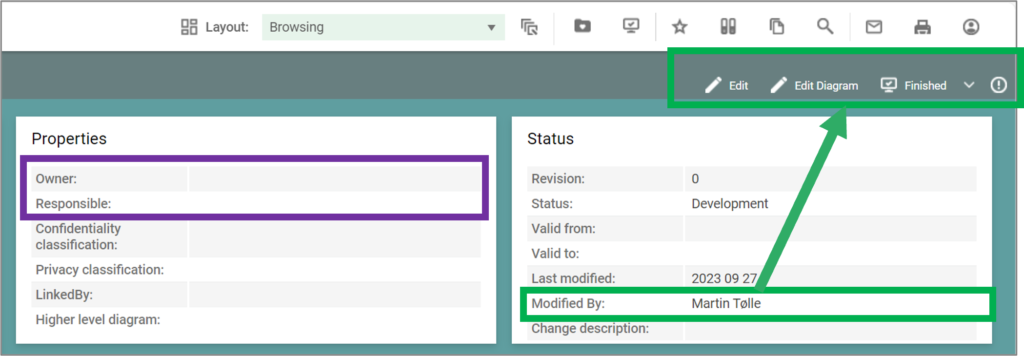
Governance: Allow Object Owner to handle changes
Hence, if no owner or responsible is associated to e.g. a diagram, a user would experience no longer to have governance right (e.g. to “edit diagram”) to a diagram that they have created, once it is saved in the web-modeler. This has been changed now, so the creator of the diagram keeps the governance right to edit the diagram further and to progress is through to “ready for approval”, where the owner/responsible takes over.
Governance: HTMLPublisher define default actions/features for objects not under Governance
Once defined in the HTML Publisher you can select them by ticking the box “Inherit Default Actions” on the HTML Template Definition for the relevant template(s).
HTMLDashboard: Context Dependent Tiles
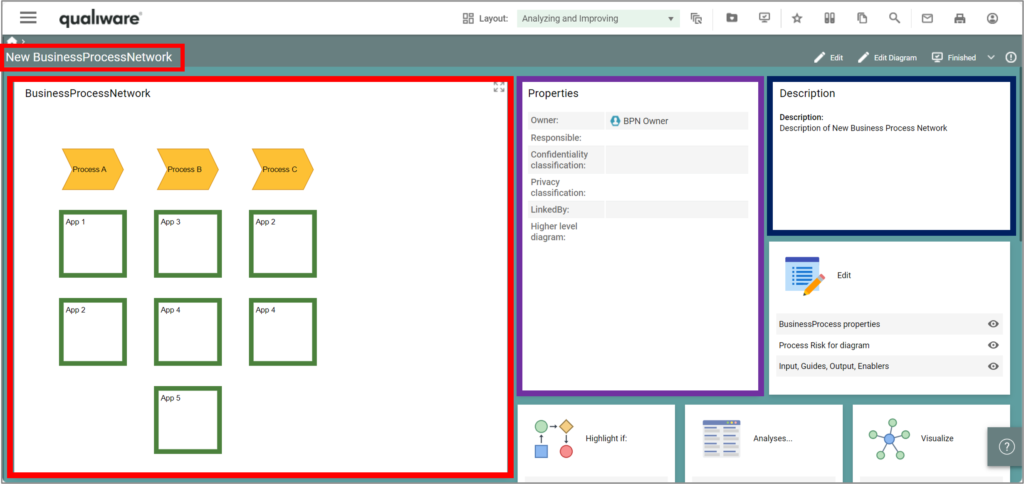
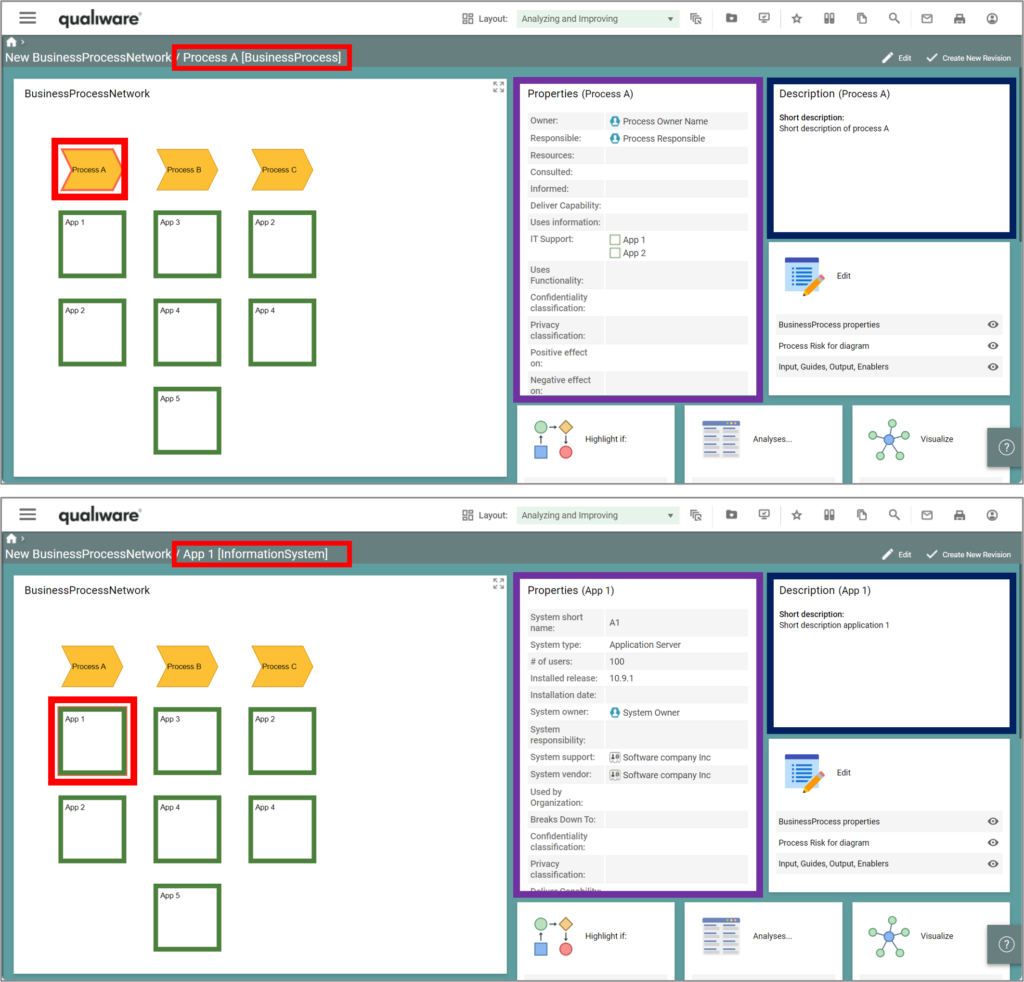
In QualiWare 10.9 we have introduced the possibility to make the tiles context dependent, i.e. you can define different context boxes for different symbols, and the tile will show different (and symbol specific) properties for the selected symbol.
As illustrated below, when you select the business process, the “Properties” tile shows properties specific for a business process, and the properties changes to information system specific properties when the information system is selected on the diagram.
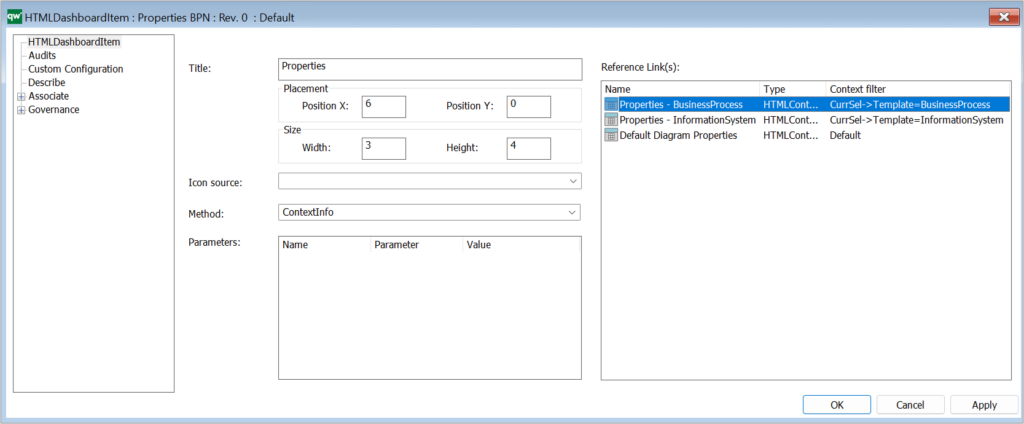
The tile including its context dependency is configured in the HTMLDashboardItem.
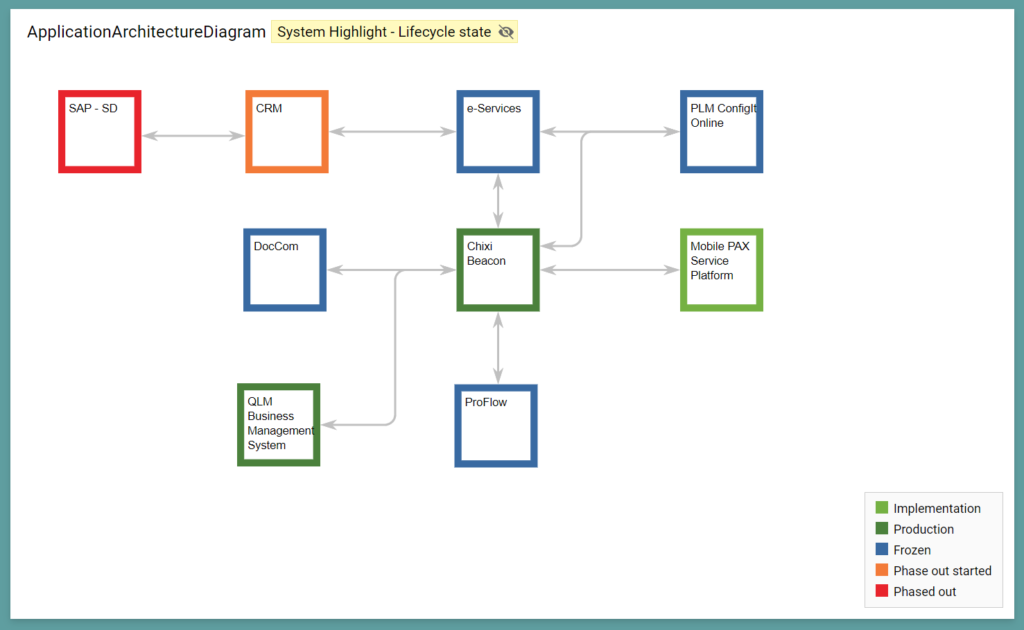
Dashboard: Multiple Highlights (e.g. Application LifeCycle)
In addition, a small legend is included in the diagram window, explaining the meaning of the highlighting collars.
Information model -> Ontology -> OpenAPI
- Generating ontology views from the schemas defined within an OpenAPI file content
- Generating DataModelDiagrams or ClassDiagrams from OntologyDiagrams
- Generating OntologyDiagrams from DataModelDiagrams or ClassDiagrams
This enables “forward and backward engineering” of the models from OpenAPI to Ontology to Information Models.
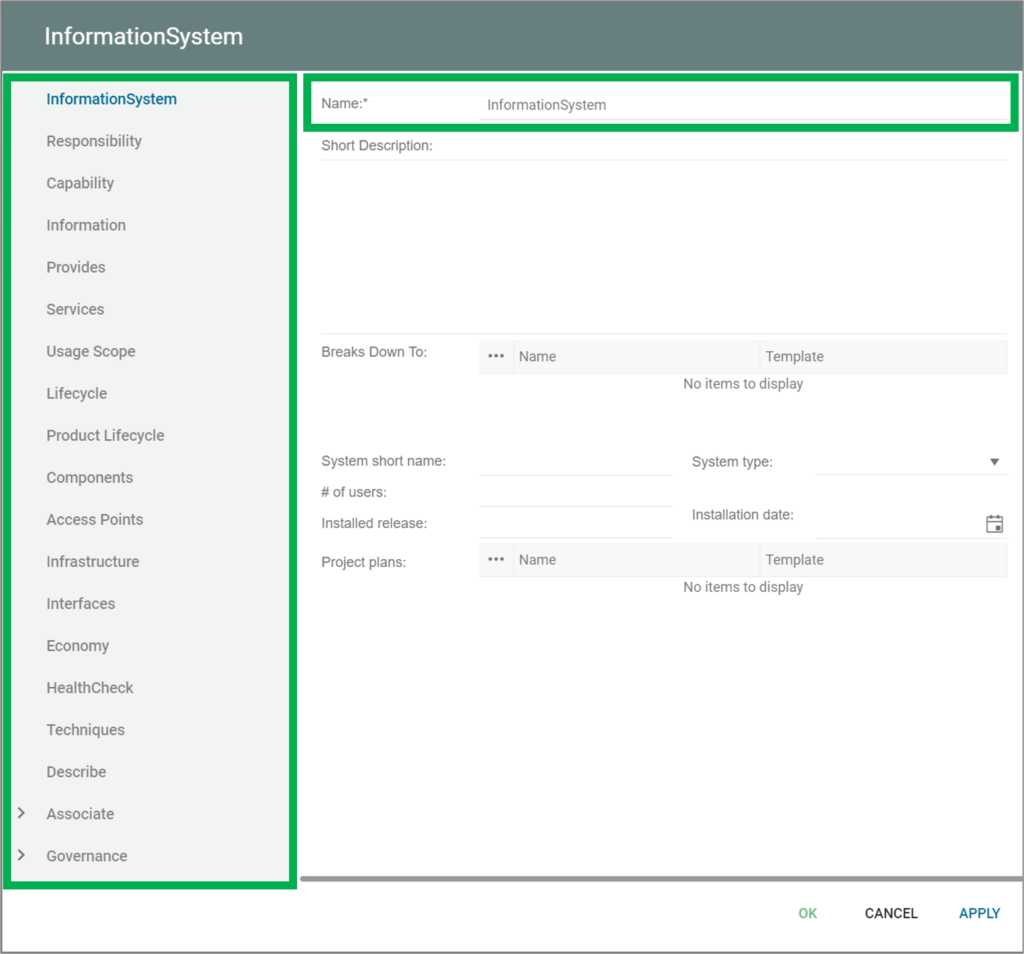
Standard HTML Dialogs
Furthermore, a possiblity to change the name of the object has been included in the standard HTMLDiaglogs.
Object ACL management
If you right-click an object in the repository compare, you can select “Permissions”
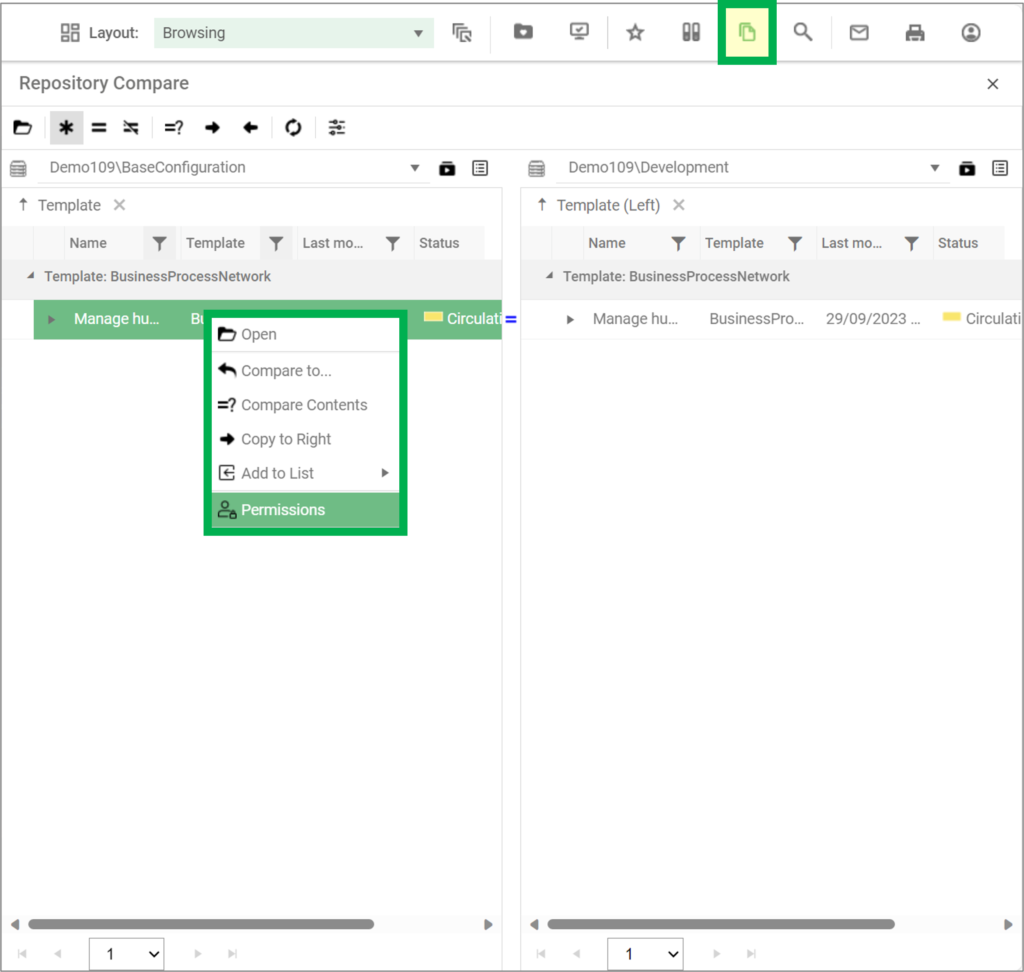
From here you can manage all access to the object.
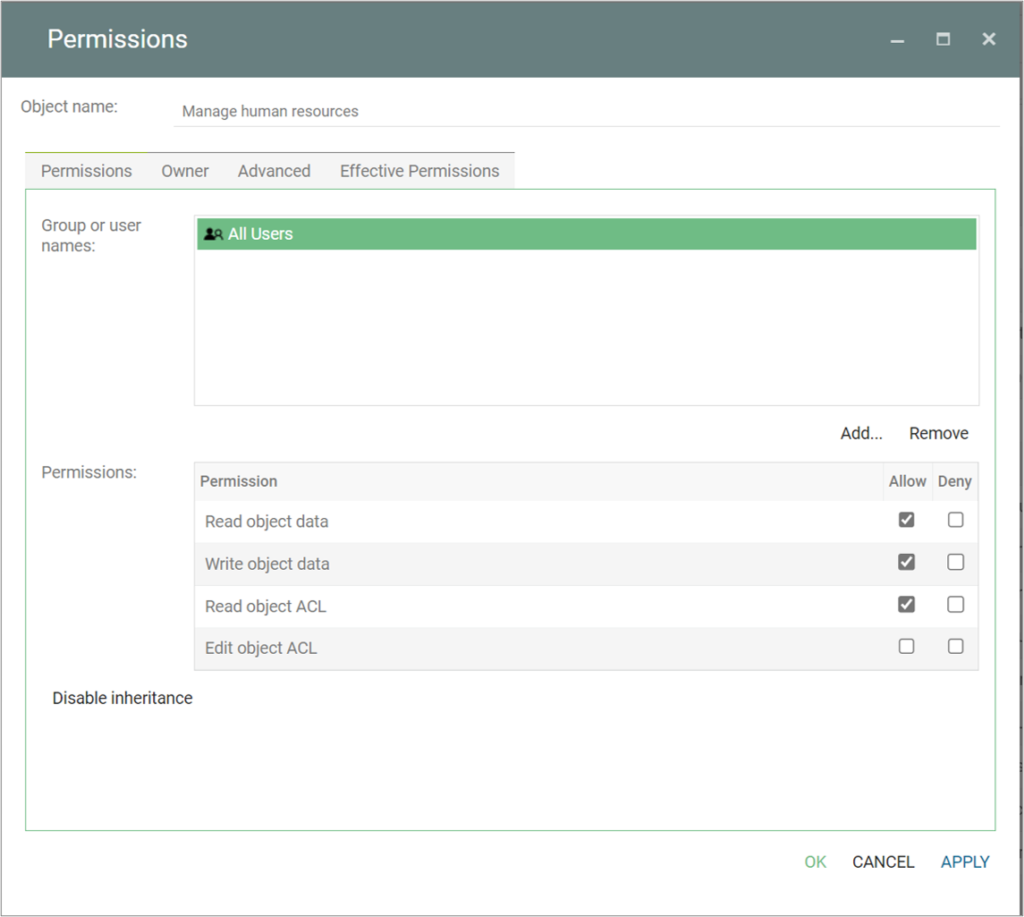
Read more about the repository compare here.
Repository Explorer Properties
In the lower left corner there has been added at windows showing backwards relations to the selected object. This is similar to the window known from the QLM application.
Furthermore, you can now choose between a “Full” and a “Simple” view of the selected object to explore the properties of object in the right frame.
- The simple view is the usual view in the repository explorer
- The Full view is a new view showing all “tabs” of the objects where there data/relations filled in.

Another addition to the repository explorer is the possibility to change the scope of the view. This is also a wellknown feature from the QLM application.
The user can choose between the default view and see all revisions, all language variants or all revisions and language variants.
As in QLM the default object in the repository is the revision where the is a (*) besides the revision number of the object.
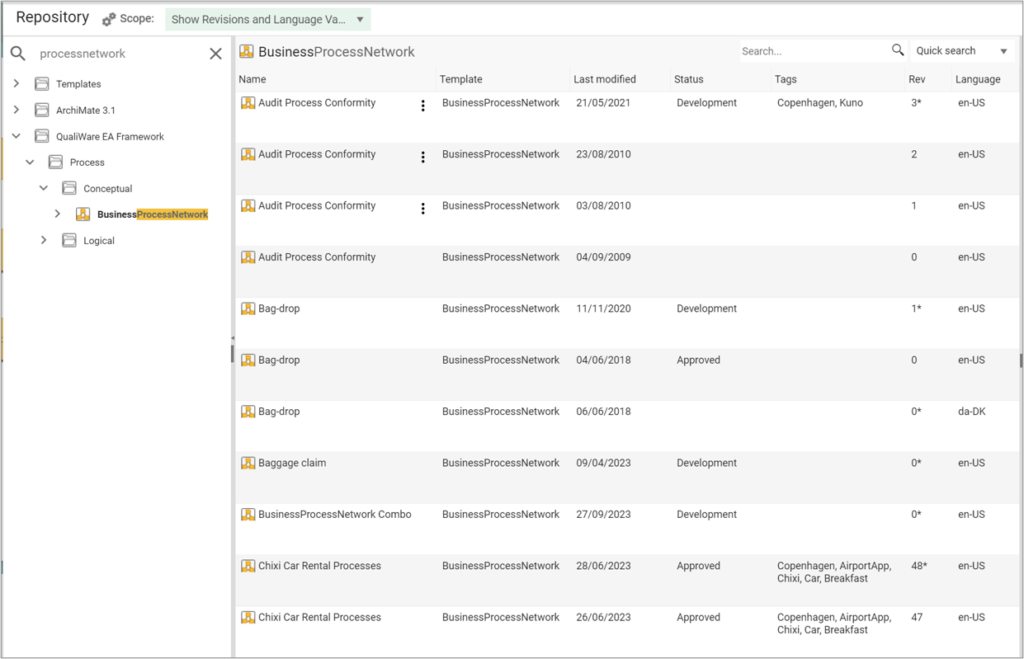
Read more about the repository explorer here.
Safe/Load dumps from RA
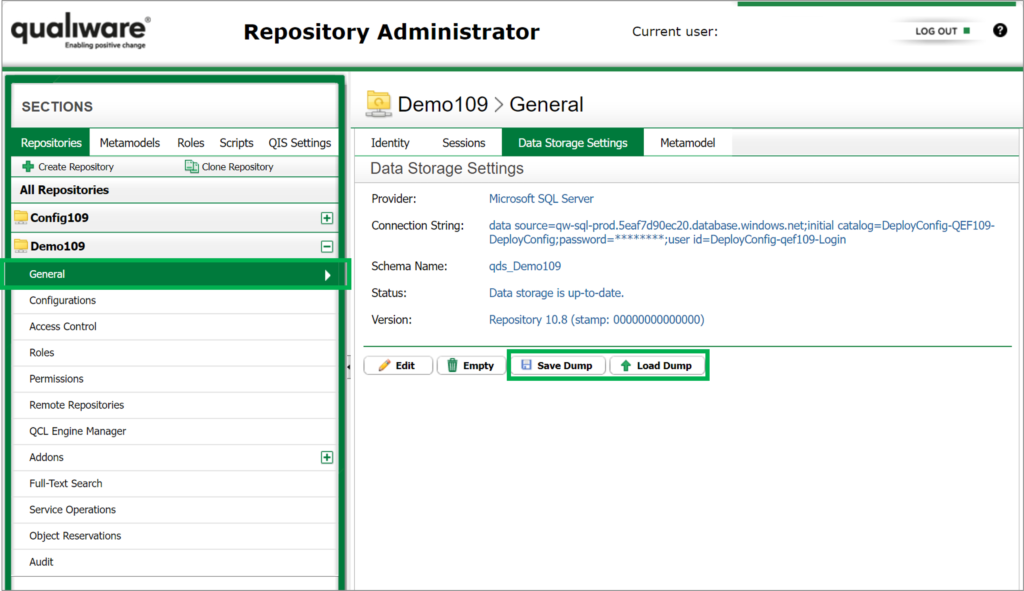
Visualizer features
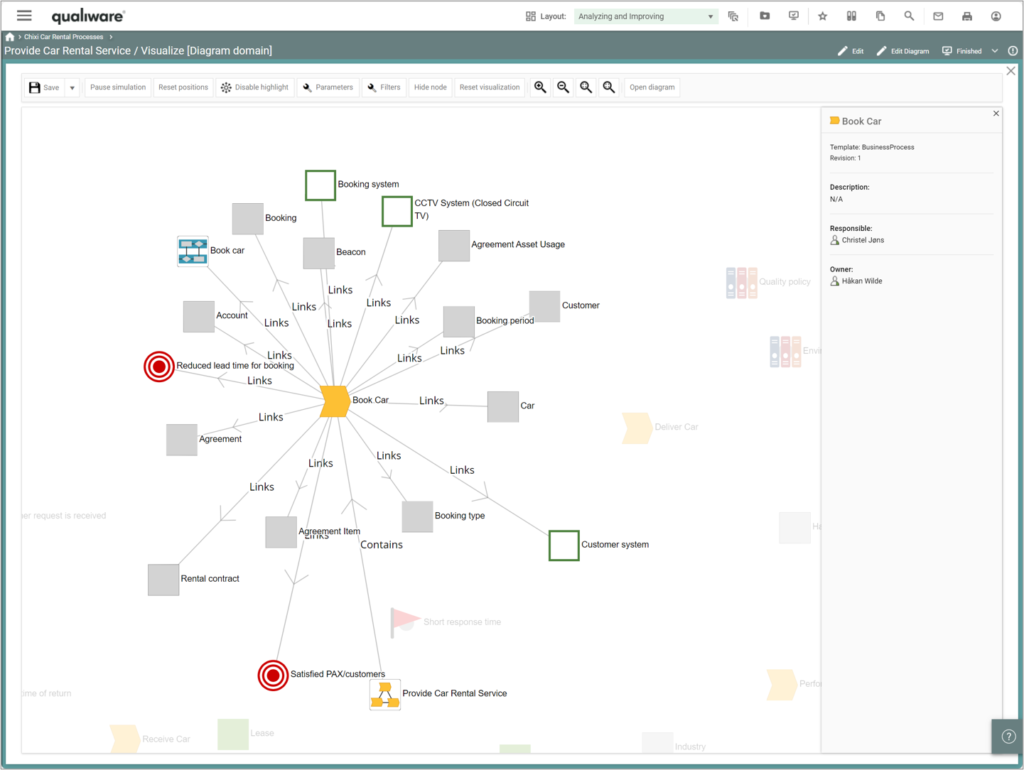
It is now possible to filter the templates on the visualizer, and a quick search has been added to find relevant symbols in the view.
QuickSearch: Search in specified attribute
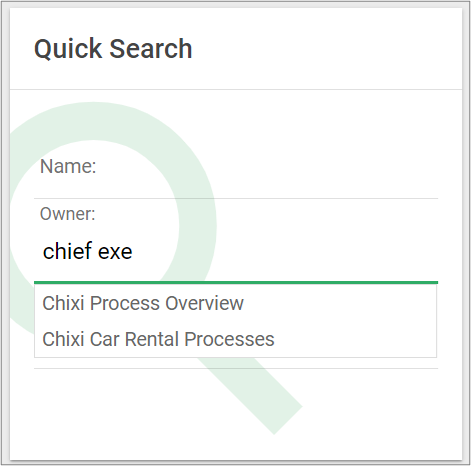
The new search method find objects based upon a search in a specific attribute, e.g. list all BusinessProcessNetwork, WorkFlowDiagram, and BusinessProcessDiagram that are owned by the “search text”.
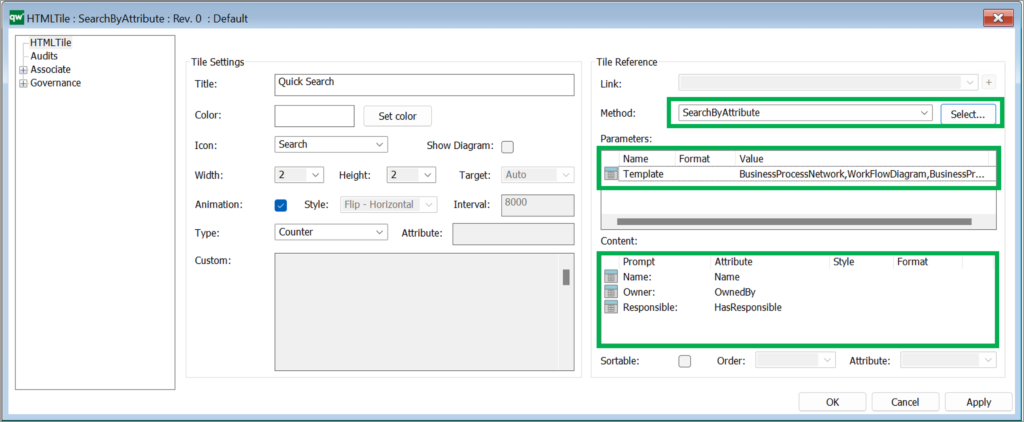
The search Attributes can be customized to add any attributes. The Search can be configured in the HTMLTile using the new method “SearchByAttribute”.
Once the SearchByAttribute has been selected a method, Default parameters and content are added allowing user to search on the Name, Owner, Responsible of a BusinessProcessNetwork, WorkFlowDiagram, and BusinessProcessDiagram.
Translation: Local Language (LL) on dialog text
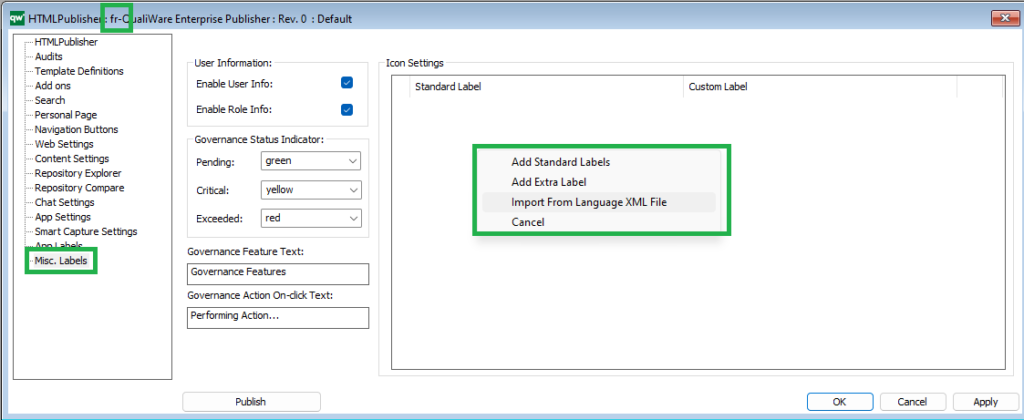
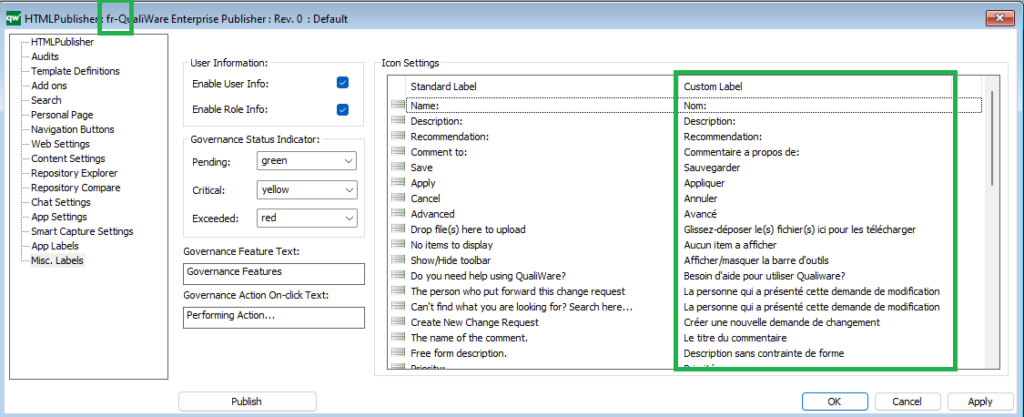
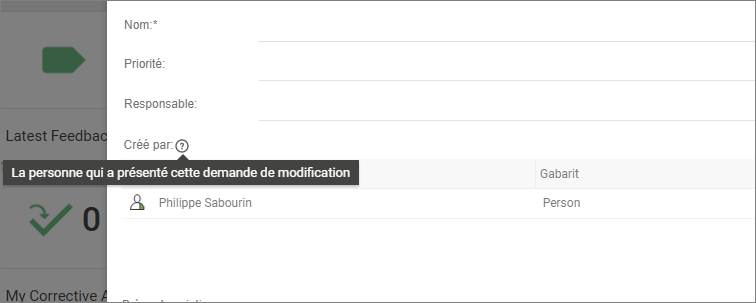
Labels can be loaded from an existing translation file or form a copy of the publisher misc. Label field. Once labels are imported and the publisher has published, Dialog layout will be available the language of the HTML publisher variant.
Generic REST API (QCL, QTS, JS)
AI-generation of diagram and content
- AI-Powered Diagram Creation: With QualiAI, harness the power of artificial intelligence to automatically generate diagrams from various types of context, making the diagram creation process more efficient and user-friendly.
- Intelligent Context Analysis: QualiAI analyzes the given context to create initial diagram drafts, providing a valuable starting point and streamlining the diagramming process for creators.
- KnowledgeScope Templates: Utilize our innovative KnowledgeScope template to guide the AI, ensuring the diagrams generated meet your specific needs and context requirements.
Read more about QualiAI here

Video Highlights QualiWare 10.9
Repository Explorer
From the repository explorer you can explore and search content in the repository. The repository explorer enables the user to search for a specific object type, list details, and see selection in the preview window.
In addition to finding the relevant object fast, the repository explorer also provides easy access to edit funtions, and a whole set off options from the content menu including visualizations, and relations to the object.
Video Highlight
Using the Repository Explorer Feature
When on the web front-end click on the Repository Explorer button in the upper right corner in the toolbar.

Once clicked the Repository Explorer will open and enable you to search for and explore folders and object in the windows, and via the content menu.
The Repository Explorer contains of 3 parts:
- a folder view in the left
- a list view in the middle
- a preview view in the right view, including easy access to available governance actions.
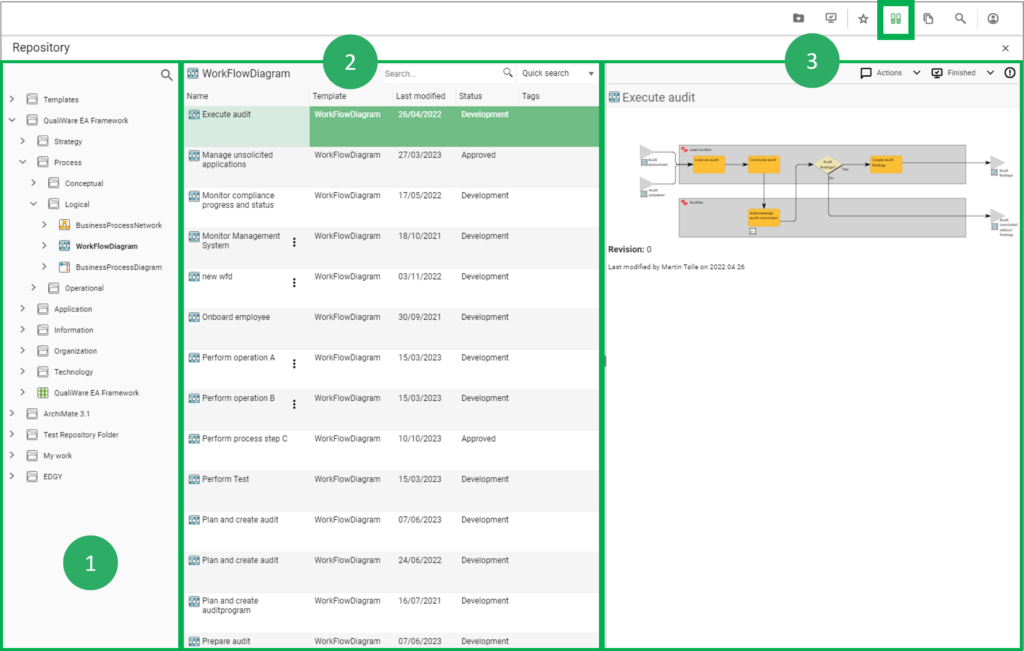
The folder view in the left window consists of a set of folders. Each of the folders can be unfolded in a treeview, clicking the “>” to the left of the folder/object.
As default a template folder is included in the top of the folder list (the content of the folder is managed via the HTML Publisher).
Additional folders can be added via the publisher, or by using the 3 dot sushi menu.
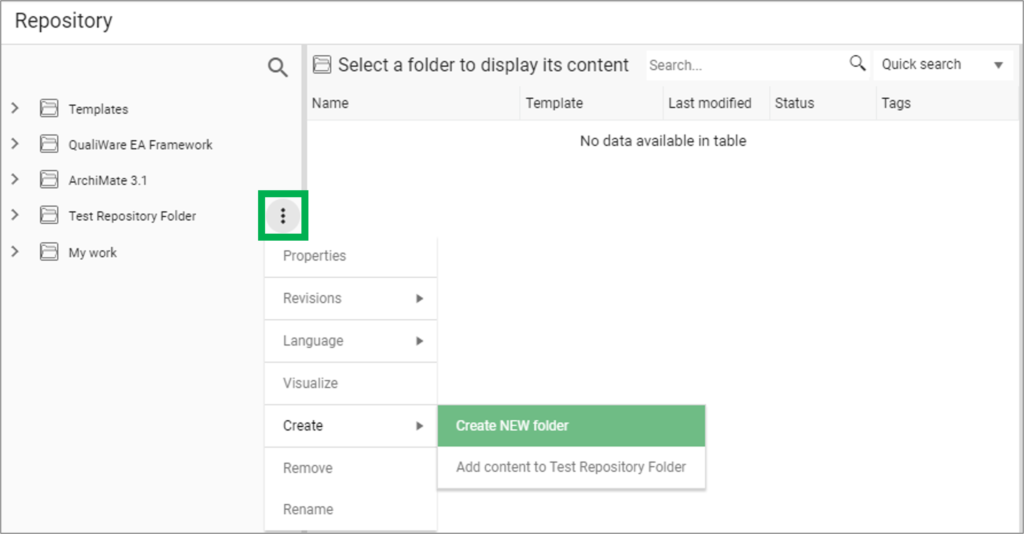
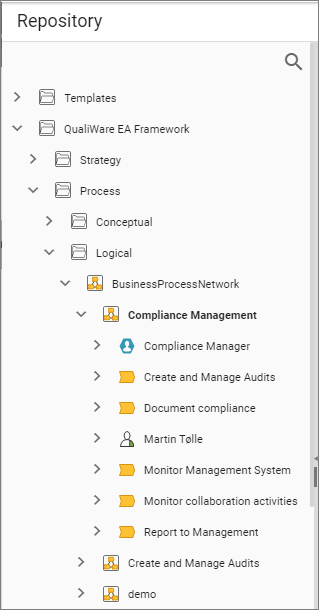
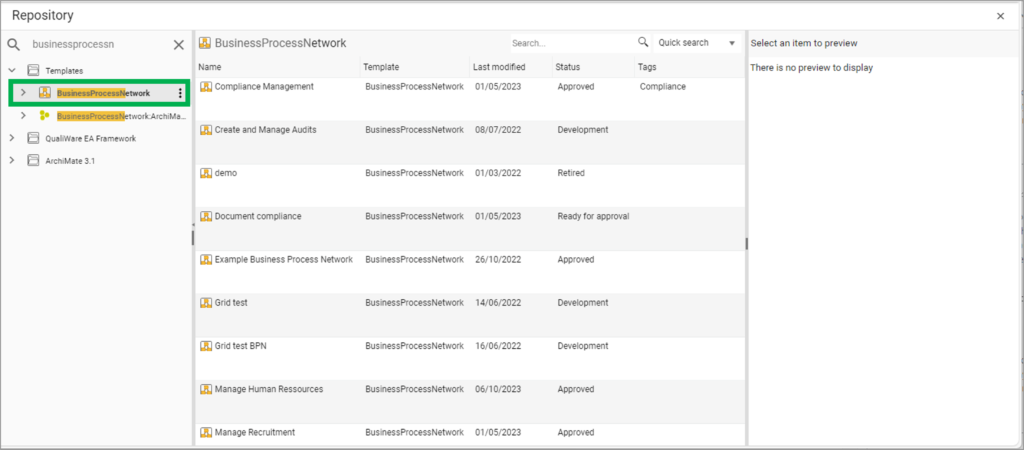
Once a folder/object is selected in the left window, a list of objects is listed in the center window.
- if a template type is selected all the object of the selected type is listed in the middle window.
- if a specific object is selected all related objects is listed in the middle window, and the object is shown in the right preview window together with its description
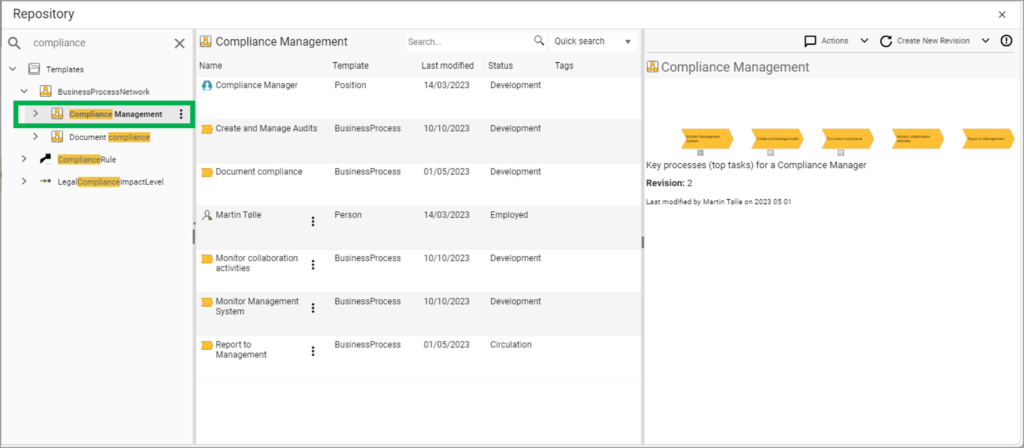
Search
It is possible to search for content in both the left and middle window.

In the list window, you can select two different searches:
- Quick Search: Searches within the object in the list window
- Global Search: Searches withen the whole repository

Content menu
You can find the content menu to the right of an object, in the form of 3 dots sushi menu.
- When you click on the content menu to a template, you can create a new template of the selected template type, or create a new repository folder.

When you click on the content menu to an object, you get a more comprehensive menu, which offers all necessary features to maintain and analyse the content of the repository. The menu will also offer the relevant governance actions for the selected object, which enables a faster governance process, as it is not required to open the object to move it forward in the lifecycle.
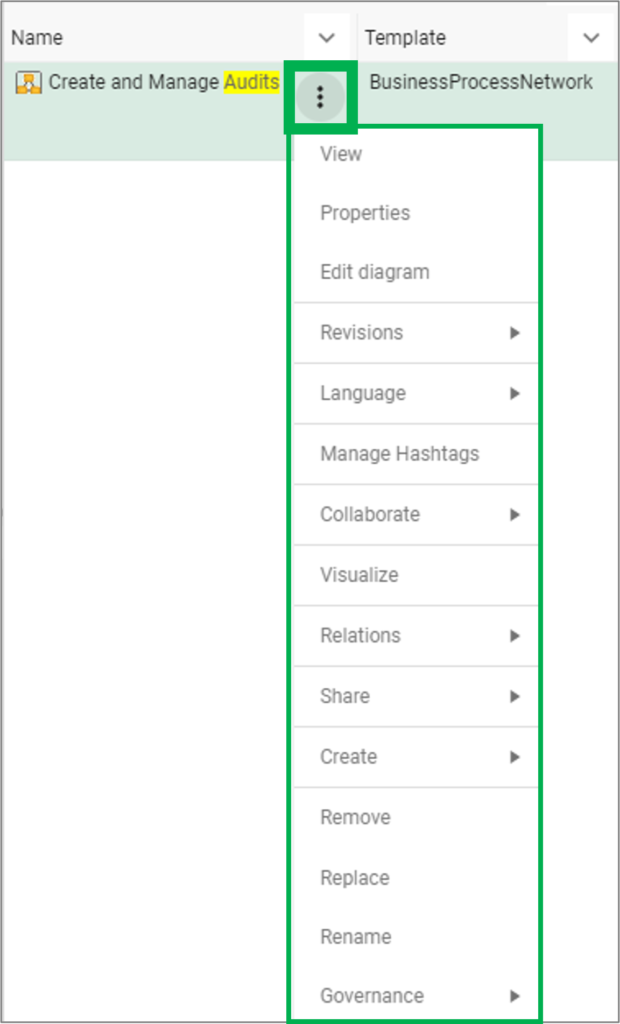
- View: views the object on the web (shows the corresponding dashboard or IFrame for the selected object)
- Properties: open the web-dialog for the object, to edit the properties
- Edit diagram: open diagram in the web-modeler
- Revision:
- Create new revision
- Compare configuration revisions: Open the object in the repository compare
- Governance History: Shows governance history of the object
- Language: Create a language variant of the object (in the selected language)
- Manage Hashtags: Manage hashtags associated with the object
- Collaborate:
- Create a Change Request to the object
- Create a Non-Conformance to the object
- Create a comment to the object
- Rate the object
- Subscribe to the object
- Visualize: Open the object in the visualizer
- Relations: See all types of relations to the object:
- Links to / Linked by / Contained in / Sends / Sends to / Receives / Receives from / Frames / Framed by)
- Share: Send object to a folder, E-mail or Print
- Create: new object or folder
- Remove / Replace / Rename the object
- Governance: select among available governance actions for the object
Social Behavior Warehouse
Summary
QualiWares Social Behavior Warehouse combines social analytics with Enterprise Architecture and Business Process Management. Social Behavior Warehouse captures the behavior of the organization by registering all activities performed on knowledge stored in the enterprise repository.
With Social Behavior Warehouse an organization can assess business outcomes and provide diagnostic information. Using this technology, businesses can make sure that their organization is using the EA to create a competitive advantage. Social Behavior Warehouse is an essential tool in management’s decision-making process.
Enabling positive change requires a strong focus on Collaboration in decision making and a high degree of de-centralized maintenance and sharing of corporate knowledge. Successful implementation of corporate strategy and the required business transformations is essential for businesses operating in a global dynamic market; the ability to react rapidly to such market dynamics may mean life or death to the business. With Social Behavior Warehouse top management can uncover threats to business agility and identify actions needed to correct the weak spots in the organization.
The Social Behavior Warehouse will provide management with answers to questions such as:
- What parts of the Management System / EA knowledge are used by the organization?
- Are EA deliverables made operational, actionable, and measurable?
- How active are different parts of the organization?
- How often do employees use core process models to guide them in day-to-day operations?
- What is our organization’s agility?
- How much time is needed from approval of the business model until it has penetrated the business?
- And many more.
Social Behavior Warehouse integrates with the Governance Workflow Engine and other QualiWare modules where content is viewed or changed. It scales to form a complete intelligent collaboration platform for large enterprises operating in a global environment.
Standard SBW Radar Tiles
On the QualiWare standard there are 4 tiles on the My Desktop available, addressing repository content and SBW data about how it is used on a company, team and personal level.

The axes on the radar diagrams (Strategy, Process, Application, Information, Organization and Technology) represents the dimension in the QualiWare EA Framework, and the associated object templates (typical diagrams).
QualiWare EA Framework
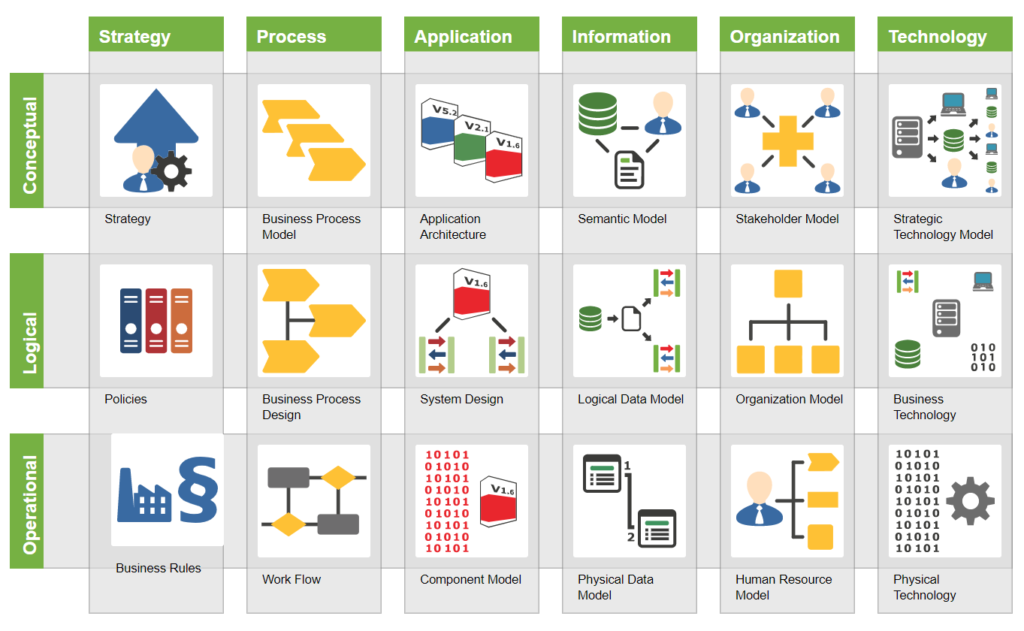
Each of the FrameWorkCells in the EA Framework is related to a set of model(s) and other templates, and the radar diagram reflects:
- Repository Content
- This diagram counts the number of objects of each template in the whole repository mapped to each of the columns in the QualiWare EA Framework
- Company use of content Radar
- This diagram counts the number of clicks all users have on each of the objects of the mapped template types in each Column in the EA Framework.
- My teams use of content
- This radar diagram counts the number of hits for the user and the users in the same organisational unit in QualiWare.
- My use of content
- The last radar diagram counts the current user’s clicks in the repository
Top 20 list over most viewed objects and templates
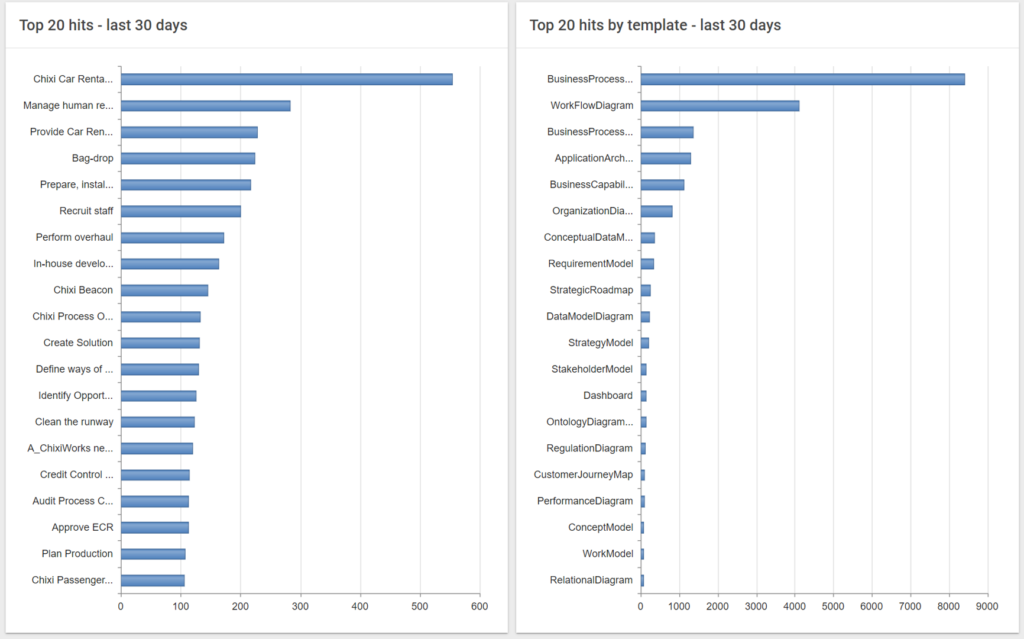
In addition to the Radar diagrams, there are 2 tiles on the standard My Desktop, showing the most viewed objects and template types in the repository the last 30 days.
Social Behavior data on diagrams and models
In addition to the more generic radar-diagrams addressing the whole repository, you can also access analytics data related to a specific diagram.
When viewing a diagram on the web in the classic diagram workspace, an analytics action button becomes available in the top right in the action buttons.
When viewing a diagram in a Dashboard view the analytics data are available from the dedicated tiles on the dashboard.
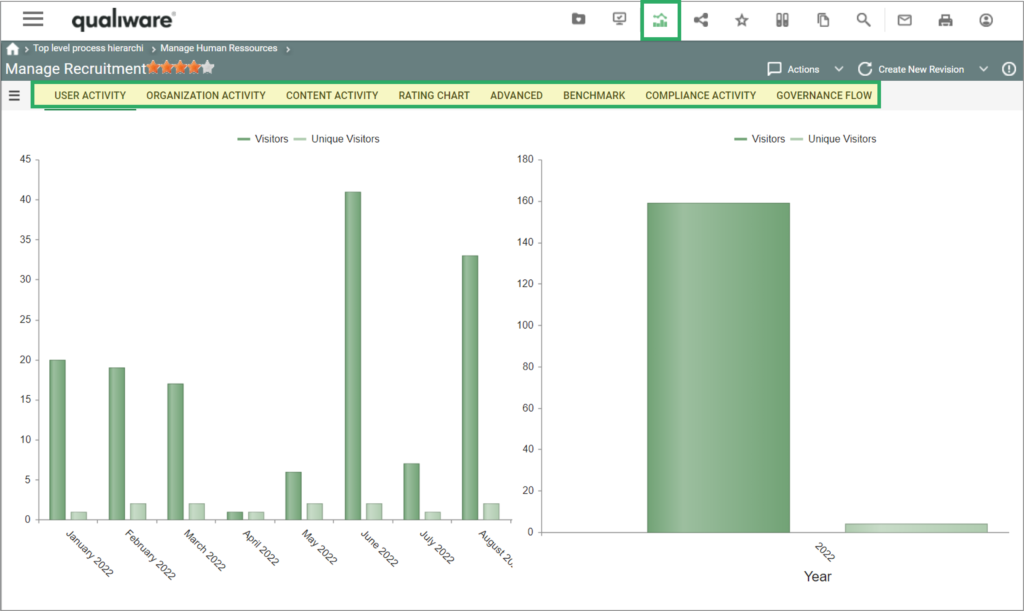
Once the analytics is selected a set of tabs becomes available.
Depending on the diagram type a set of analytics tabs becomes available. In the following each of the tabs are described shortly.
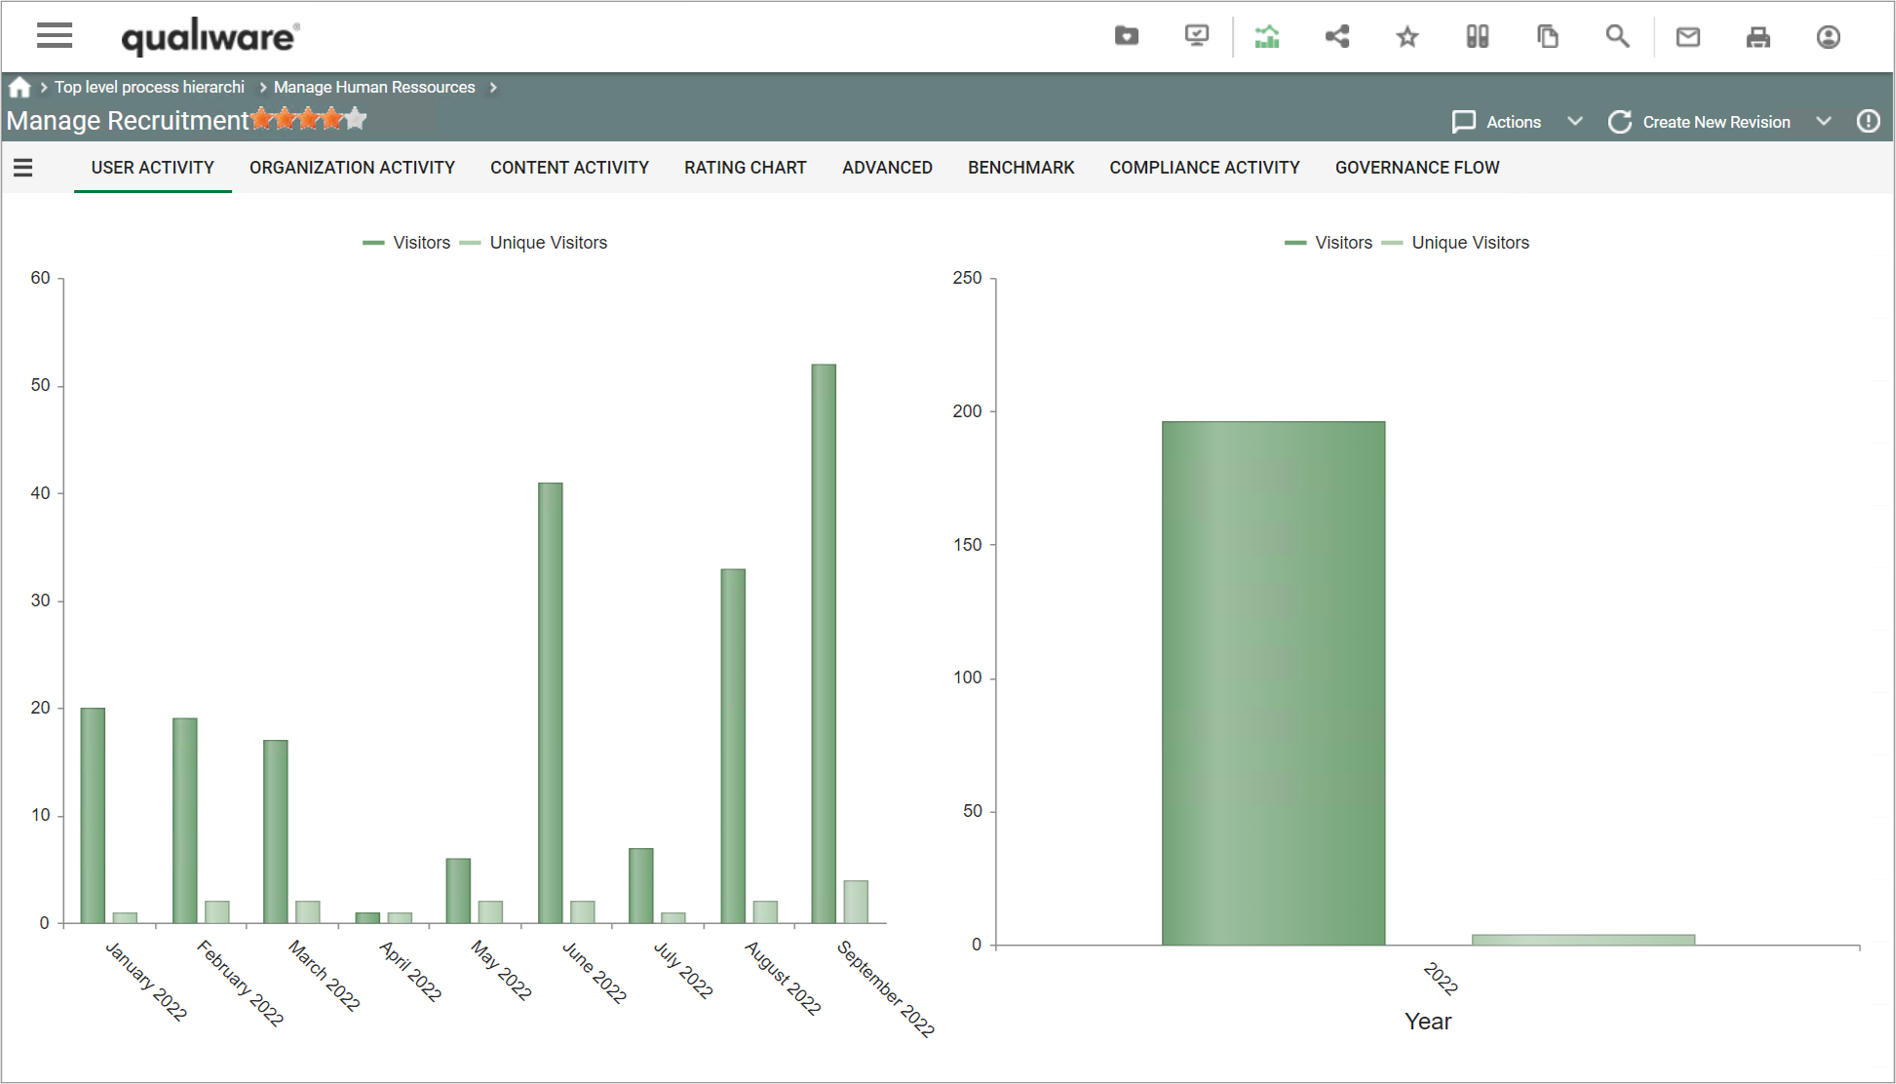
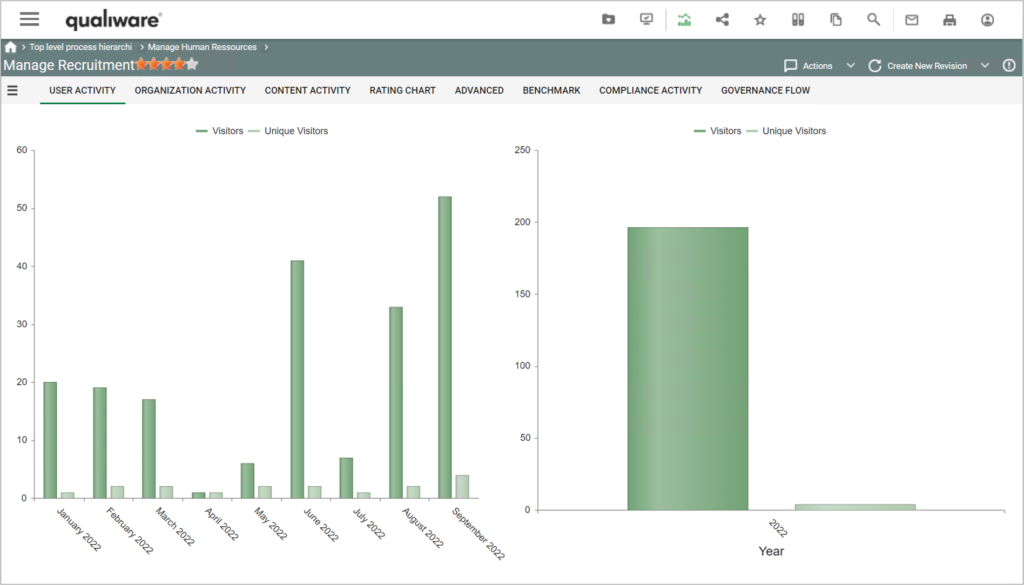
User Activity
This tab shows number and page visits (visitors) and unique visitors pr month and pr year.
Organization Activity
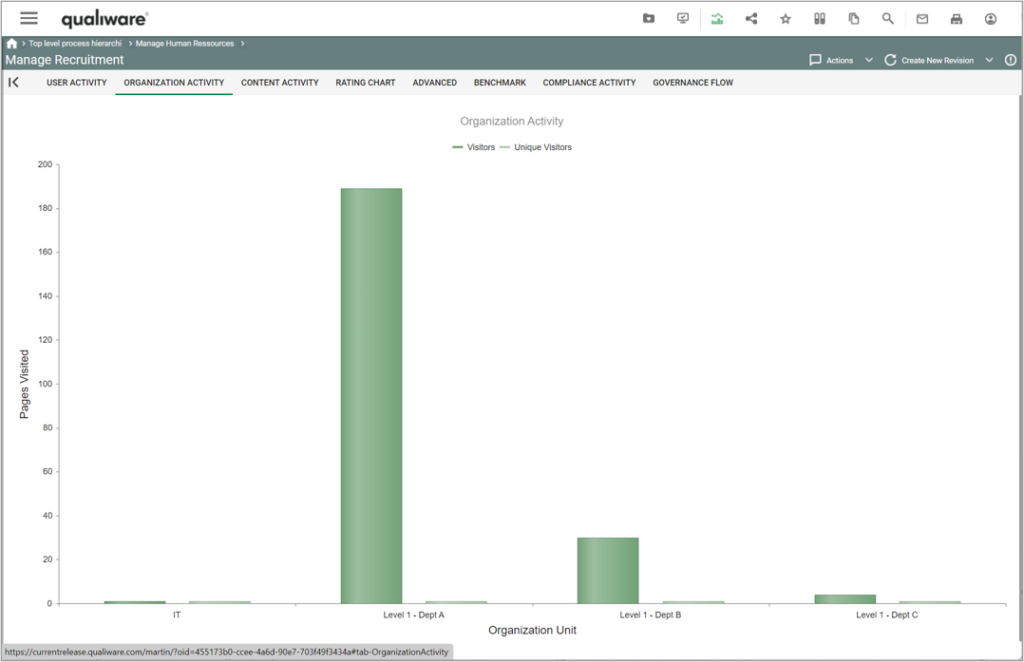
This tab shows number and page visits (visitors) and unique visitors pr month for each organization unit.
This activity view is based upon the users (persons) asscociation the organization units in the repository.
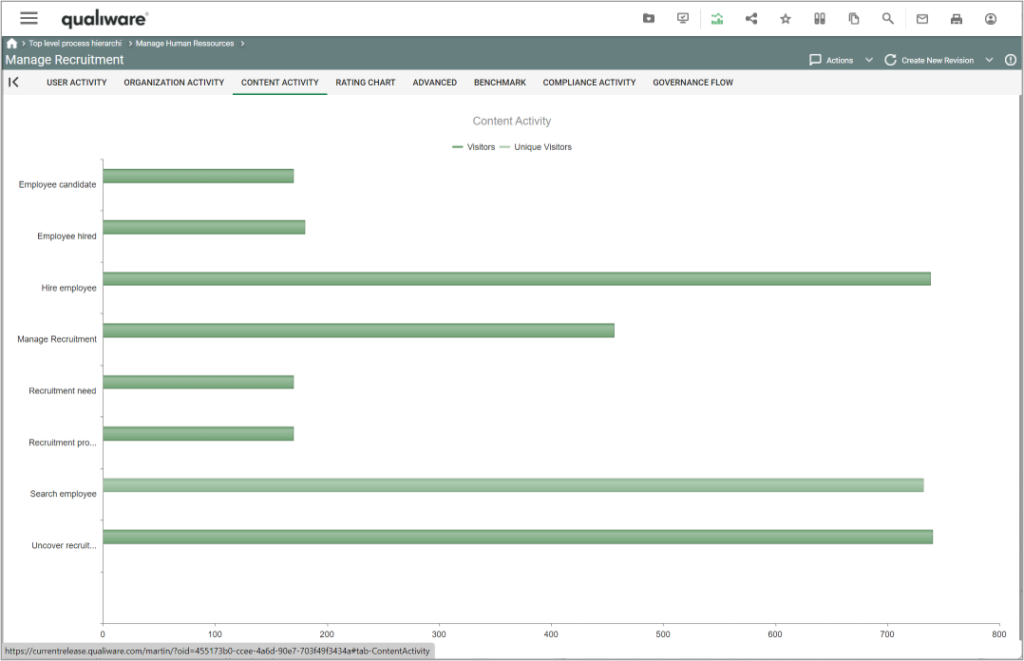
Content Activity
This tab shows the total number off hits (clicks) for each object on the diagram.
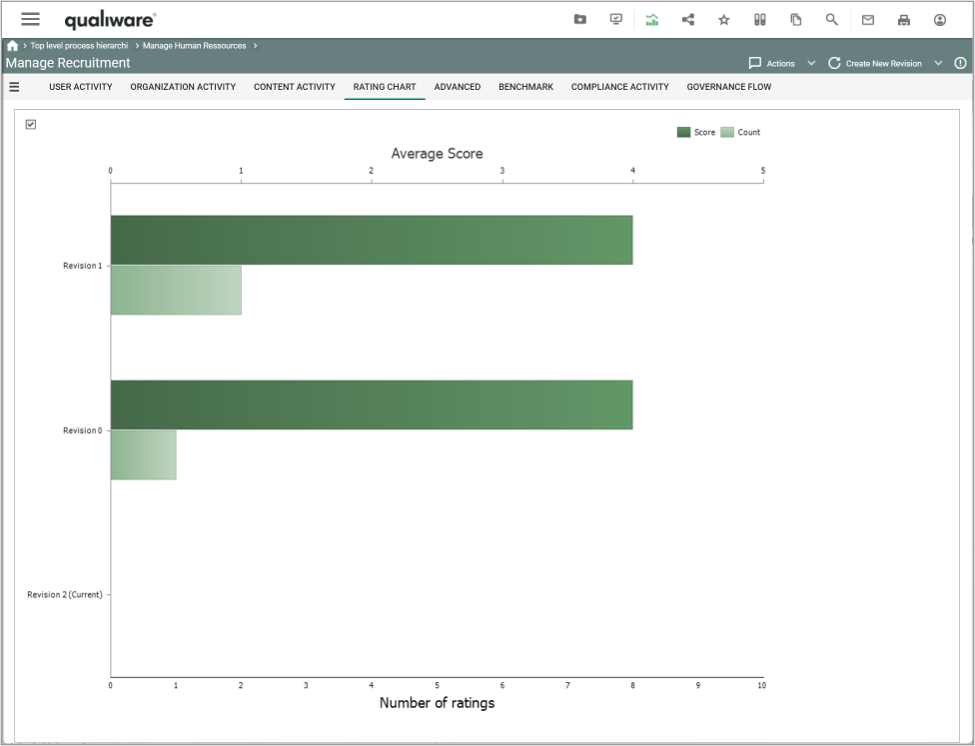
Rating Chart
This tab shows the number of ratings and the average rating for each revision of the diagram.
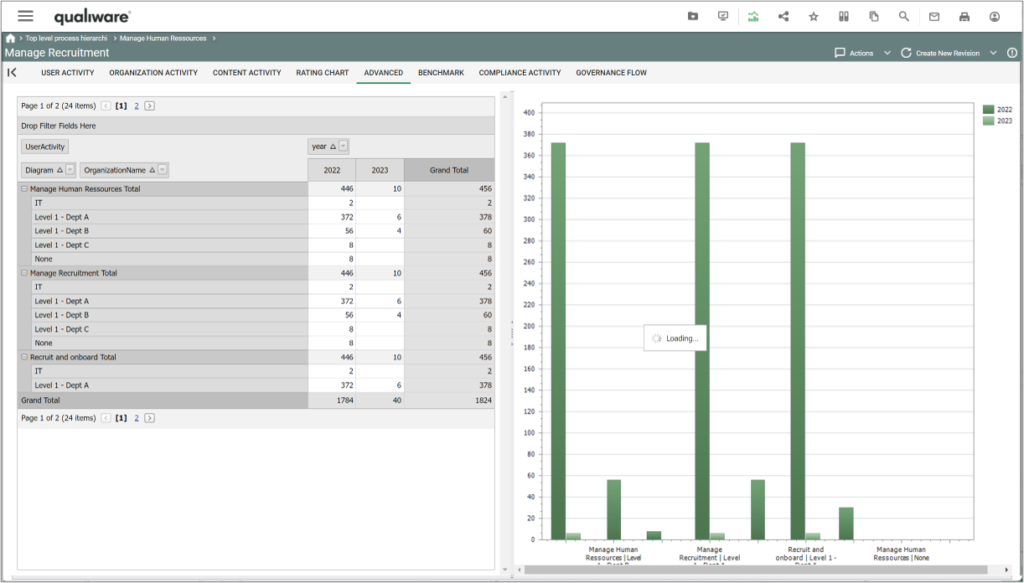
Advanced
This tab show a (subset) of the diagrams in the repository and the organization activity for the selected diagrams. In the left frame you can select the content using the pivot like format.
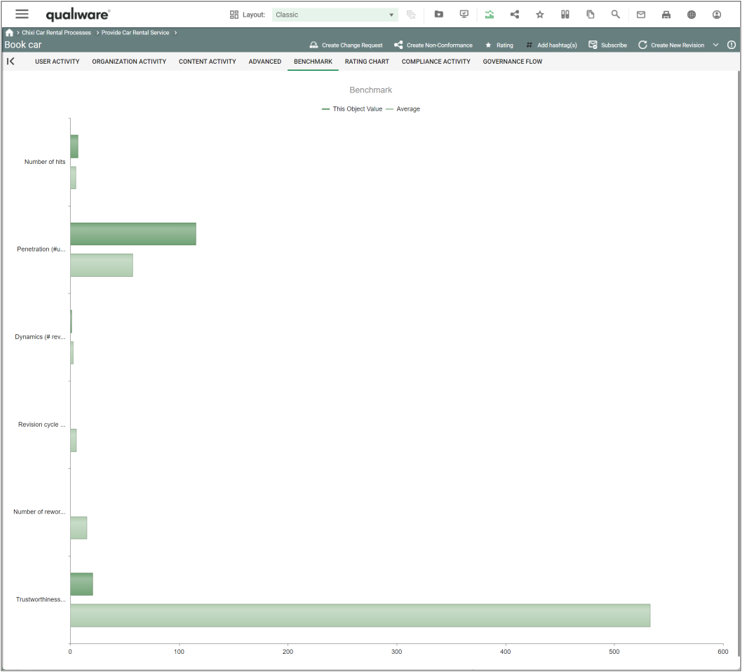
Benchmark
This tab benchmark the object properties with the average values of the other objects in the repository.
Compliance Activity
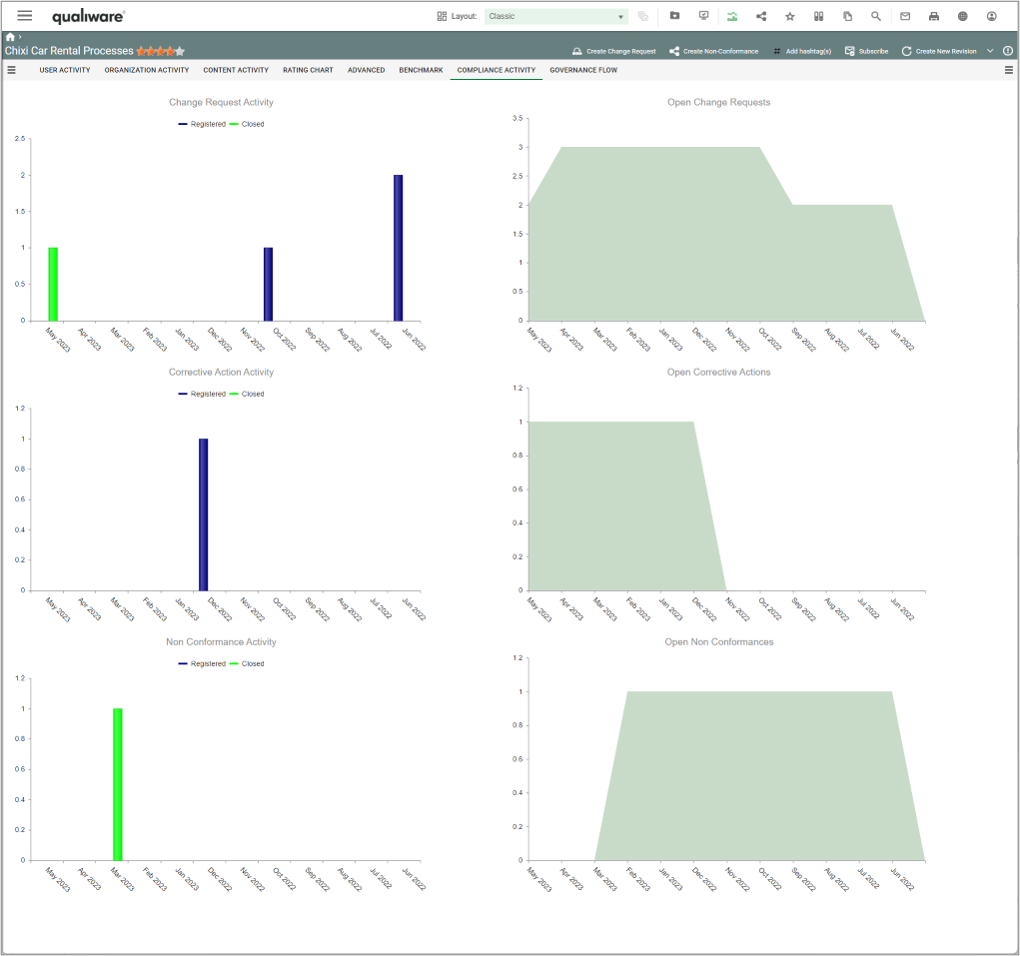
This tab shows diagrams for the compliance activity related to the diagram. The 3 charts to the left show the number of new registrations and closure of change requests, corrective actions and non conformances related to the diagram. The 3 charts to the right depict the number of open items for the 3 types.
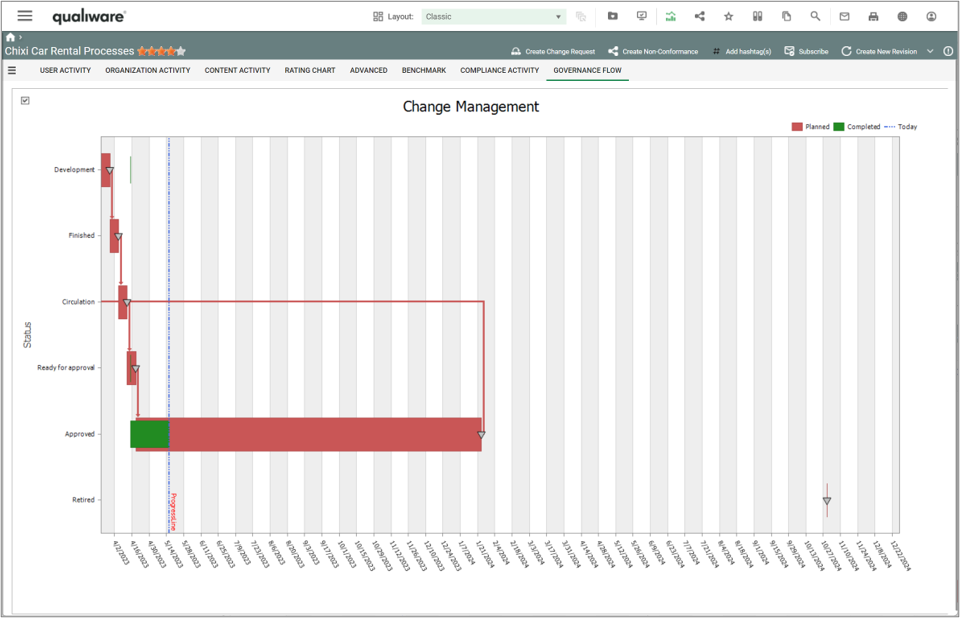
Governance Flow
This tab shows a Gantt chart and dates for the governance states for the diagram.
For Administrators
SBW Configuration
Below is the main administrator steps for setting up SBW shown.
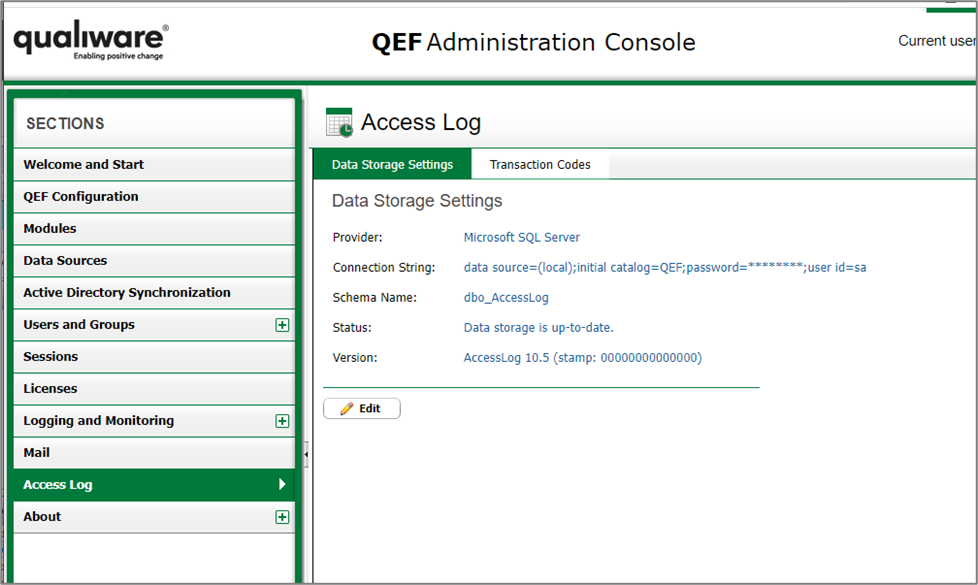
The Social Behavior Warehouse (SBW) has to be set up in the QEF Admin console for it to work.
In QEF Console, there is a tab called Access Log, which allows for the creation and maintenance of the Access Log database.
This database contains the raw data for system access across all repositories. This data is eventually processed by SBW, on a per-repository basis.
As this single database is used by all repositories, it is important that it is stand-alone, and that the access logs are not a schema within another existing database.
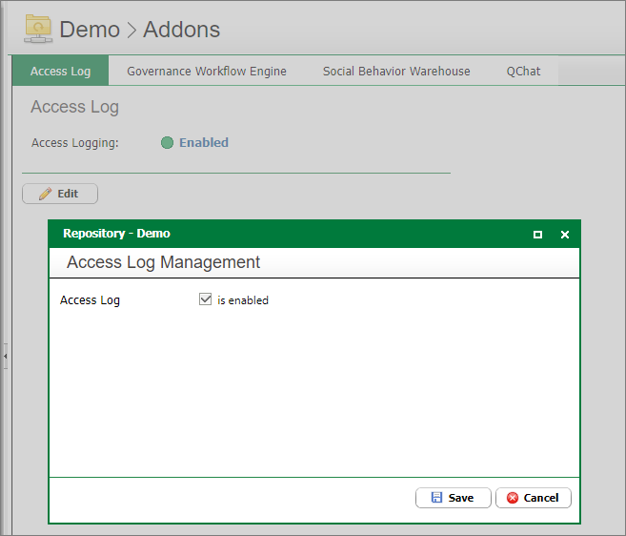
For each repository that requires SBW, you must enter Repository Administrator and navigate to the Addons tab.
The first tab within Addons is “Access Log”, click on Edit and check the “is enabled” checkbox.
This will tell QEF to start logging access data for this repository.
The next step is to navigate to the “Social Behavior Warehouse” tab and clicking on Edit.
From there, you can create the SBW Data Storage.
NOTE: The “SBW Cube Data Storage” tab and “Cube Sync” tab are deprecated. These tabs do not need to be set up and can safely be ignored for QualiWare 10.5 or newer.
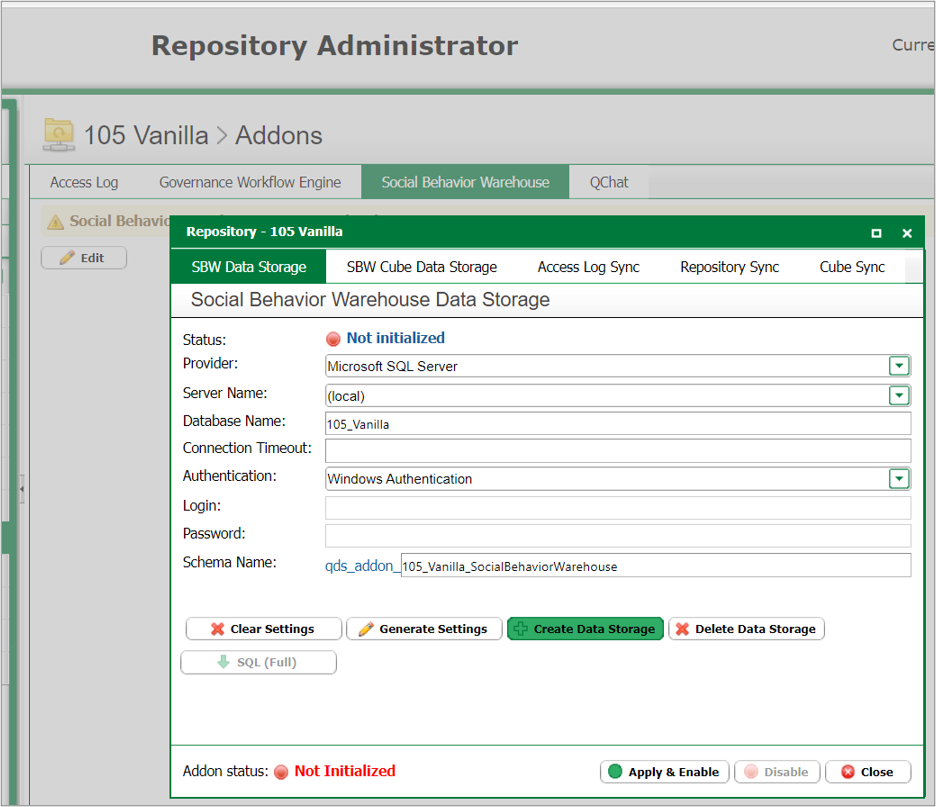
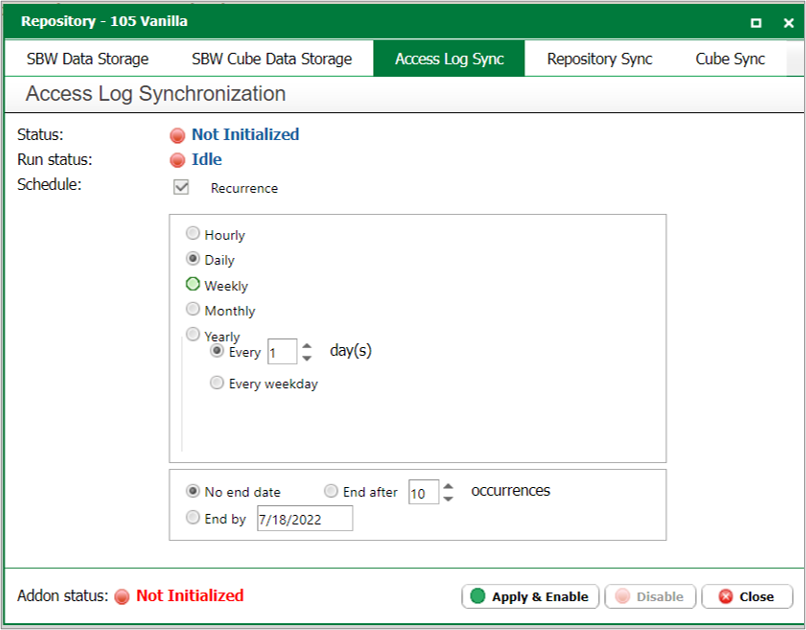
After the creation of the SBW Data Storage, two sync tasks must be setup:
- Access Log Sync, which reads from the QEF Access Logs into the specific repository’s access log including all clicks
- Repository Sync, which transforms the raw Access Logs data into the SBW data including all objects
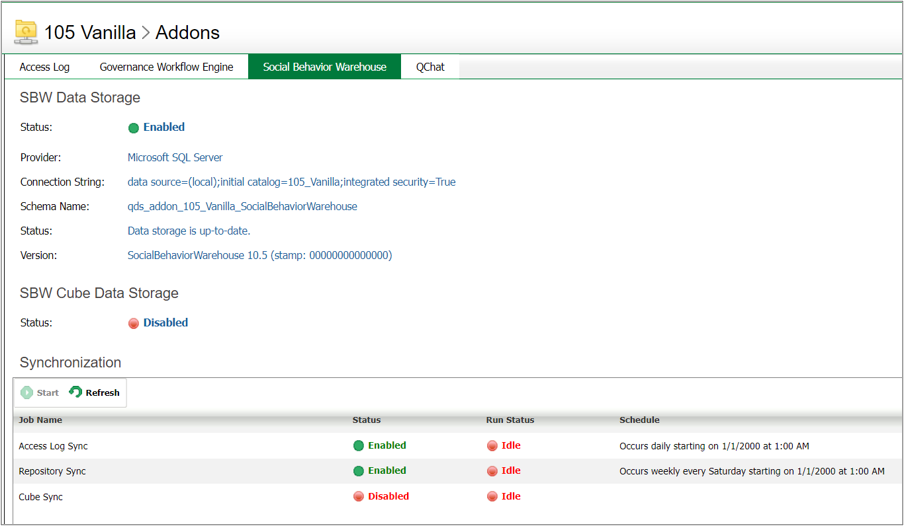
After the creation of the SBW Data Storage, configuration of Access Log and Repository Sync, the SBW Addon screen should look like this.
SBW tabs on models
The Analytics tabs are configured in each HTMLTemplateDefinition, for example, see the out-of-the-box configuration of the BusinessProcessNetwork template definition.
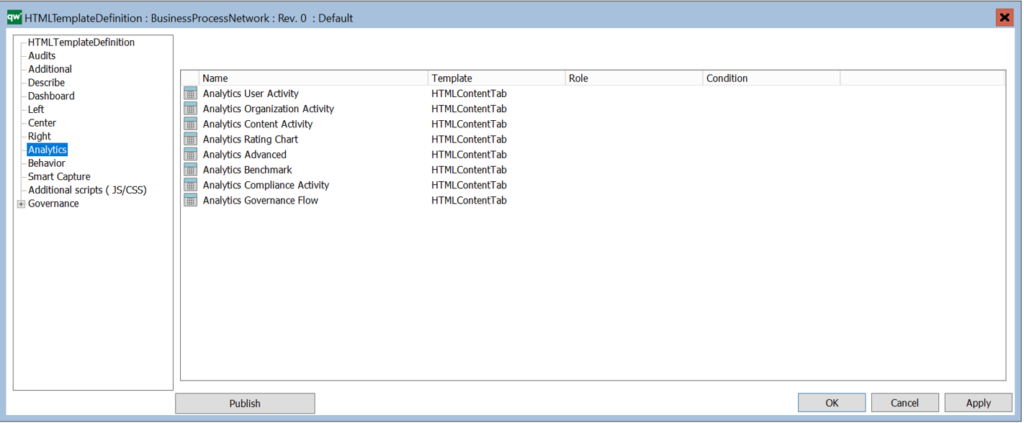
For details see the QualiWare – Guide for SBW
Governance Workflows
QualiWare Governance Worflow Engine
QualiWare Governance Workflow Engine is the perfect tool to provide consistency and compliance in the way complex knowledge is shared across the enterprise and also maintained by a large number of people over a long period of time.
QualiWare Governance Workflow Engine enables collaboration by automating sharing of enterprise artifacts during its entire lifecycle and by notifying relevant stakeholders whenever their attention is required.
The engine will control:
- all object state changes
- all communication between knowledge stakeholders
- all notifications to employees who have a pending governance task
- all escalations in case of overdue tasks
- all collaboration between employees participating in content development and improvement
- validation of content and compliance with rules and standards
- validation of SLA’s embedded in the governance workflows
Governance workflows are set up in QualiWare Lifecycle Manager and executed during run time by a high performing scalable workflow engine integrated with all object access in the entire QualiWare product.
Different artifact types require different governance workflows, so where a Business Process may follow a traditional change cycle, an artifact such as a Change Request, a Risk or a Non-Conformance may require very different handling.
Based on definitions of users, roles and access rights in Active Directory and QualiWare administration modules the actions required to move an object from one stage to another are assigned to the correct individual. When a person playing a specific role (persona) accesses an EA artifact from any device the features required to perform a certain task will be made available to the user. This dynamic configuration of functionality in the webfront ensures a friendly user experience, and makes it easy to collaborate and share knowledge.
The QualiWare Governance Workflow Engine continuously gathers information about all object lifecycles, state change, user activities etc. And because it is integrated with QualiWare Enterprise Publisher, QualiWare Analytics and QualiWare Social Behavior Warehouse, it plays a vital role in securing enterprise-wide consistency and continual improvement in the business performance and EA maturity.
Governance flows
In QualiWare it is possible to set up different governance flows for different types of objects (template-types).
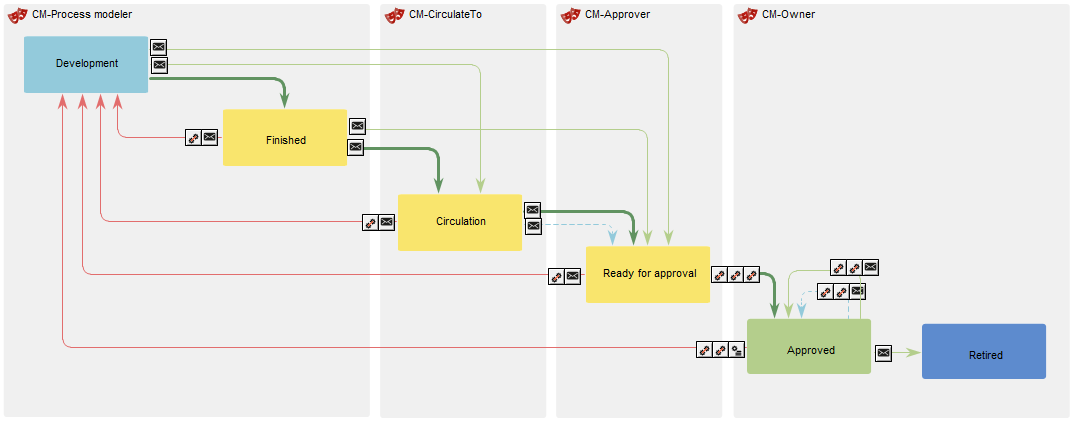
A governance workflow defines the governance stages and possible transitions between the stages.
For each stage, you define who has access to the available actions, e.g. who can edit the diagram or the symbol, who can approve an object, and who can create a change request associated to the object.
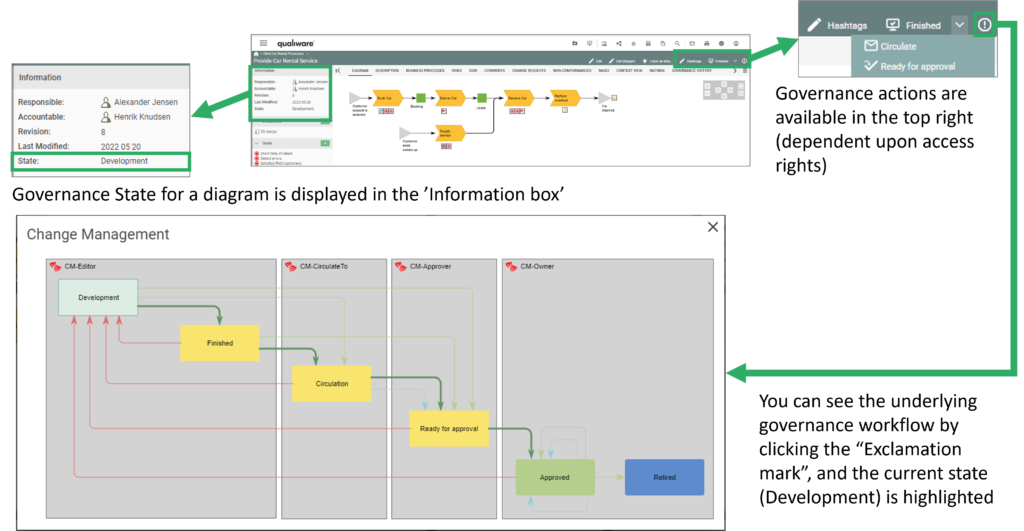
As shown in the figure above, the governance actions are available for the user in the top right corner. As part of the flow it is defined who has access to the governance actions, as standard the owner and the responsible for the content (e.g. diagram) will have access (this can be configured).
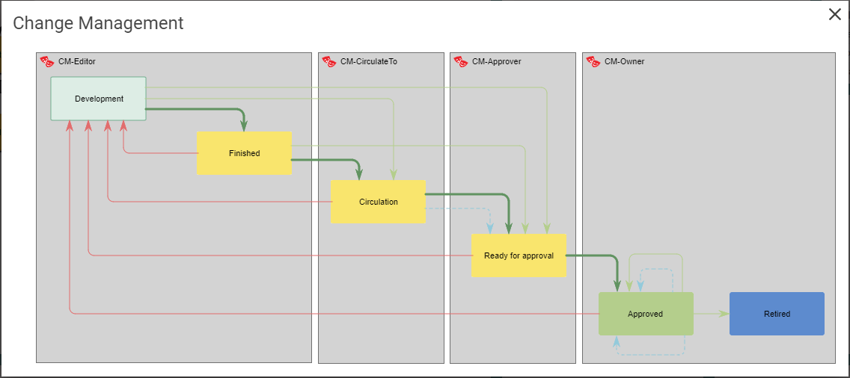
In the flow you can define the standard progress flow (shown by bold green arrows in the flow), alternative flows (light green arrows) and “rewind” flows (shown by red arrows).
Governance Tasks (To Dos)
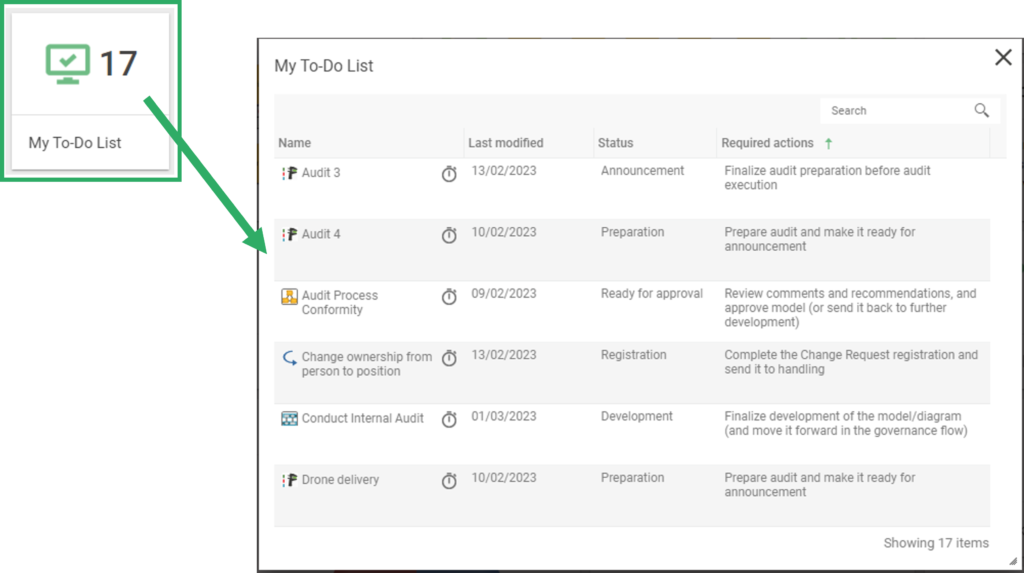
When a user gets responsible for a governance task it will appear on the user’s “To Do” list.
The list is shown as a standard Tile on the Web-Desktop(s).
When clicking the tile the user gets a sortable list with all the tasks, including a description of which required actions the user has in relation to the governance task.
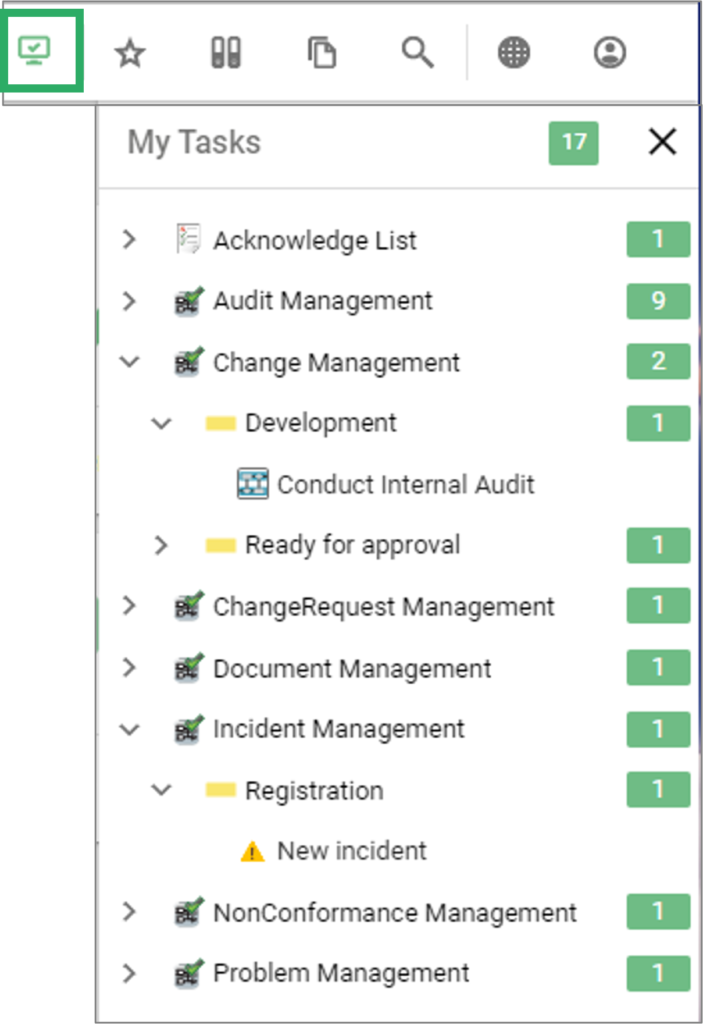
The governance tasks can also be accessed via the toolbar in the top right corner.
In this list the tasks are grouped by the associated governace flow, and governance state for each flow.
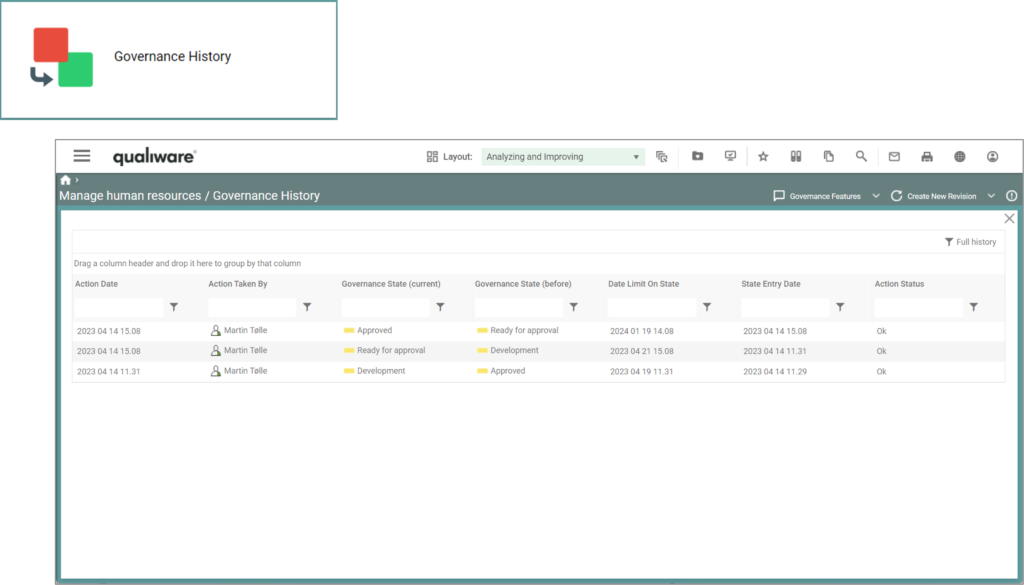
Governance History
The governance history of a diagram/object can be viewed from the “Governance History” tab on the classic layout, and from the tile on the dashboard.
Different actions for different governance states
As a part of a governance flow, a set of available actions are defined for the different governance states.
Presented below is the standard governance workflow for change management, along with the different available governance actions at each stage (these can be configured):
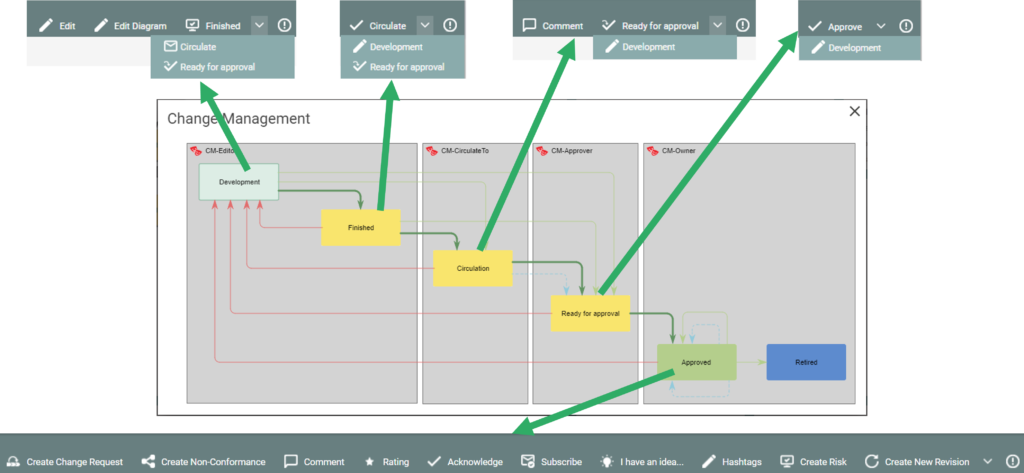

In the Development stage it is possible to:
- Edit, i.e. edit the properties of the diagram, e.g. description, responsible and so on
- Edit Diagram – open the diagram in the web-modeler enabling the user to edit the diagram before sending forward in the governance flow.
- Finish, i.e. move the diagram to the next stage “Finished”
- or alternatively select to move the diagram fast forward to “Circulation” or “Ready for approval“

In the Finish stage it is possible to:
- Circulate, i.e. move the diagram to the next stage “Ciculation”
- or alternatively send it back to “Development” or select to move the diagram fast forward to “Ready for approval”

In the Circulation stage it is possible to:
- Comment, i.e. add a comment to the diagram before sending it forward
- Ready for approval, i.e. move the diagram to the next stage “Ready for approval”
- or send it back to “Development”

In the Ready for approval stage it is possible to:
- Approve, i.e. Approve the diagram and freeze the revion of the diagram
- or send it back to “Development”
In the Approved stage it is possible for to perform a set of collaboration activities of the approved content, in addtion the owner/responsible can have additional actions (available action(s) can be configured):

In the Approved stage it is possible for all user to (available action(s) can be configured):
- Create Change Request, a new change request will be created associated to the diagram, and the user will be able to register the change request before sending it forvard to handling
- Create Non-Conformance, a new Non-Conformance will be created and associated to the diagram, and the user will be able to register the Non-conformance before sending it forvard to handling
- Comment, add a comment to the diagram
- Rating, the user can rate the diagram (1-5 stars)
- Acknowledge, the user can acknowledge the approved version of the diagram, and it will be documented in the acknowlede list
- Subscribe, the user can add the content to his/her “My Subscriptions”
- I have an idea, the user will be able to create a new Idea, and send it forvard to handling
- Hashtags, Add hashtags and tag the content
- Create Risk. a new risk will be created and associated to the diagram
In the Approved stage it is possible for the owner/responsible to:
- Create a new Revision, i.e. start a new governance cycle and move the next revision of the diagram into Development, to start the flow once more.
- or alternatively select to Retire the diagram
As a part of the flow it can be configured to move the new revision into a private workspace to seperate approved content and content under development, i.e.
- to have a base-configuration containing all approved version (available for all users)
- and a to have one or more workspace(s) containing content under development (available for the relevant users)
Standard Governance Workflows
There are a whole set of standard governance workflows available in the tool. Most of them is closely related to one specific template type (e.g. QualityAudit, Change-Request or Non-Conformance). Other flows are more generic and used to govern mulitple template types.
An example of the latter is the Change Management flow typically used to control the lifecycle of a diagram or an object going from development to approval, and up to retirement.
The standard flows can be imported and if needed adjusted for the specific need of the organization.
Below are some example of the most used standard governance workflows.
Change Management
The Change Management workflow is used for controlling the lifecycle of an object going from development to approval, and up to retirement.
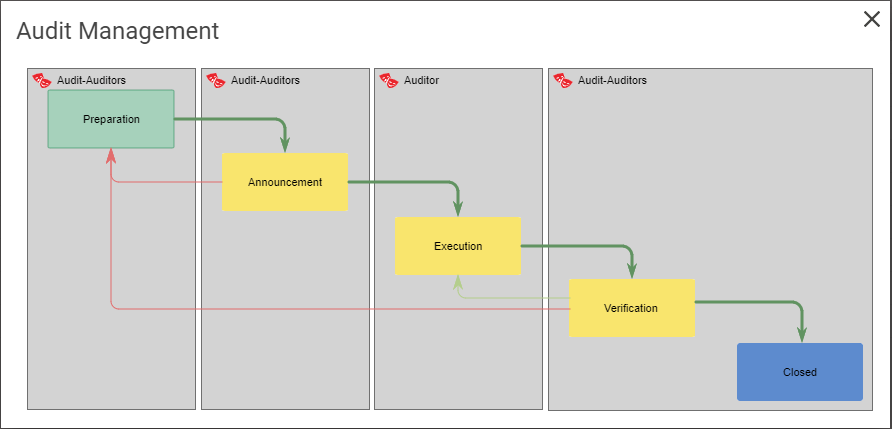
Audit Management
The Audit Management workflow is used in relation to the QualityAudit template, for controlling the different stages on an audit.
See Manage Audit for more details.
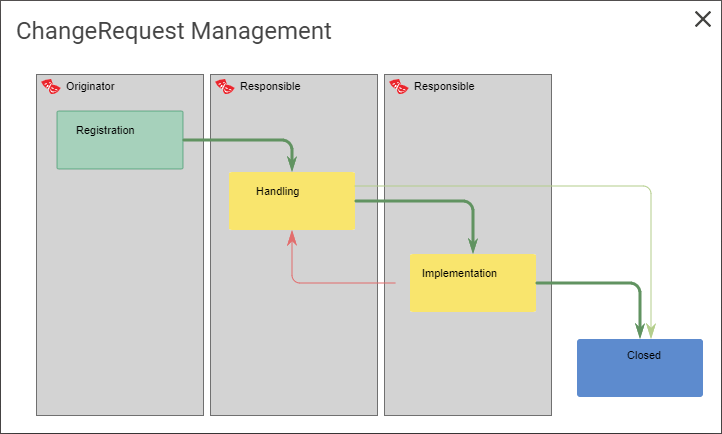
Change Request Management
This workflow control Change Requests. After a user have registered a change request, it is send to handling and implementation before it is closed.
Change Request can be associated to all types of content in the repository.
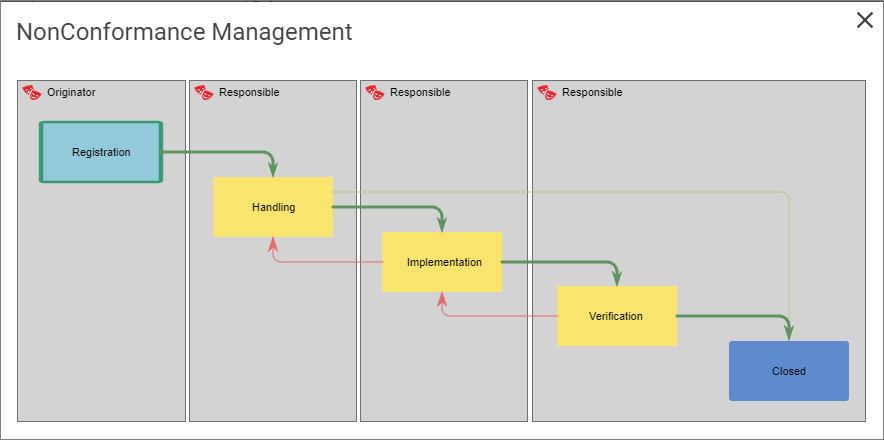
Non Conformance Management
This workflow control Non-Conformancies. It is similar to the Change Request Management flow, however it has to be verified before it can be closed.
Like Change Request, a Non-Conformance can be associated to all types of content in the repository.
Incident Management
This workflow control incidents. Once an incident is created by a user, it is send to investigation by the responsible, and if needed the incident can be changed to a complaint, non conformance, change request or accident.
This way the end user just have to register an incident and then the handler can afterwards “re-categorize” it.
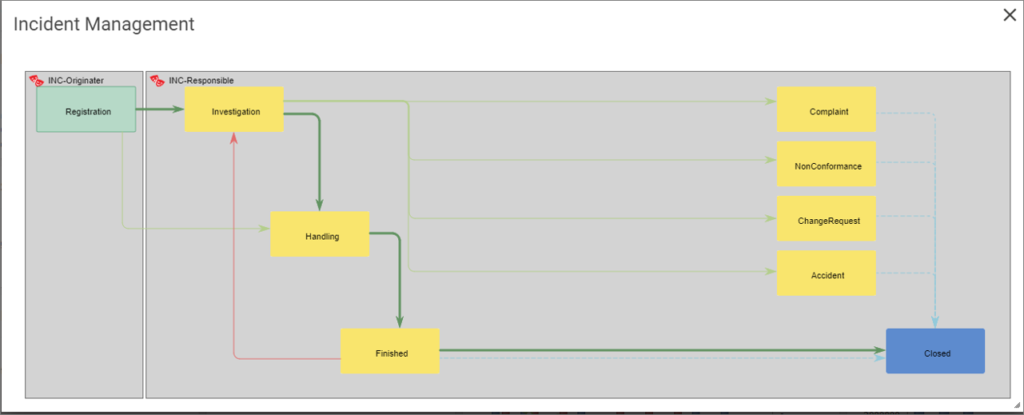
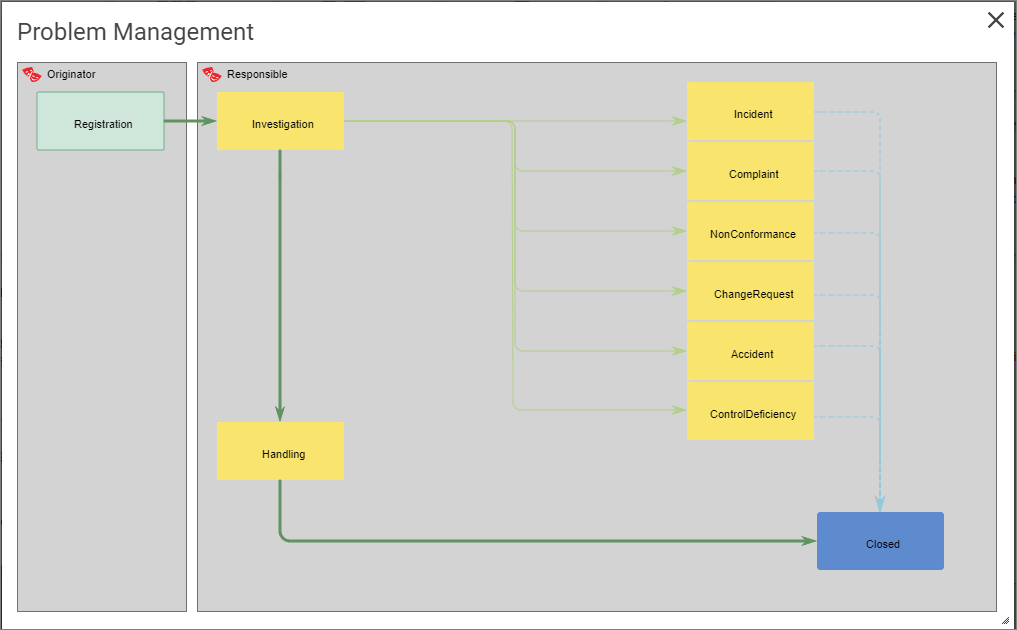
Problem Management
This workflow is similar to the Incident Managment flow – there is a difference in what information is transferred from the problem to the new type and there is the addition of also being able to transfer the Problem to a ControlDefiency
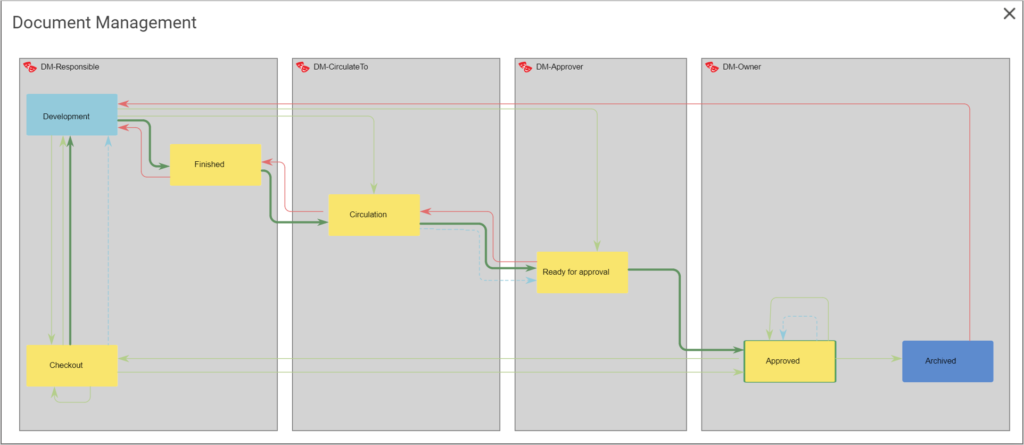
Document Management
This workflow governs documents controlled by the QualiWare Document Management (QDM).
Video Highlights
This video shows how the standard governance workflow for change management:
- how a diagram is changed from development to approved.
- and how a new revision is created to start the flow for the next revision.
As standard all users have easy access to their governance task from the toolbar in the top right corner.
In this list the tasks are grouped by the associated governace flow, and governance state for each flow, as shown in this video.
For Administrators
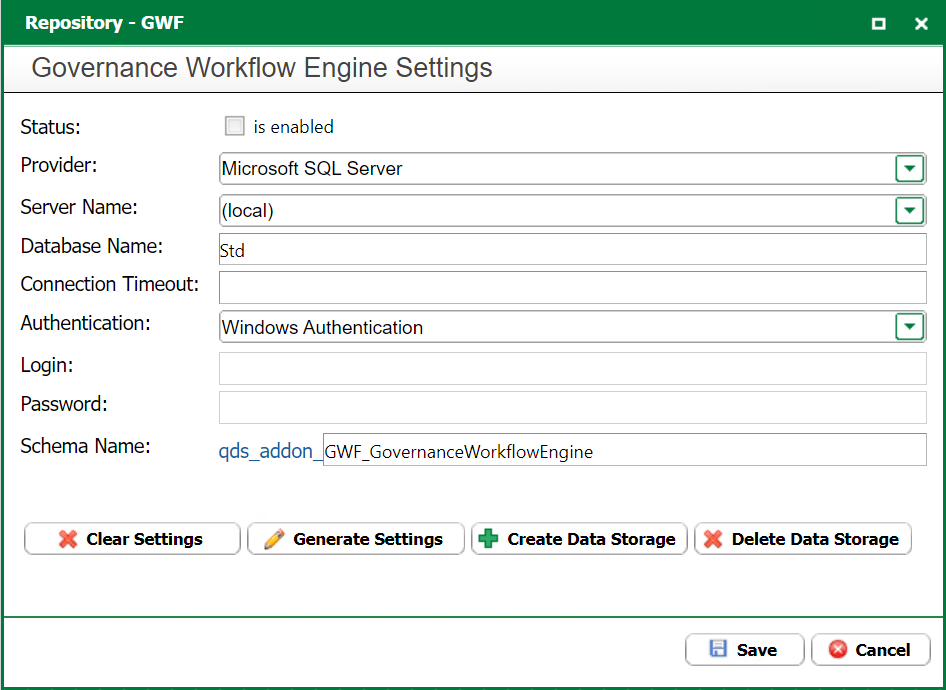
The Governance Workflow Engine (GWE) has to be set up in the QEF / Repository Adminstrator for the governance workflow to work.
In Repository Administrator the GWE is enabled as an Addon to the repository.
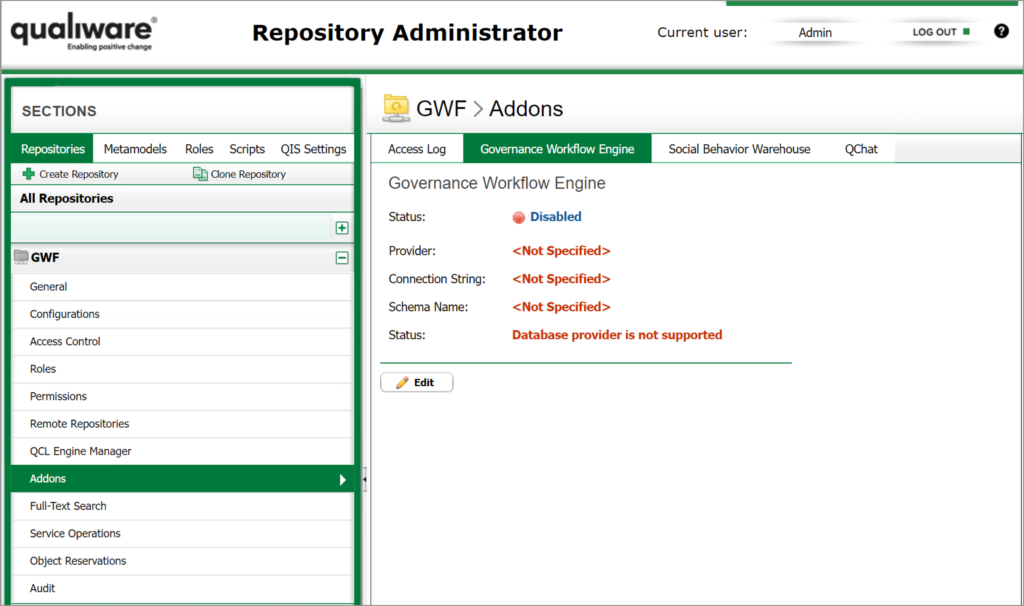
Choose the Governance Workflow Engine tab and click the edit button. If “Generate Settings*” is used the default values for the GWE repository will be to create the schema in the same database as the first ever created repository.
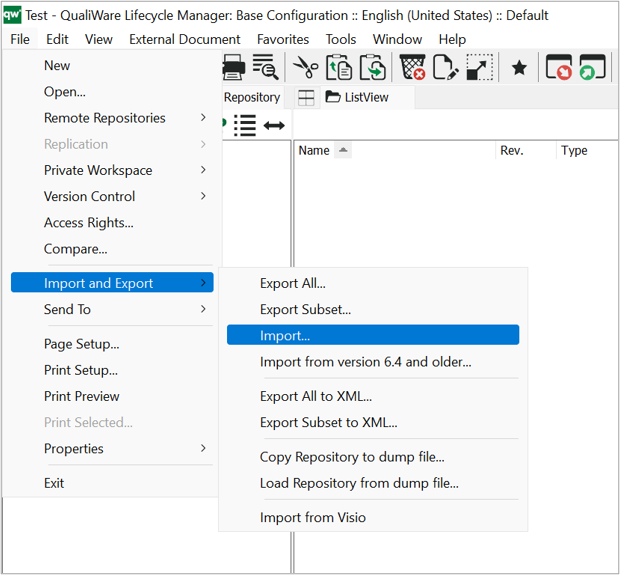
As shown above, there are several standard governance workflows included in a standard installation. You can import the standard workflows to QLM using the import feature.
For a video tutorial see further down this page
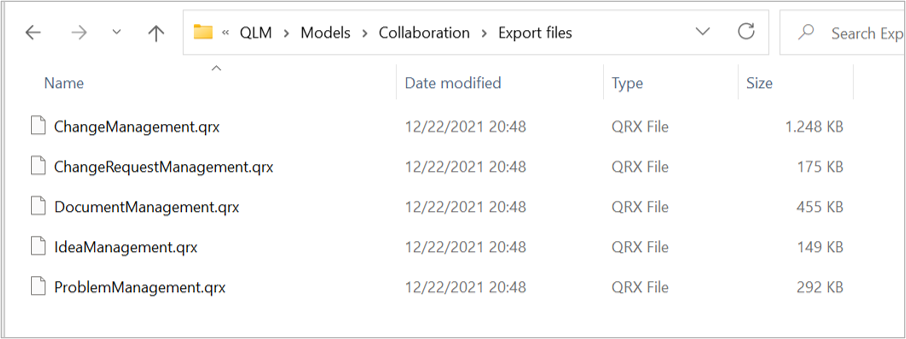
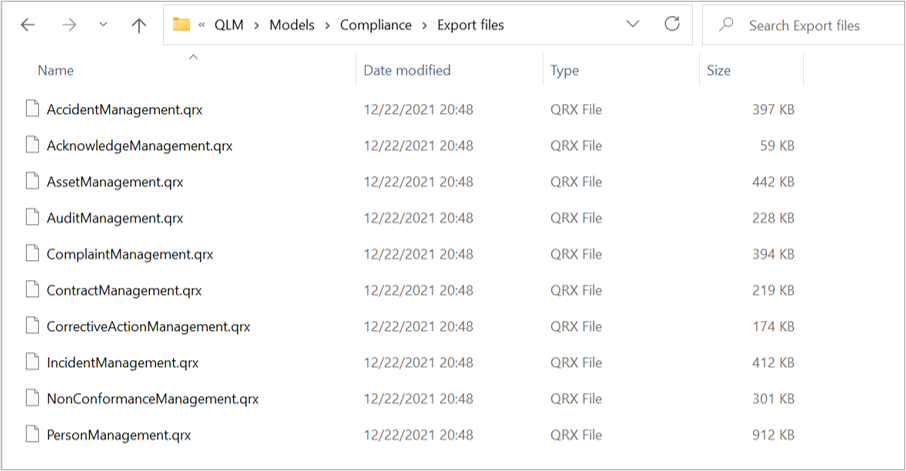
The standard governance workflows can be found in the “models-folder”:
- The collaboration flows (including Change Management) are located under Collaboration:
- The others can be found under Compliance:
Once a flow is imported, you will find all governance templates in QLM under “Governance“
Configuring your governance workflows
The following video will showcase:
- How to configure you governance workflow
- How to import governance workflows
- How to add administrators
- Which template is connected to the specific governance workflow
- Who is responsible for changes going from Approved to Development
- How to change the behavior of the workflow before and after the approval process
You can find all governance templates in QLM under “Governance“, below is an example of a governance workflow diagram and a link between the most relevant templates in a workflow. Each of them are described in more details in the links below.
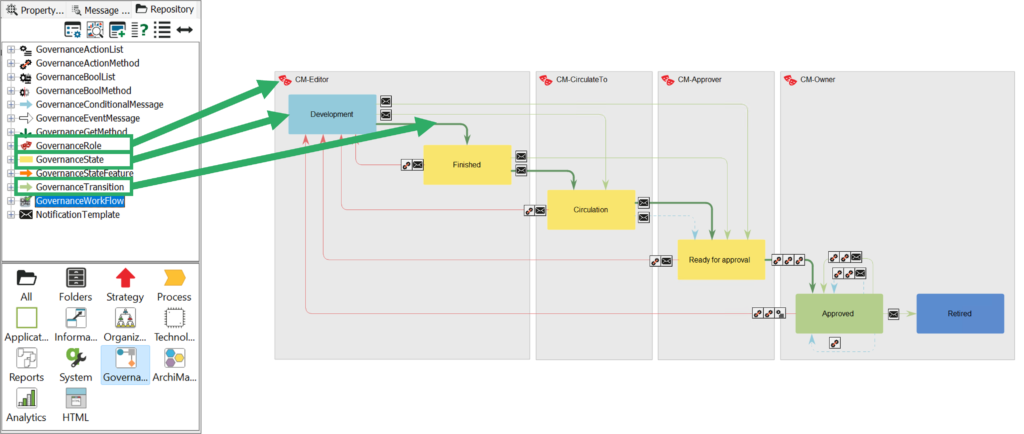
The most essential templates used to configure a flow are (as highlighted in the figure above):
Other governance templates:
Cloud Services
This Meta Model customization has been created with the aim to embrace various Cloud Services providers’ solutions. In this customization, cloud services are “first” provider agnostic (they appear as “green cloud” symbols), but at time the provider is defined for a “Cloud Architecture Diagram”, the symbols in the diagram adapt their appearance to the corresponding symbol of the provider, as characterized along categories and instances defined for this provider.
The providers that QualiWare currently support are:
Using the Cloud Services Meta Model
The goal in using this Meta Model, is not only to describe and manage the cloud architecture knowledge, but also to relate the described and modeled cloud services elements to the Enterprise Architecture elements which have been defined, described, modeled prior to define the operational cloud implementation.
The guidance provided below is based on a set of use cases which aim at defining, describing and modeling a “Cloud Architecture Diagram”, and the embedded “Groupings”, Services and Flows, as well as managing the reference relationships to Enterprise Architecture elements.
Defining a “Cloud Architecture Diagram”
The QLM user creates a new “CloudArchitectureDiagram” the same way as for any other diagram he/she is used with. Then by opening this diagram for the first time, the user is asked to associate it to the Cloud Provider as on the image.
This is explained in our Cloud Architecture Diagram
Web-modeler
It is a typical phenomenon that only a select few experts are doing the modelling in your organization, which in turn results in a lack of understanding and use of the models in the rest of the organization.
With QualiWare X we are creating a space for inclusive collaboration in a web-based interface, with the purpose of organization-wide involvement. By enabling everyone to create business process networks, workflow diagrams, ArchiMate diagrams, and several other types of diagrams, directly from your browser, with intuitive and easy-to-use visual drag and drop design, you are guaranteed increased mobility, flexibility and stakeholder engagement across the entire organization.
Content
The diagrams can be created and edited the “classic way”, using the drag-and-drop design:
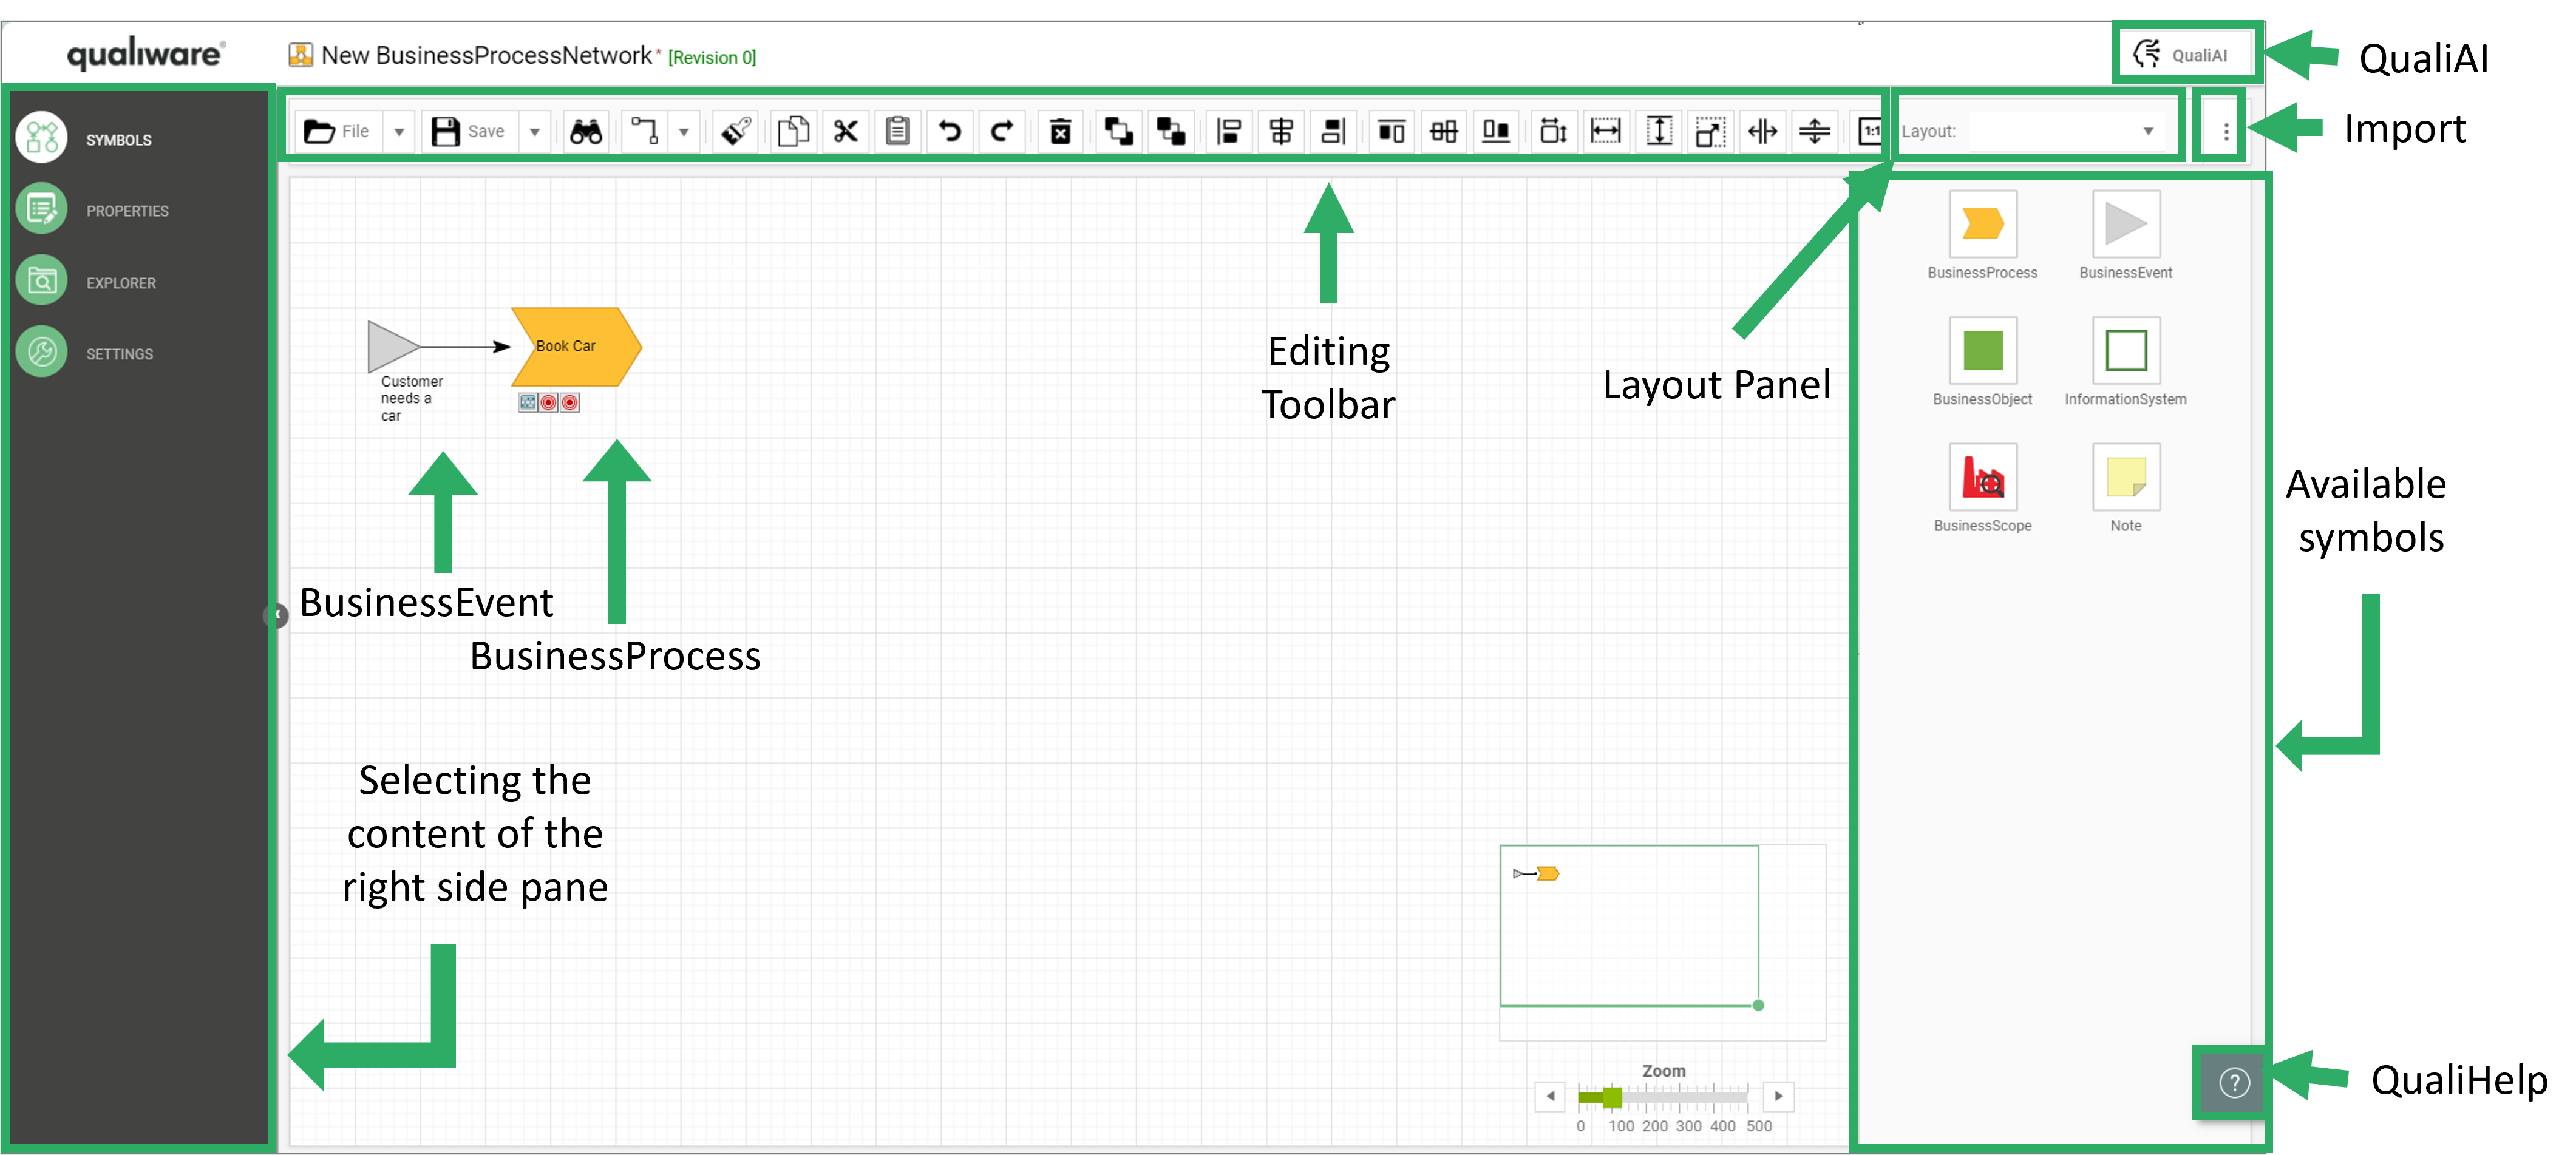
In the Editing Toolbar you can find buttons that can rearrange, resize and align symbols.
Use the Layout panel, to automatically organize the objects in accordance with one of the available standard layouts.
You can also use the import menu to accelerate the model creation based upon inserted/imported text:
- by using the text-to-model feature,
- or use the new table-to-model feature introduced in QualiWare 10.8
Below is a guide on how to use the different features of the web-modeler and at the bottom there are videos that will explain further, along with a list of useful shortcuts.
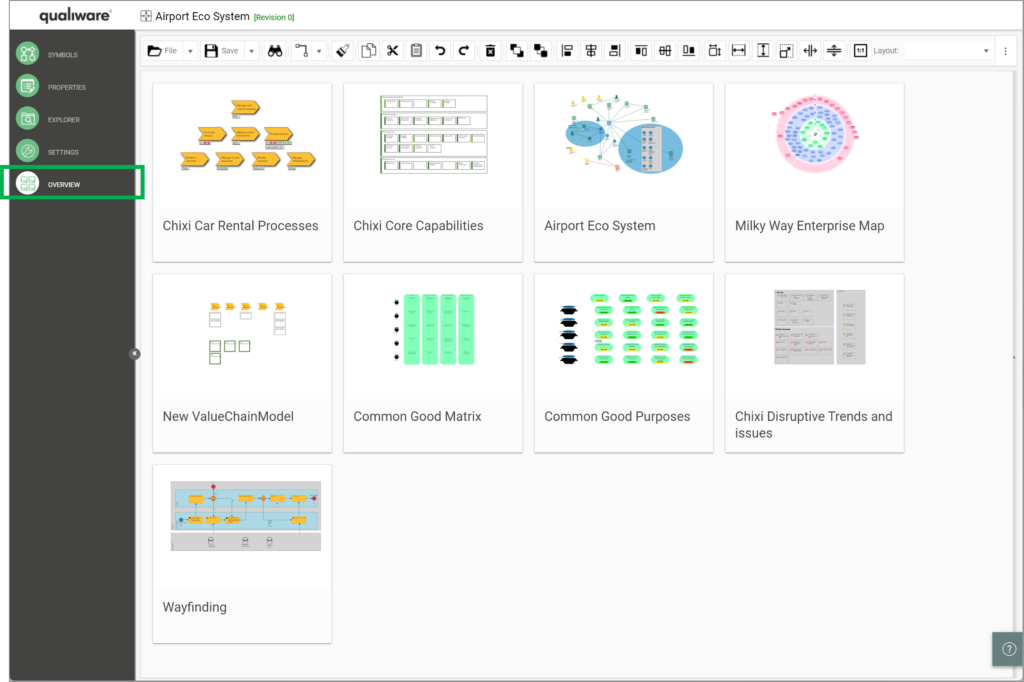
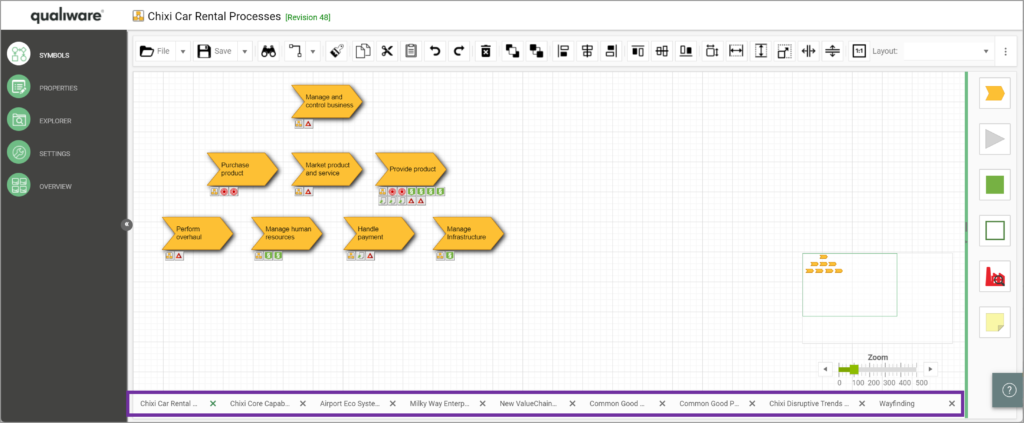
QualiWare is working on enabling more and more diagram to the web-modeler, below is a list of diagrams currently available in the web-modeler.
Creating/Editing a Diagram
Adding a Symbol
You can add a new symbol to the diagram the following way:
1a. Either left Click a symbol (a BusinessProcess) from the symbol bar or Drag with your left mouse button and release where you wish to place the symbol
1b. or double-click on the white canvas for a list of available symbols, and select the symbol type you need

2. Give the object (BusinessProcess) a name. Once 3 or more characters of the name are typed, a “search-box” will appear showing all similar objects in the repository of the selected type (BusinessProcess). This enables reuse of objects and/or having unique object names in the repository.
3. Alternatively hover over an object (BusinessProcess) you wish to repeat/clone and click one of the four arrows
- Click to clone and connect
- CTRL+Click to clone
- Shift+CTRL+Click to connect
- Click and drag to draw connection and end with double click to connect to a new symbol (a list of allowed symbols will be shown)
4. A new object (BusinessProcess) will appear. If multiple connection-types are allowed between the two symbols, select the desired connection-type from the menu. Then double click the label and name the new object (BusinessProcess).
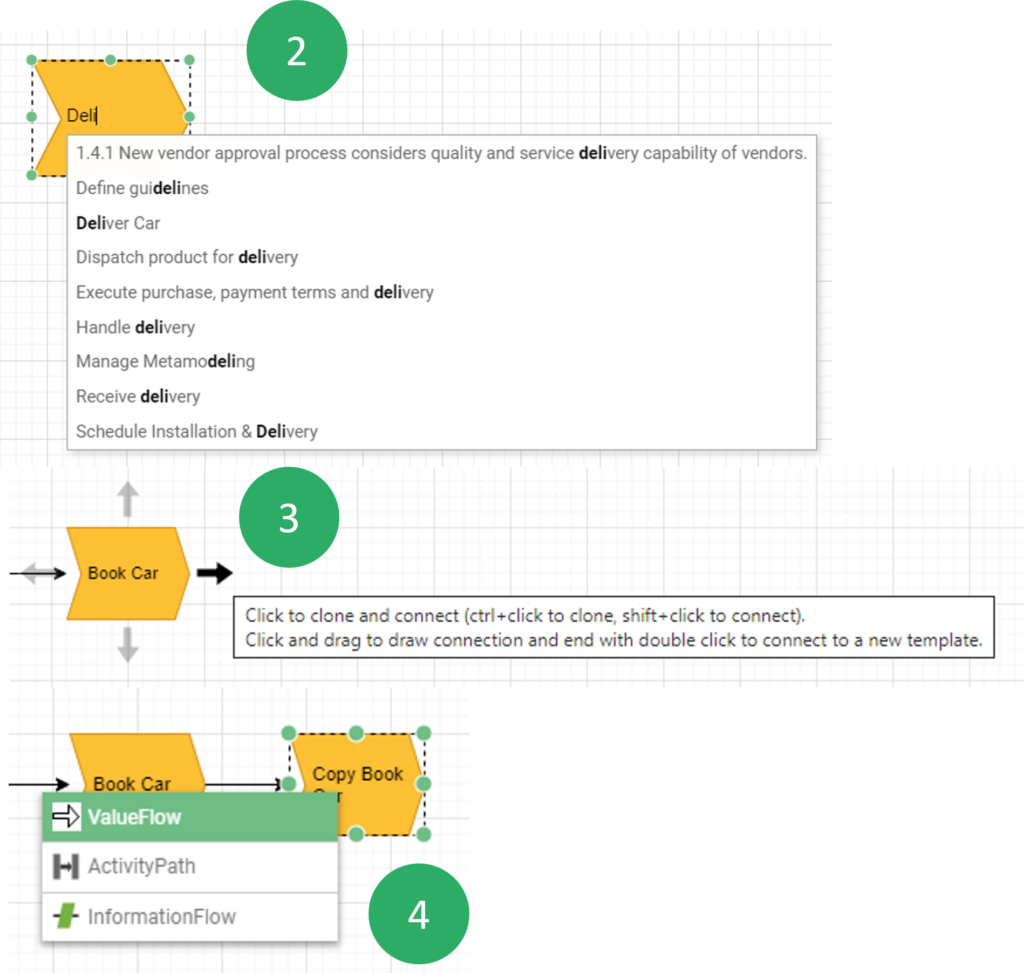
Re-using Symbols
Another way to find and reuse a symbol is described below:
- Select the object (BusinessProcess) and double click the name to highlight the text
- Right click the name to open a list of existing objects (business processes)
- Browse the list to find the object (BusinessProcess) you’re looking for. Try to sort the columns differently by clicking the column header or enter a searchstring in the search field to narrow down you last.
- Select the desired object (BusinessProcess) or click ‘Create New’ if you didn’t find what you were looking for. Finish by clicking ‘Select’ to return the selected object (BusinessProcess) to the diagram
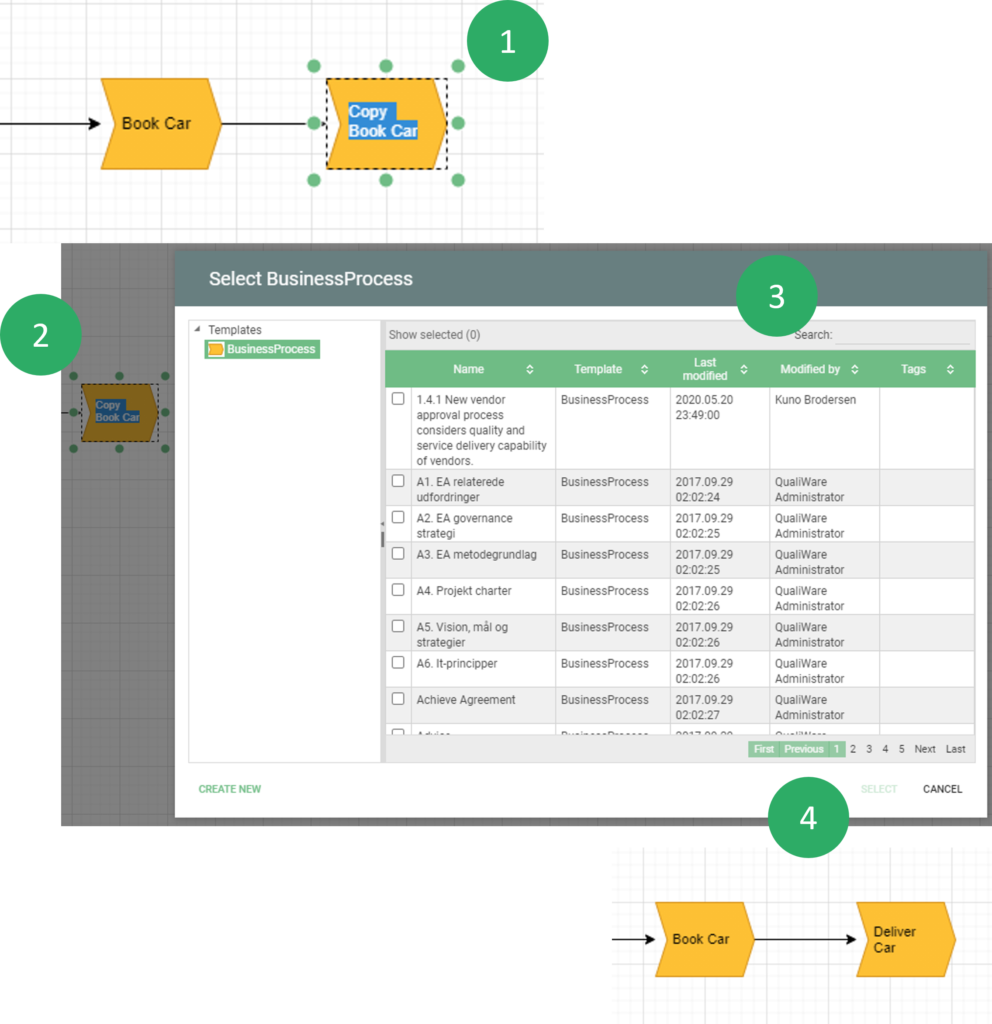
You can also explore the existing objects in the repository.
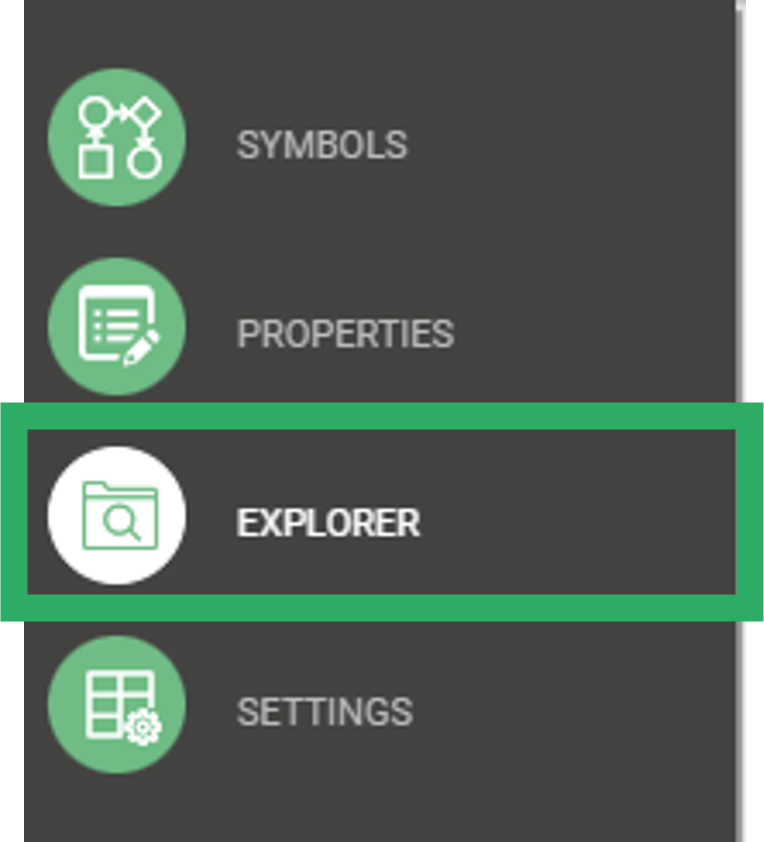
If you select the “Explorer” in the left window, you get a full list of all objects in the right side pane to select from.
From the right side pane you can reuse an object in your model by drag and dropping the object on the canvas.
Connecting Existing Symbols
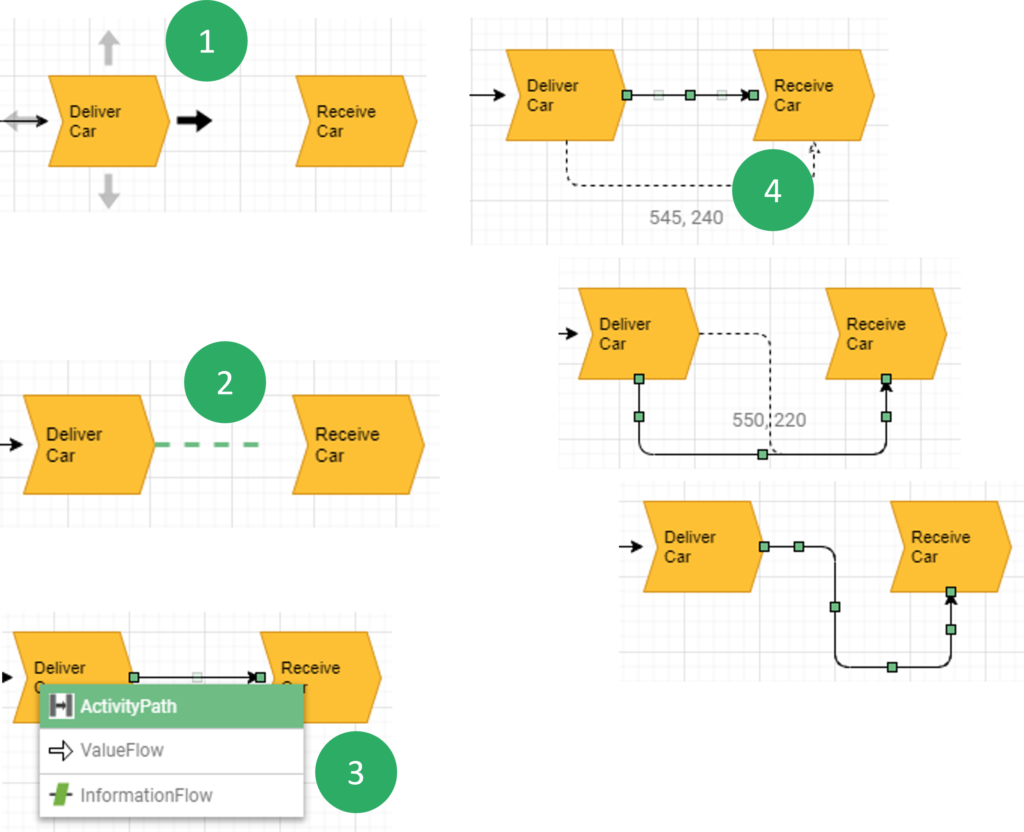
- Hoover the source symbol and select the arrow on the side of the symbol where the connection should start.
- Drag the arrow with the left mouse button and release it on top of the target symbol
- Select the desired connection type from the popup menu
- Use the green selector points on the connection to move sections of the connector to different positionsTip: To find the easiest route between two symbols just select the connection and press the ‘Space’ key
Editing Symbol Characteristics

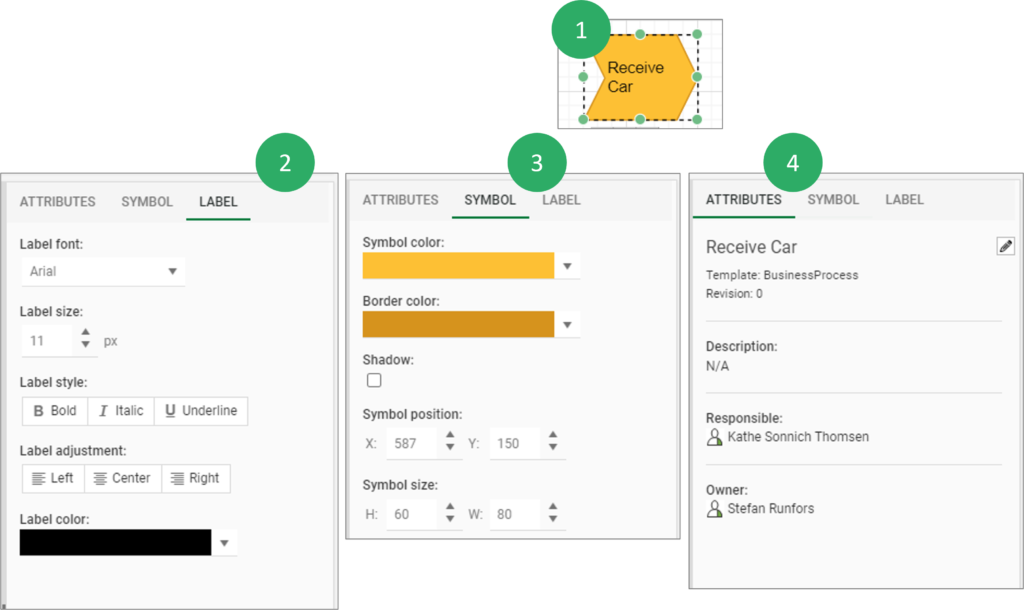
- Click the symbol or select from the left menu to open a properties pane on the right side of the diagram.
- Select the ‘Label’ tab to edit the symbol label style
- Select the ‘Symbol tab to edit graphics style of the symbol
- Select the ‘Attributes’ tab to edit view the properties of the symbol
Editing Toolbar
Sizing

- Use the buttons in the toolbar to align symbols
-
- First select the controlling symbol (the symbol with the correct size/width/height. Then hold the shift key down and select the symbols you wish to change.
- Then press one or more of the action buttons
- Resize to original size
- Align width (with first selected object)
- Align height (with first selected object)
- Align size (with first selected object)
Alignment

- Use the buttons in the toolbar to align symbols with first selected
-
- Align left edge
- Align vertical center
- Align right edge
- Align top edge
- Align horizontal center
- Align bottom edge
-
- Align horizontal spacing with first and last selected
- Align vertical spacing with first and last selected
Layouts
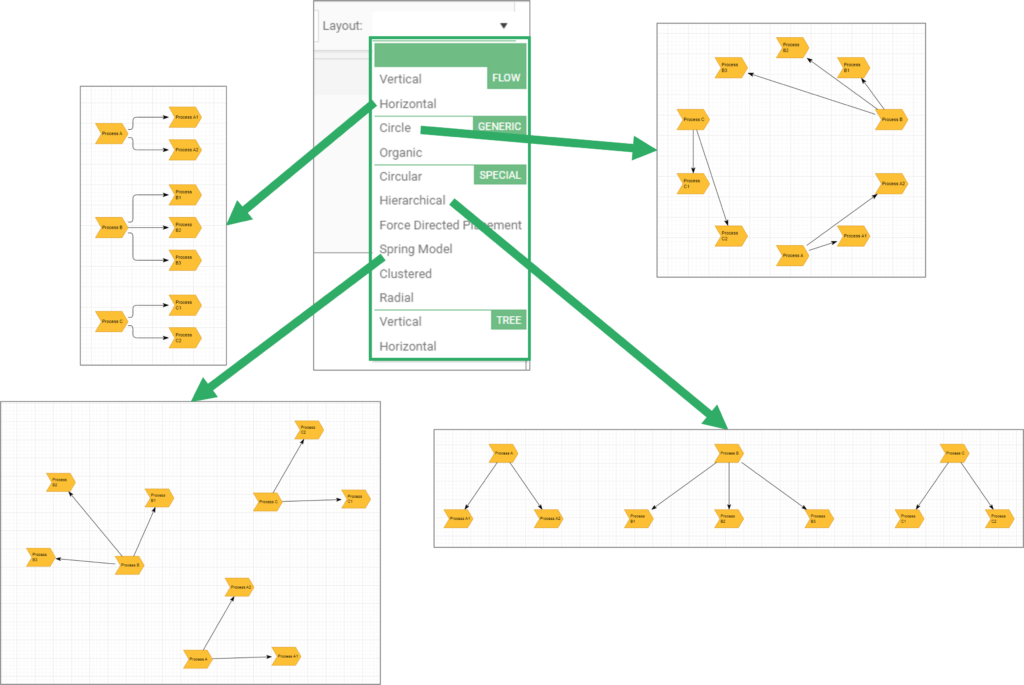
You can shift between different layouts.
The Web-modeler will automatically organize the objects according to the selected layout.
Import model from Text or Table
Text to Model
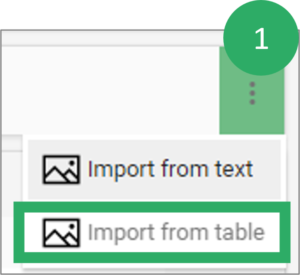
- Select “Import from Text”
- You can type in/insert text in the “Text to Model” box
- NOTE there is a short guidance text for how to insert text when using the default setting for the Connection and Hirarchical layuot types
- The model will be created based upon the “Settings”
- Here you can choose between different Layout types, to which template(s) the inserted text should be “translated”, select Seperator, and specify symbol size.
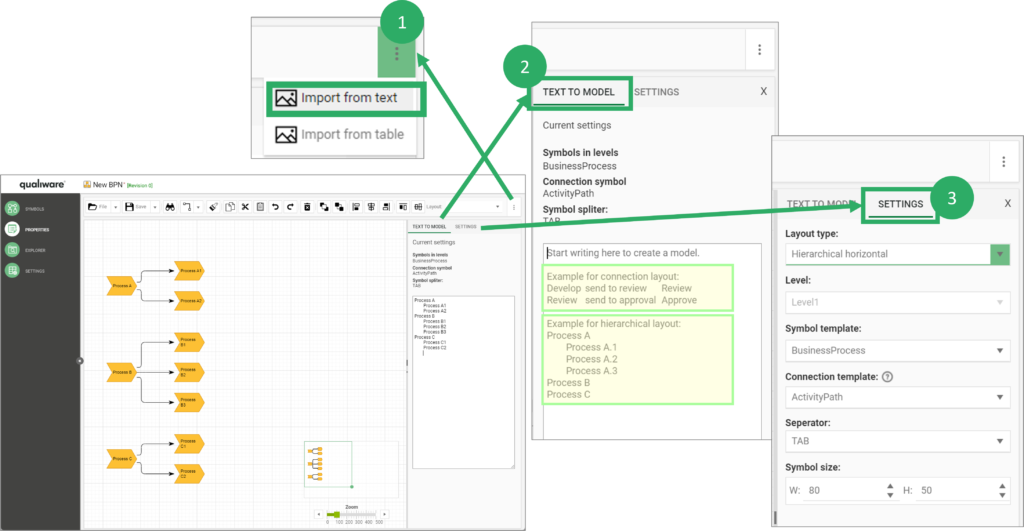
Table to Model
- The import from table can be used to easy draw workflow-diagrams and box-in-box diagrams
- Once you type in the columns in the table the model will be created
- You can select/change symbol template for the symbol
- When you refer to a symbol in “Connects To” column the symbols will be connected (activities in the same row will be auto connected)
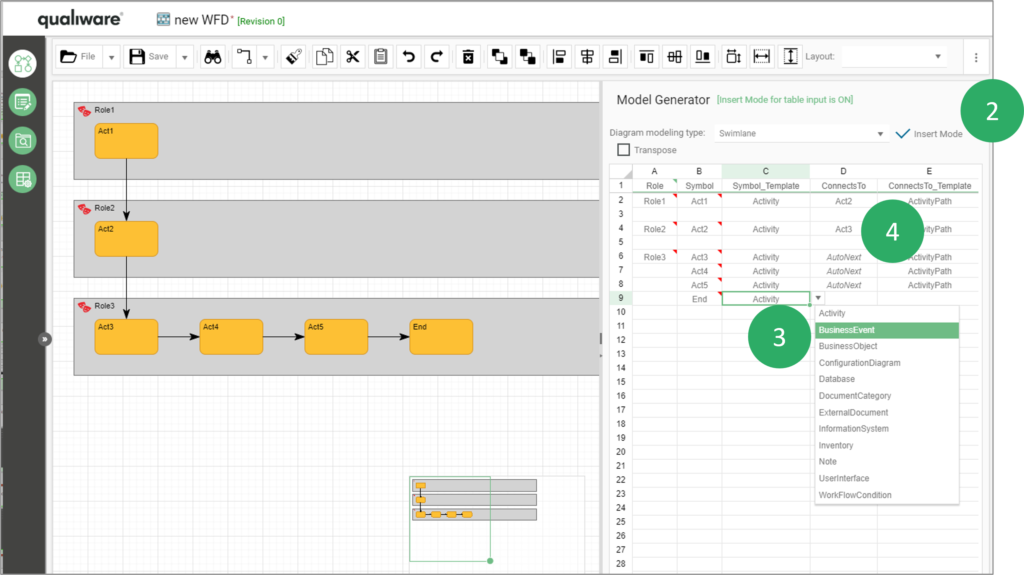
Below is an example of a box-in-box diagram (Business Capability Model), created using the table to model feature.
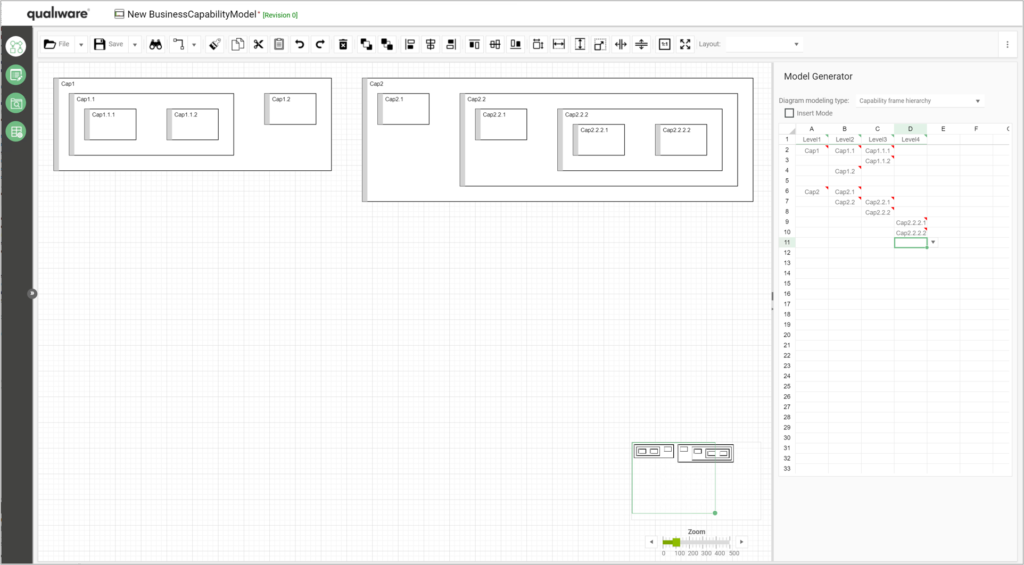
The table to model settings can be configured via the HTML Model Generator Settings template.
Videos demoing the Web-modeler:
Useful Shortcuts in the Web-modeler
F2 Rename the selected object.
F3 Search.
J Align the selected objects respective of the first selected object.
S Copy the Size of the first selected object to all the subsequently selected objects.
Spacebar Automatically re-draw the selected connections.
ALT + Left-click Selecting an object and ALT+ Left-clicking on an object’s label opens the label editor.
ALT + Left-click + drag ALT+Left-click a label/button panel while moving the mouse, moves the label/button panel.
CTRL + A Select all objects in the diagram.
CTRL + F Find a symbol in the diagram.
CTRL + G Toggle the drawing grid.
CTRL + Y Redo.
CTRL + Z Undo.
Arrow-keys Move the selected object in the arrow key direction.
Shift + Z Automatically zoom to view the entirety of the model.
hold Z + Left-click + drag Zoom to the window selected by the mouse.
1 Zoom to 100%
Shift + CTRL+ Left-click + drag Create/remove space between objects in the direction of mouse movement. This will move all object(s) to the right and below the mouse click (shown by support lines)
Download the shortcuts-list in pdf:
