Timing Diagram

Purpose: The purpose of the Timing Diagram is to show the change in state or the condition of a lifeline over time.

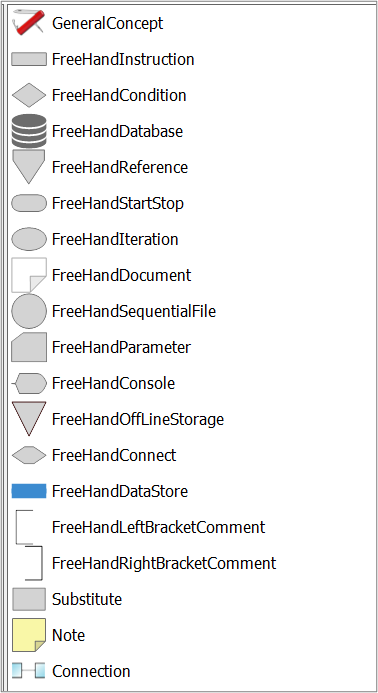
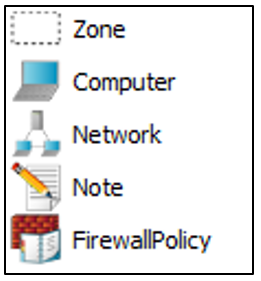
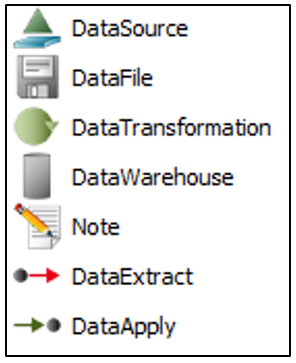
Core concerns: The Timing Diagram template enables you to model Lifelines, Duration Constraints, Time Constraints, Tick Marks and Annotations. These elements can be connected by Messages or Lifeline Changes.

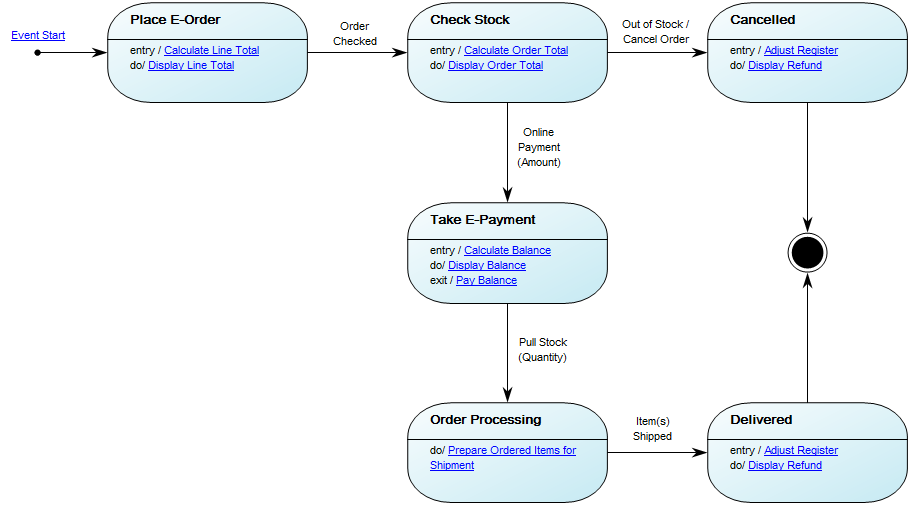
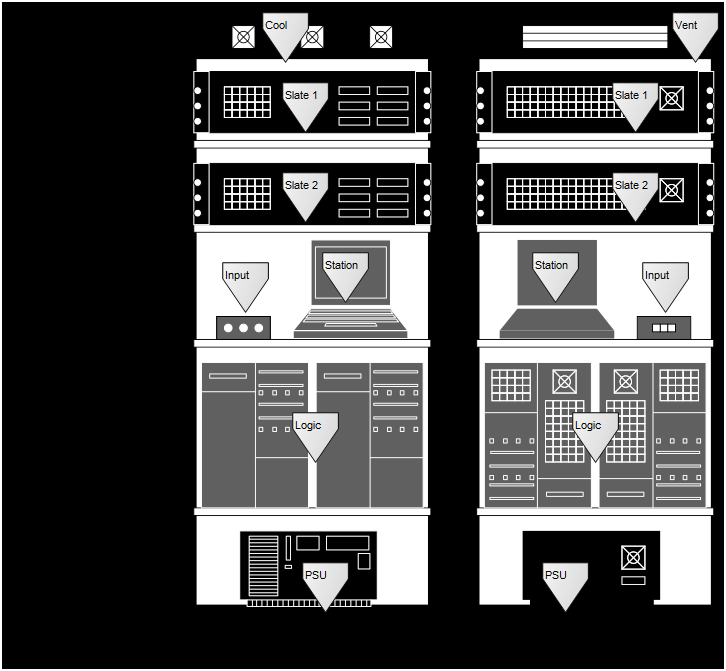
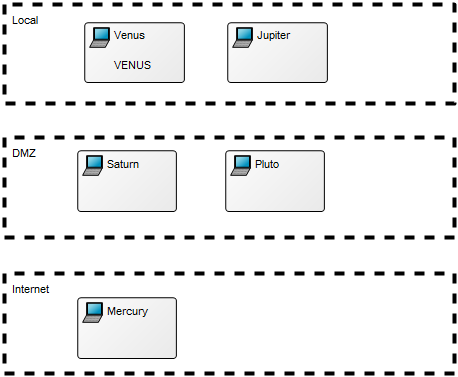
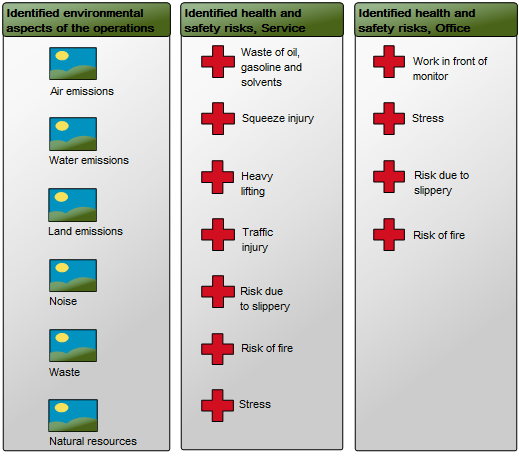
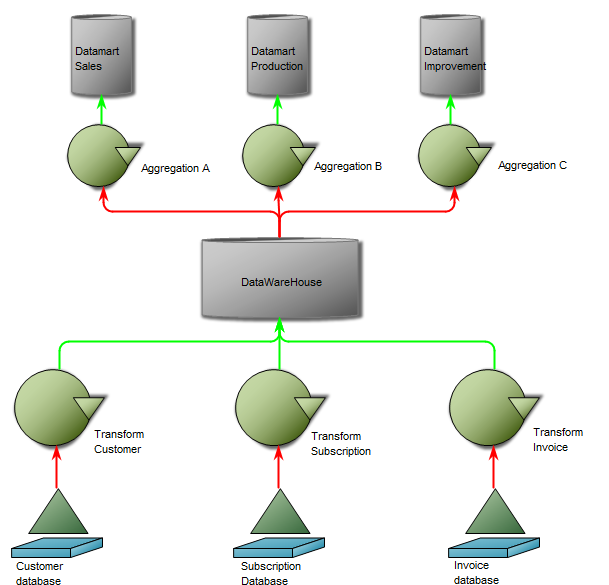
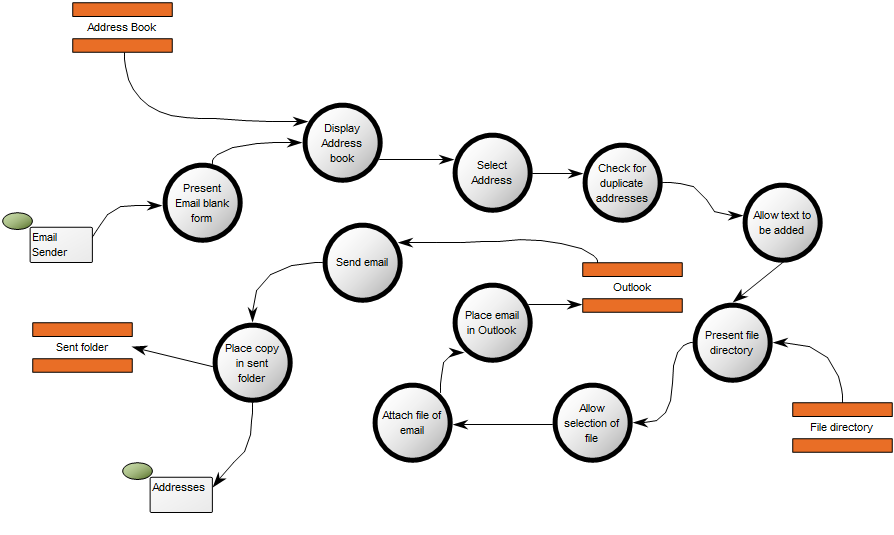
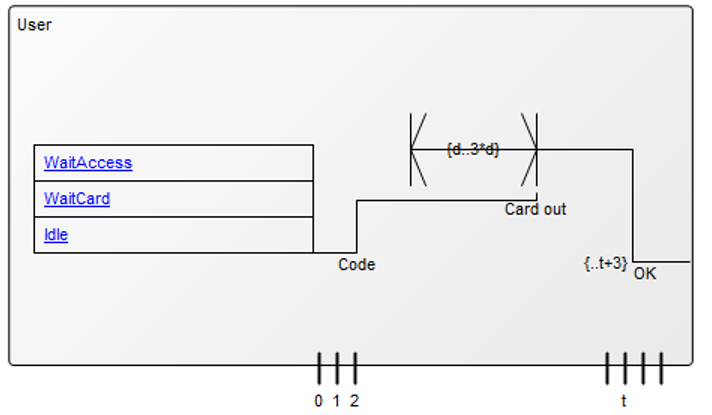
The most common usage of a Timing Diagram is to show the change in state of an object over time in response to accepted events or stimuli.

Below, you can see an example of a simple Timing Diagram for the user of a ATM:

Relation to other templates: The Timing Diagram is part of the UML templates QualiWare supports along with the Activity Diagram, Communication Diagram, Deployment Diagram, Class Diagram, Composite Structure Diagram, State Diagram, Package Diagram, Component Diagram, Sequence Diagram, Use case diagram, and Composite structure Diagram.

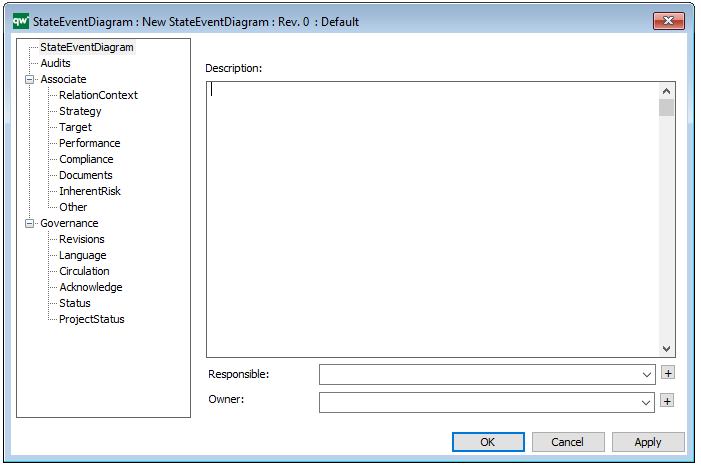
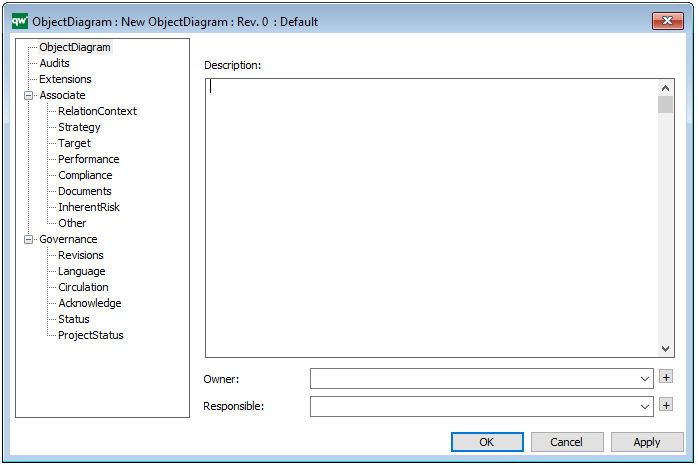
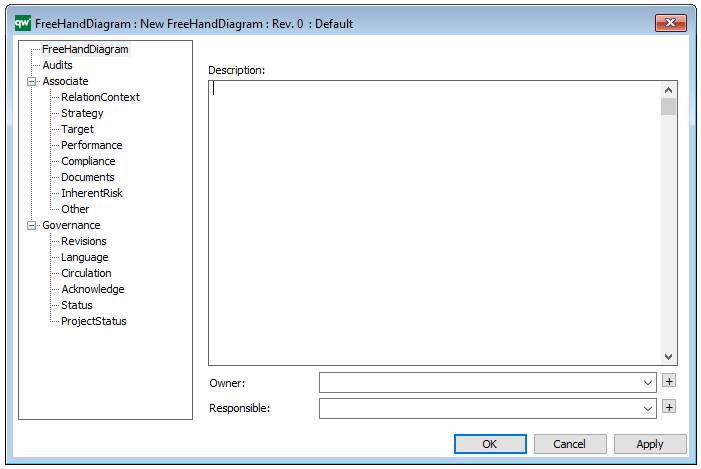
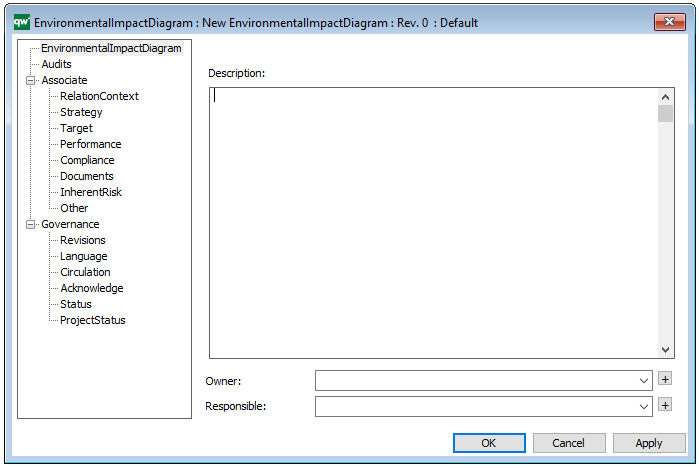
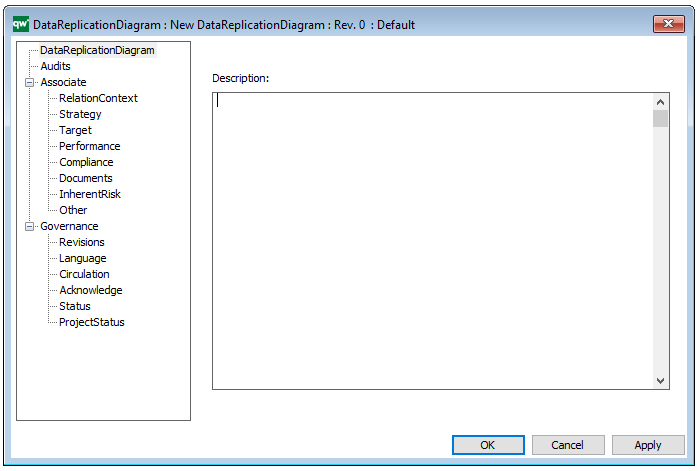
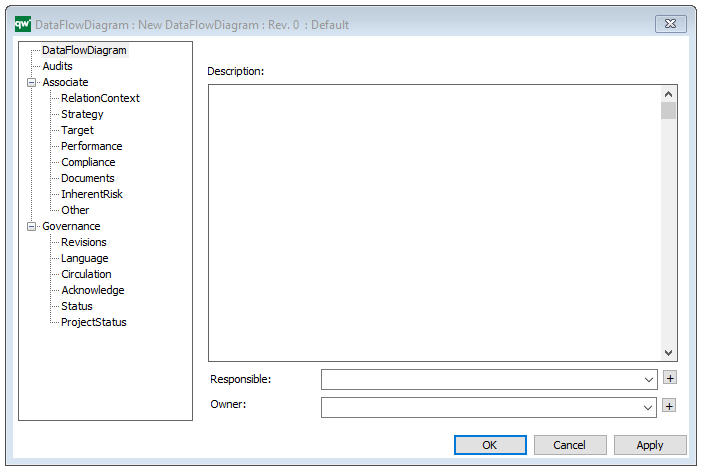
Properties and metadata: The Timing Diagram template ­­­­can for example retain the following information:

  • A description of the diagram
  • Extensions (Stereotypes, Constraints and Tagged values)
  • Audits (auto generated information regarding its current state and access rights)
  • Associated documents, diagrams and other objects
  • Inherent Risk detailing risk considerations
  • Governance information detailing information about the published diagram and who has been involved in the approval of the diagram

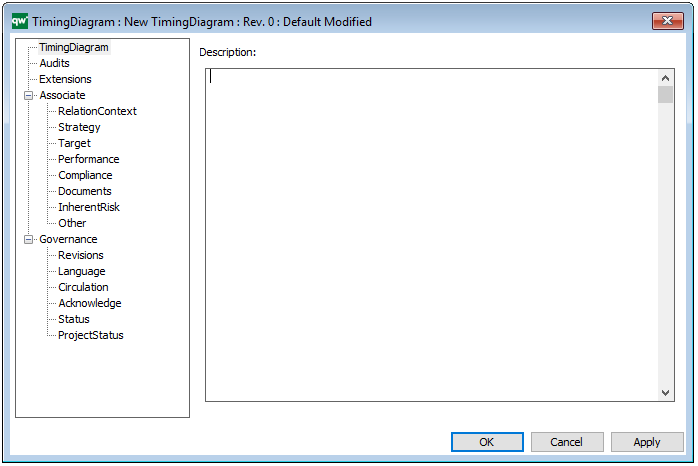
The above picture shows the properties dialogue window for the Timing Diagram template, where you can view and edit the diagram’s properties in QualiWare Lifecycle Manager.

For more information: To learn more about the UML, please visit the Object Management Group’s Website, where you can find the complete specification.

State Event Diagram

Purpose: The purpose of the State Event Diagram template is to document the time dependent behavior of a system by showing the different States and State Transitions a system can go through.

Core concerns: The State Event Diagram enables you to model States and connect them with State Transitions. The State can be manipulated by opening its properties dialog and chose ‘Final State’ to illustrate the end of the state. The Start event is created by choosing ‘Start’ in the properties of the State Transition.

Below, you can see an example of a State Event Diagram for an ordering system:

StateEventDiagram_1

Relation to other templates: The State Event Diagram template should not be used to model Machines States. The State Machine Diagram template should be used to model these types of diagrams instead. The State Event Diagram offers a view of a system which is complimentary to those presented by for example, Use Case Diagrams Communication Diagrams, Component diagrams and Sequence Diagrams.

Properties and metadata: The State Event Diagram template ­­­­can for example retain the following information:

  • A description of the diagram
  • Link to the owner of the diagram
  • Link to the one responsible for the diagram
  • Audits (auto generated information regarding its current state and access rights)
  • Associated documents, diagrams and other objects
  • Inherent Risk detailing risk considerations
  • Governance information detailing information about the published diagram and who has been involved in the approval of the diagram

The above picture shows the properties dialogue window for the State Event Diagram template, where you can view and edit the diagram’s properties in QualiWare Lifecycle Manager.

Report Layout

Purpose: The purpose of the Report Layout is to provide the layout of a report for the system developed in the Dialog Model.

Core concerns: The Report Layout template enables you to model Report Pages and Report Fields which can be related by connections.

Relation to other templates: The Report Layout is a QualiWare system template and is related to the Dialog Model, Dialog Layout, Menu Layout and Help Model.

Properties and metadata: The Report Layout template ­­­­can for example retain the following information:

  • A description of the diagram
  • Audits (auto generated information regarding its current state and access rights)
  • Associated documents, diagrams and other objects
  • Inherent Risk detailing risk considerations
  • Governance information detailing information about the published diagram and who has been involved in the approval of the Report Layout template

The above picture shows the properties dialogue window for the Report Layout template where you can view and edit its properties in QualiWare Lifecycle Manager.

Object Diagram

Purpose: The purpose of the Object Diagram is to document an instance of a class diagram accounting for objects and attributes at a specific point in time. An object diagram may be considered a special case of a Class Diagram.

Core concerns: The Object Diagram enables you to model Packages, Classes, Interfaces, Data Types, Enumerations, Primitive Types, Instance Specifications and Annotations. These elements can then be connected by Associations, Generalizations, Dependencies, Interface Realizations and Usage.

The Object Diagram template should be used to document specific objects of interest in a predefined scenario. This makes Object Diagrams especially useful for documenting examples or test cases for Class Diagrams.

Below, you can see an example of an Object Diagram for a Car Rental Agreement, where specific requirements for the car must be met:

Relation to other templates: The Object Diagram is part of the UML templates QualiWare supports along with the Activity Diagram, Communication Diagram, Deployment Diagram, Class Diagram, Composite Structure Diagram, State Diagram, Package Diagram, Component Diagram, Sequence Diagram, Use case diagram, Timing Diagram, Composite structure Diagram

Properties and metadata: The Object Diagram template ­­­­can for example retain the following information:

  • A description of the diagram
  • Link to the owner of the diagram
  • Link to the one responsible for the diagram
  • Extensions (Stereotypes, Constraints, Tagged values)
  • Audits (auto generated information regarding its current state and access rights)
  • Associated documents, diagrams and other objects
  • Inherent Risk detailing risk considerations
  • Governance information detailing information about the published diagram and who has been involved in the approval of the diagram

The above picture shows the properties dialogue window for the Object Diagram template, where you can view and edit the diagram’s properties in QualiWare Lifecycle Manager.

For more information: about the UML, please visit the Object Management Group’s Website, where you can find the complete specification. The Object Diagram is described in version 1.4.

Lifecycle Assessment Diagram

Purpose: The purpose of the Life Cycle Assessment Diagram template is to document the relations for an activity or product in a lifecycle context.

Core concerns: The Lifecycle Assessment Diagram concerns itself with modelling elements in a company that interact with the environment. The template enables you to model Environmental Aspects and Objectives for Activities in your organization. This template allows you to model Business Objects, Activities, Performance Indicators, Business Connection, Goals, Policies, Critical Success Factors, Change Requests and Problems. These elements can be grouped into Categories and connected by Impact Quantity, Recycling, Logistical Flows, Information Flows, and Activity Paths.

Below, you can see an example of a Lifecycle Assessment Diagram for a Product, from production to packaging, focusing on reducing unbiodegradable waste:

The elements used in this example are Business Objects as input and output, Activities showing Logistical Flows and Recycle under Process. Under the Environment Category, Environmental Aspects, Impact and Objectives are identified and Policies for reaching the Objectives are also included. The diagram focus on a single Environmental impact: Waste. You can also choose to map out several Environmental impacts that are relevant to a specific activity or product.

Relation to other templates: The Environmental Aspects and Impacts from the Lifecycle Assessment Diagram can be further explored in the Environmental Impact Diagram. The Lifecycle Assessment Diagram is also related to the Business Process Diagram and Workflow Diagram, in the sense that they all are related to detailing aspects of processes. The Lifecycle Assessment Diagram can also be decomposed from the Inventory object shown in, for example, the Production Site template.

Properties and metadata: The Lifecycle Assessment Diagram template ­­­­can for example retain the following information:

  • A description of the diagram
  • Link to the owner of the diagram
  • Link to the one responsible for the diagram
  • Audits (auto generated information regarding its current state and access rights)
  • Associated documents, diagrams and other objects
  • Inherent Risk detailing risk considerations
  • Governance information detailing information about the published diagram and who has been involved in the approval of the diagram

The above picture shows the properties dialogue window for the Lifecycle Assessment Diagram template, where you can view and edit the diagram’s properties in QualiWare Lifecycle Manager.

For more information: You can learn more about Lifecycle Assessment on the US Sustainable Facilities Tool website or turn to ISO standard 14040.

Freehand Diagram

Purpose: The purpose of the Free Hand Diagram template is to document using drawings that do not match any of the other structured diagram templates.

Core concerns: The Freehand Diagram template enables you to, for example, insert a General Concept, paste a picture file on it and describe it using Freehand symbols. You can also link to other diagrams from it. The Freehand symbols used can be placed either on or behind the Picture you choose and present information or links when clicked on.

Objects available in the Freehand Diagram template:

The Free Hand Diagram template should not be used to document any information that can be documented in other templates.

Below, you can see two examples of Freehand Diagrams, where the Freehand Objects are made visible:

FreeHandDiagram_1

FreeHandDiagram_2

Relation to other templates: The Freehand Diagram can, because of its flexibility, be related to any of QualiWare’s diagram templates. It can be a decomposition of Logistical Flows, Business Functions, Lines of Buisness, Business Scopes, Activities, Inventory and Information Systems.

Properties and metadata: The Freehand Diagram template ­­­­can for example retain the following information:

  • A description of the diagram
  • Link to the owner of the diagram
  • Link to the one responsible for the diagram
  • Audits (auto generated information regarding its current state and access rights)
  • Associated documents, diagrams and other objects
  • Inherent Risk detailing risk considerations
  • Governance information detailing information about the published diagram and who has been involved in the approval of the diagram

The above picture shows the properties dialogue window for the Freehand Diagram template, where you can view and edit the diagram’s properties in QualiWare Lifecycle Manager.

Firewall

Purpose: The purpose of the Firewall template is to document network zones designated by firewalls.

Core concerns: The Firewall template enables you to model Zones, Computers, Networks and Firewall Policies to create a model of a firewall. A firewall is used to control the communication between different networks, typically for security reasons.

Graphical representation of objects:

A Firewall diagram will typically show the Zones of the firewall and the communication policies/rules (Firewall Policies) that exist between the zones. Below, you can see an example of a Firewall diagram containing Zones and Servers (represented by the Computer object):

Firewall_1

Relation to other templates: The Firewall template is a technology template and related to the Infrastructure Diagram.

Properties and metadata: The Firewall template ­­­­can for example retain the following information:

  • A description of the diagram
  • Link to Vendor and Hardware
  • Link to servers
  • Contract information
  • Details about resources, costs and benefits
  • Audits (auto generated information regarding its current state and access rights)
  • Associated documents, diagrams and other objects
  • Inherent Risk detailing risk considerations
  • Governance information detailing information about the published diagram and who has been involved in the approval of the diagram


The above picture shows the properties dialogue window for the Firewall template, where you can view and edit the diagram’s properties in QualiWare Lifecycle Manager.

Environmental Impact Diagram

Purpose: The purpose of the Environmental Impact Diagram template is to document the environmental aspects and impacts for an Activity or Business Process.

Core concerns: The Environmental Impact Diagram enables you to model Business Functions, Activities, Business Objects, Environmental Aspects (Environmental Aspect, Environmental Impact, Health and safety impact) and Business Scopes. These elements can then be connected by Impact Quantities.

Below, you can see an example of an Environmental Impact Diagram, detailing the Environmental aspects and Health and safety impact:

EnvironmentalImpactDiagram_1

The diagram shows all identified aspects and modes of impact for one or more specific processes.

Relation to other templates: The Environmental Impact Diagram is related to the Lifecycle Assessment diagram as well as templates containing Activities, Business Functions, Lines of Business, and Logistical Flows. As such, it is related to, for example, Business Process Diagrams, Workflow Diagrams, Business Diagrams, and Strategy Models.

Properties and metadata: The Environmental Impact Diagram template ­­­­can for example retain the following information:

  • A description of the diagram
  • Link to the owner
  • Link to the responsible
  • Audits (auto generated information regarding its current state and access rights)
  • Associated documents, diagrams and other objects
  • Inherent Risk detailing risk considerations
  • Governance information detailing information about the published diagram and who has been involved in the approval of the diagram

The above picture shows the properties dialogue window for the Environmental Impact Diagram, where you can view and edit the diagram’s properties in QualiWare Lifecycle Manager.

Data Replication Diagram

Purpose: The purpose of the Data Replication Diagram template is to map a high-level view of the movement and replication of information between data sources.

Core concerns: The Data Replication Diagram template enables you to map Data Sources, Data Files, Data Transformations and Data Warehouses. These elements can then be connected by either a Data Extract or a Data Apply.

Graphical representation of the elements:

Below, is an example of a Data Replication Diagram for a commercial Data Warehouse:

DataReplicationDiagram_1

The model shows that the data is extracted from different data sources, transformed and applied to the Data Warehouse from which it is extracted, aggregated and either applied to sales, production or improvement.

Relation to other templates: The Data Replication Diagram offers a high-level data mapping. The Data Transformations contained in the Data Replication Diagram can be further decomposed into more detailed Data Mapping Diagrams.

Properties and metadata: The Data Replication Diagram template ­­­­can for example retain the following information:

  • A description of the diagram
  • Audits (auto generated information regarding its current state and access rights)
  • Associated documents, diagrams and other objects
  • Inherent Risk detailing risk considerations
  • Governance information detailing information about the published diagram and who has been involved in the approval it

The above picture shows the properties dialogue window for the Data Replication Diagram, where you can view and edit the diagram’s properties in QualiWare Lifecycle Manager.


Data Flow Diagram

Purpose: The purpose of the Data Flow Diagram is to document a system’s or part of a system’s data flows; the data input the system (or a process within the system) consumes and the data output the system produces.

Core concerns: The Data Flow Diagram enables you to model Processes, Data Stores, External Entities, Control Processes and Control Stores. These elements can then be connected by either Data Flows or Control Flows.

Graphical representation of the elements:

The Data Flow Diagram can show different levels of processes within a system that exchange data, and illustrate how those exchanges occur. As such, the model can document a system’s functional hierarchies.

Below, you can see an example of a Data Flow Diagram showing the Data Flows between several Data Stores, Processes and External Entities in a Bookshop:

DataFlowDiagram_2

The next example shows the Data Flow between process, Data Stores and External Entities for a Highway Repair Service:

DataFlowDiagram_1

The final example shows the Data Flows between Processes, Datastores and External Entities in an Outlook Mailbox:

dfd

Relation to other templates: The Processes in the Data Flow Diagram can be decomposed into more detailed Data Flow Diagrams to comprise the total functional model. The top level of a Data Flow Diagram is sometimes called a Context Diagram. However, in QLM we use the Data Flow Diagram template for the higher levels as well as the more detailed ones.

The Data Flow Diagram can be a decomposition of an Information System. It can offer a more detailed view of Data Flows than, for example, the Application Architecture Diagram.

An Information System could likewise be decomposed into a Business Process Diagram which offers a complimentary view less concerned with Data Stores and Data Flow, and more concerned with Activity Flow.

Properties and metadata: The Data Flow Diagram template ­­­­can for example retain the following information:

  • A description of the diagram
  • Link to the owner of the diagram
  • Link to the one responsible for diagram
  • Audits (auto generated information regarding its current state and access rights)
  • Associated documents, diagrams and other objects
  • Inherent Risk detailing risk considerations
  • Governance information detailing information about the published diagram and who has been involved in the approval of the diagram

The above picture shows the properties dialogue window for the Data Flow Diagram template, where you can view and edit the diagram’s properties in QualiWare Lifecycle Manager.