Purpose: The purpose of the Performance Diagram is to provide a view over an organization’s performance in reaching their strategic goals.
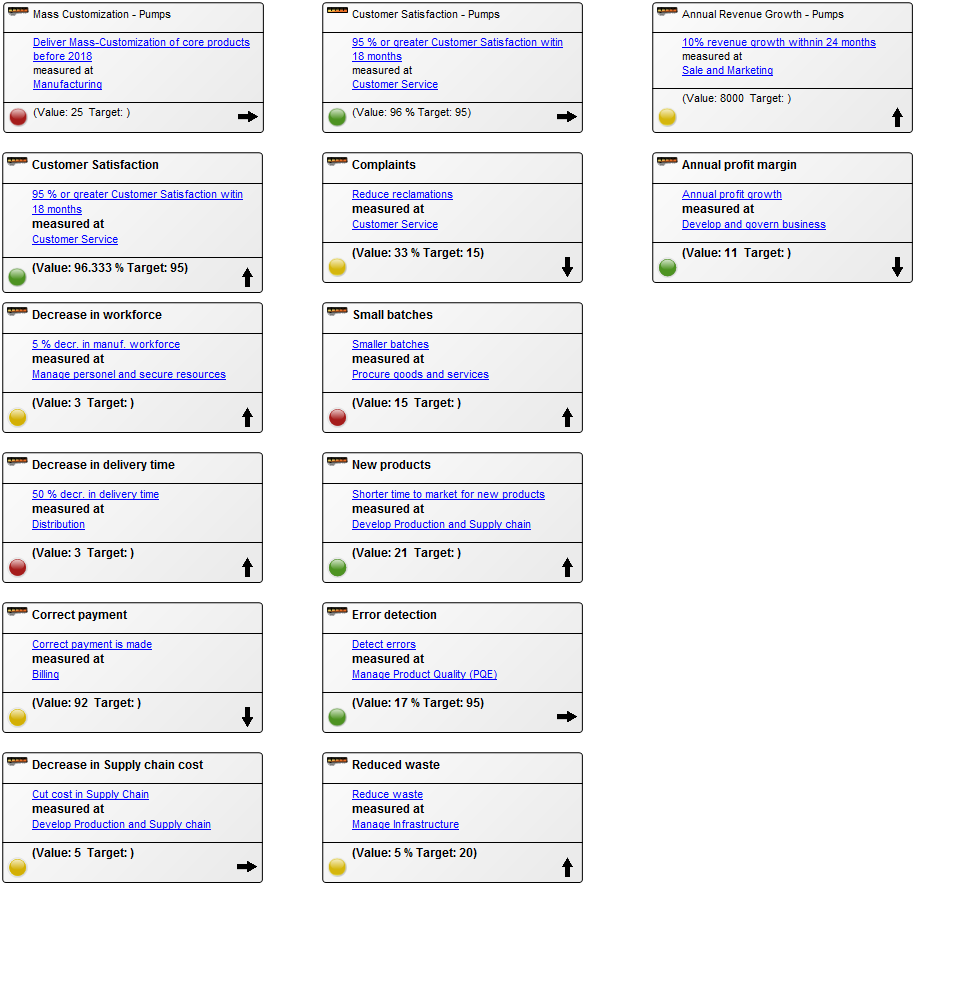
Core concerns: The Performance Diagram enables you to model Key Performance Indicators – which can be related to strategic goals, derivative Performance Indicators and Derivation Rules. You can create a Performance Diagram as a decomposition of a Key Performance Indicator and model a hierarchy of performance diagrams. The model below shows an overview of an organizations Key Performance Indicators and their status:
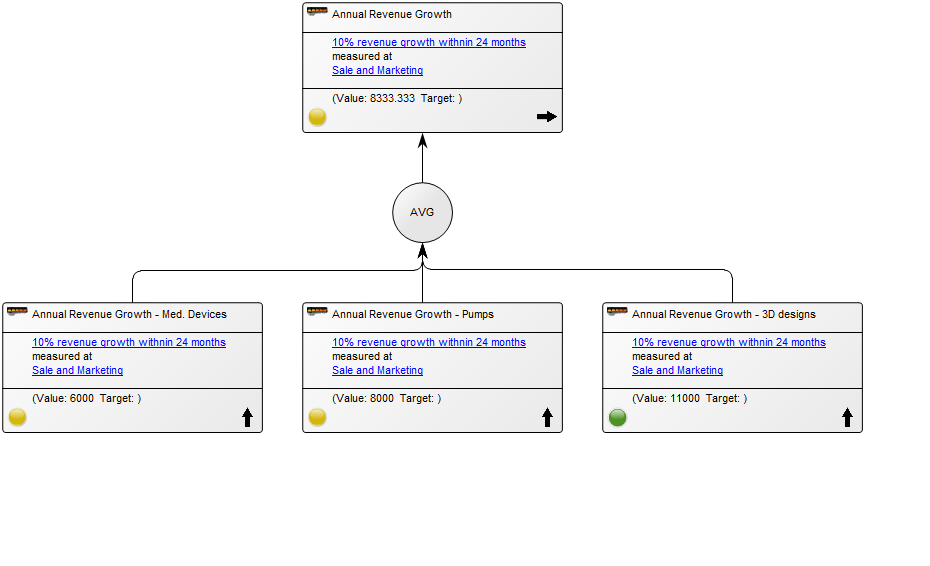
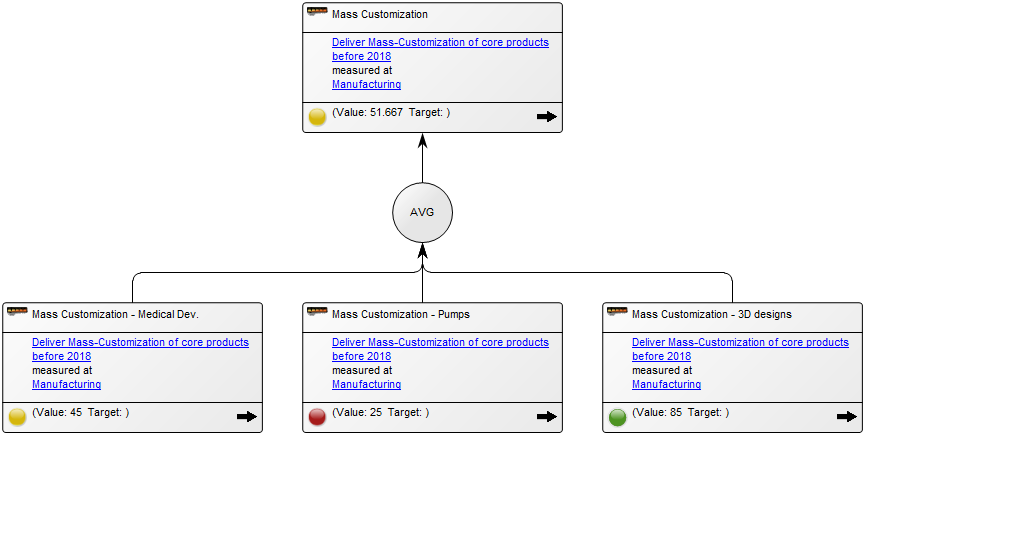
In the following model the Key Performance Indicator has been enriched with derivative performance indicators explaining in more details the status of the performance and how it is measured:
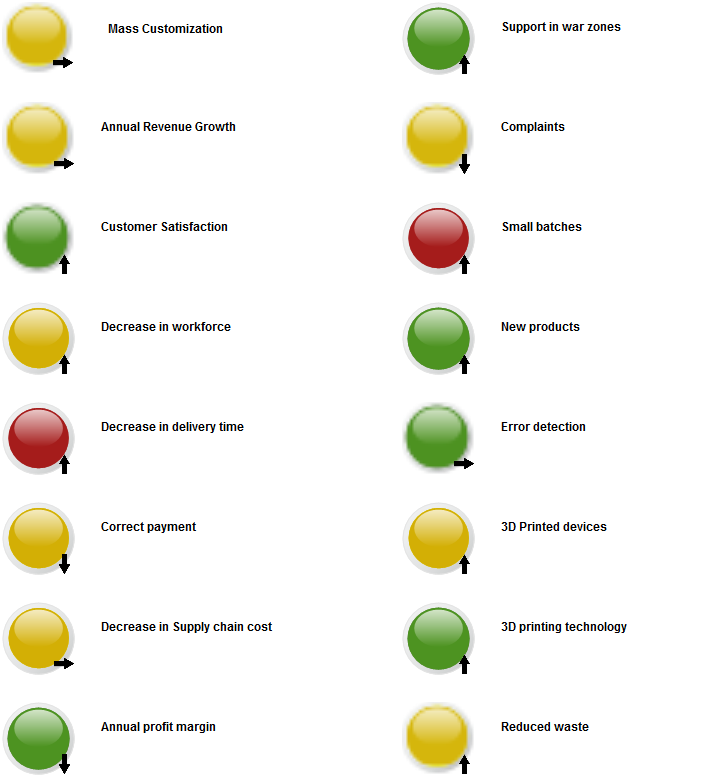
The overview of the Key Performance Indicators can also be presented with a simplistic view, highlighting their status using color coded icons:
Relation to other templates: The Performance Diagram is a Strategic template and can be decomposed from Key Performance indicators contained in, for example, a Balanced Scorecard Diagram or Dashboard.
Properties and metadata: The Performance Diagram can for example retain the following information:
A description of the diagram
Link to the owner of the diagram
Link to the one responsible for the diagram
Audits (auto generated information regarding its current state and access rights)
Associated documents, diagrams and other objects
Inherent Risk detailing risk considerations
Governance information detailing information about the published diagram and who has been involved in the approval of the diagram
The above picture shows the properties dialogue window for the Performance Diagram where you can view and edit the diagram’s properties in QualiWare Lifecycle Manager.
Purpose: The purpose of the Product Canvas template is to present the relevant information related to a specific product.
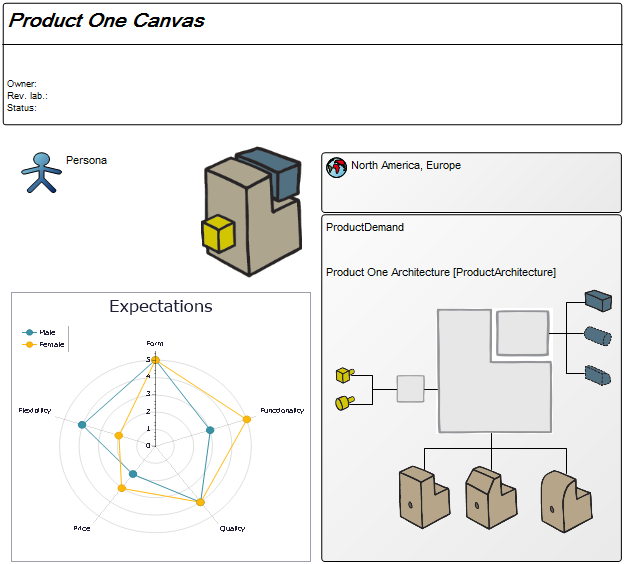
Core concerns: The Product Canvas template enables you to gather relevant Business Charts and model Personae, Product Demands, Markets, Locations and Products. Additionally, you can model a SWOT analysis that details the Strengths, Weaknesses, Opportunities and Threats the product is affected by.
Below, you can see two Product Canvases. The first has its focus on a product within two markets, showing the expectations two different customer segments have to the product.
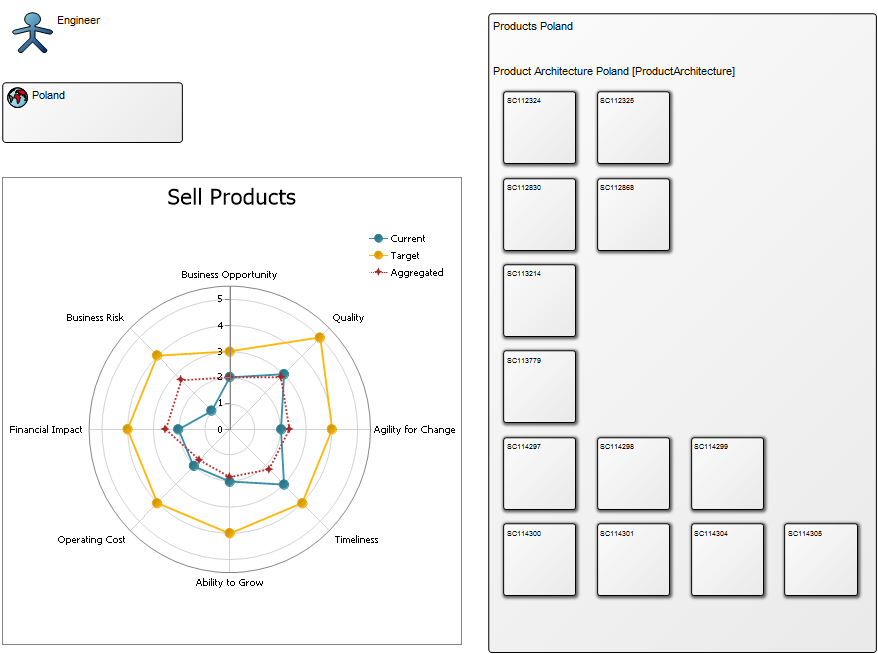
The second example shows information related to a specific market, Poland, including product architecture and business assessment:
Relation to other templates:
The Product Canvas Template is inherently related to the Product Architecture, Product Roadmap and Product Variant Master, in the sense that all these models focus on different aspects of the lifecycle of a product. Furthermore, you can create additional Business Charts for the Product Canvas by using the dedicated template. Another view on projects and initiatives are provided from the Enterprise Investment Portfolio. There, the reasoning behind the investment in the project is visualized by connecting the initiative (in this case a new product) to the specific goals of the enterprise that it contributes to. Another view on how the product meets customer needs can be documented in the Value Proposition Canvas.
Properties and metadata: The Product Canvas can for example retain the following information:
A description of the diagram
Link to the owner of the canvas
Link to the one responsible for the canvas
Audits (auto generated information regarding its current state and access rights)
Associated documents, diagrams and other objects
Inherent Risk detailing risk considerations
Governance information detailing information about the published diagram and who has been involved in the approval of the diagram
The above picture shows the properties dialogue window for the Product Canvas where you can view and edit the diagram’s properties in QualiWare Lifecycle Manager.
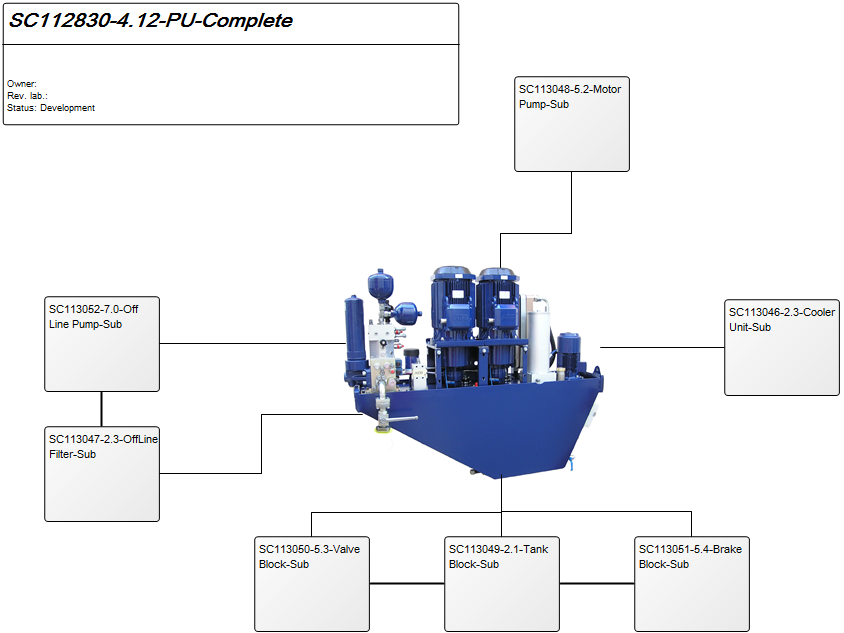
Purpose: The purpose of the Product Architecture template is to document the building blocks of a product. Below is an example of a product architecture:
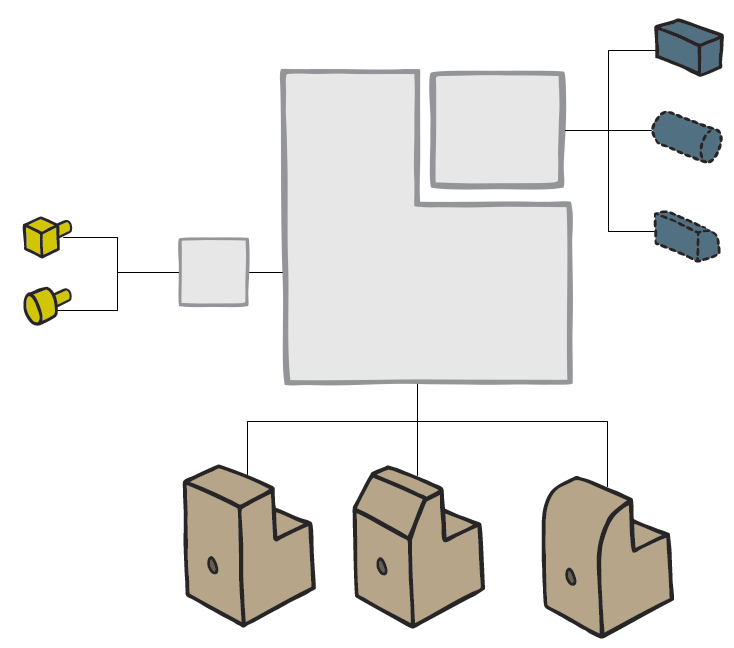
Core concerns: The Product Architecture template enables you to model a Product and connect different parts of it with three different connection types: Part of Product, Kind of Product, and Product Interface. See below for an example of a Product Architecture where each Product object is represented graphically:
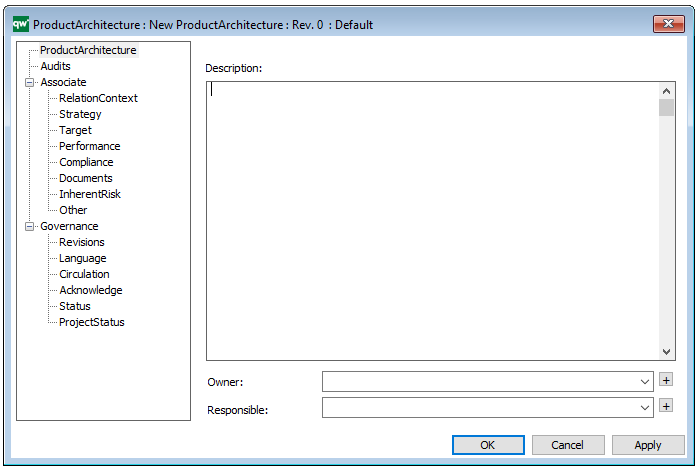
Properties and metadata: The Product Architecture can for example retain the following information:
A description of the diagram
Link to the owner of the diagram
Link to the one responsible for the accuracy of the diagram
Audits (auto generated information regarding its current state and access rights)
Associated documents, diagrams and other objects
Inherent Risk detailing risk considerations
Governance information detailing information about the published diagram and who has been involved in the approval of the diagram
Project status: information about budgeted and actual man-hours spent, percentage completed and the latest milestone, result and quality control of a change process.
In the picture below you can see the Product Architecture’s properties dialogue window, where the properties can be viewed and edited:
Purpose: The purpose of the Enterprise Investment Portfolio template is to model enterprise goals and investments.
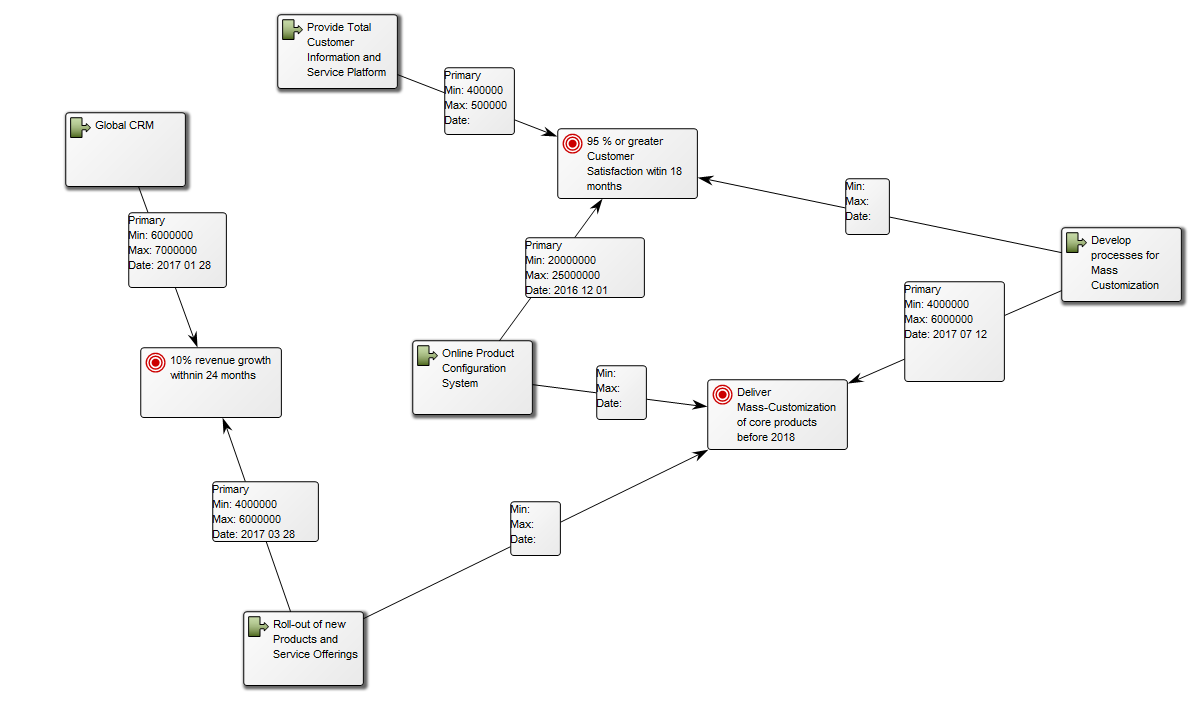
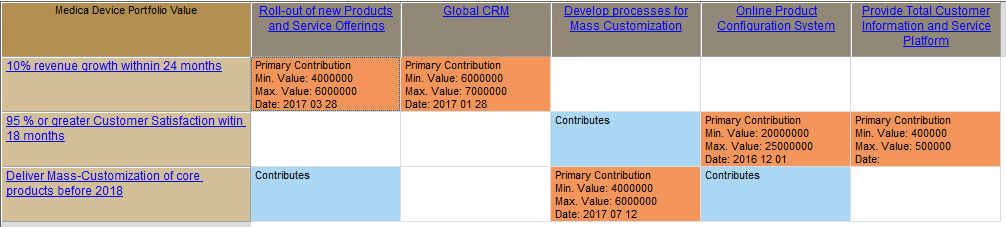
Core concerns: The Enterprise Investment Portfolio template enables you to model Goals, Projects, and Initiatives. The projects and initiatives can be connected to enterprise goals them through Project Contributions, that show the viable minimum and optimistic maximum of the value contribution. Below, you can see an example of an Enterprise Investment Portfolio, where the way goals are realized is visualized:
Other Functionalities: By using the Enterprise Investment Actions tab, you can create, for example, a Portfolio Value matrix, which offers another way to view the same data:
Relation to other templates: The Enterprise Investment Portfolio is a strategic template and is as such related to the enterprise’s Strategy Model, Strategic Roadmap, Business Canvas and Innovation Canvas. The projects contained in the initiatives can also be further described in the Work Model template.
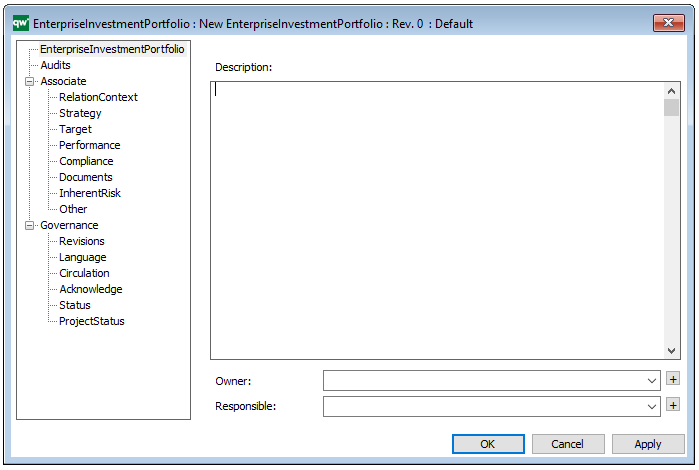
Properties and metadata: The Enterprise Investment Portfolio template can for example retain the following information:
A description of the diagram
Link to the owner of the diagram
Link to the one responsible for the diagram
Audits (auto generated information regarding its current state and access rights)
Associated documents, diagrams and other objects
Inherent Risk detailing risk considerations
Governance information detailing information about the published diagram and who has been involved in the approval of the diagram
The above picture shows the properties dialogue window for the Enterprise Investment Portfolio template, where you can view and edit the diagram’s Properties in QualiWare Lifecycle Manager.
For more information: This model type is used in the Enterprise Investment Methodology developed by Chris Potts and QualiWare. To learn more about Enterprise Investment, you can about it here:Enterprise Investment.
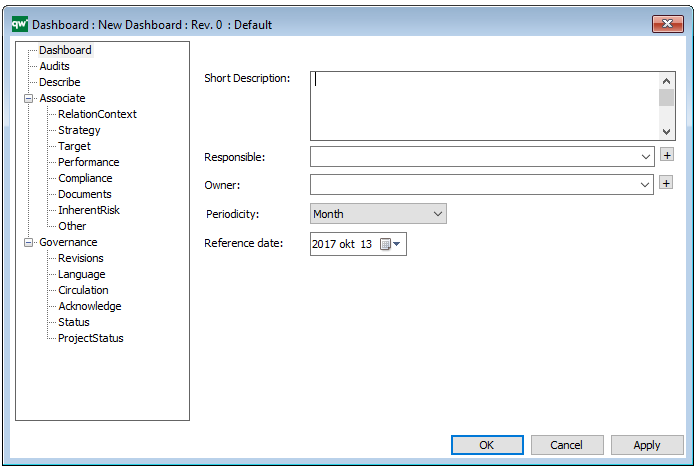
Purpose: The purpose of the Dashboard template is to publish selections of Business Charts targeting different stakeholders. It should be used to gather a series of relevant or connected Business Charts to provide a dashboard-like overview.
Core concerns: The Dashboard template enables you to gather Business Charts, Key Performance Indicators, Performance Indicators and General Concepts to create stakeholder specific views of analyzed data. For example, an Enterprise Architect could find a Dashboard containing Business Charts relevant to the usage and governance of the Enterprise Architecture useful.
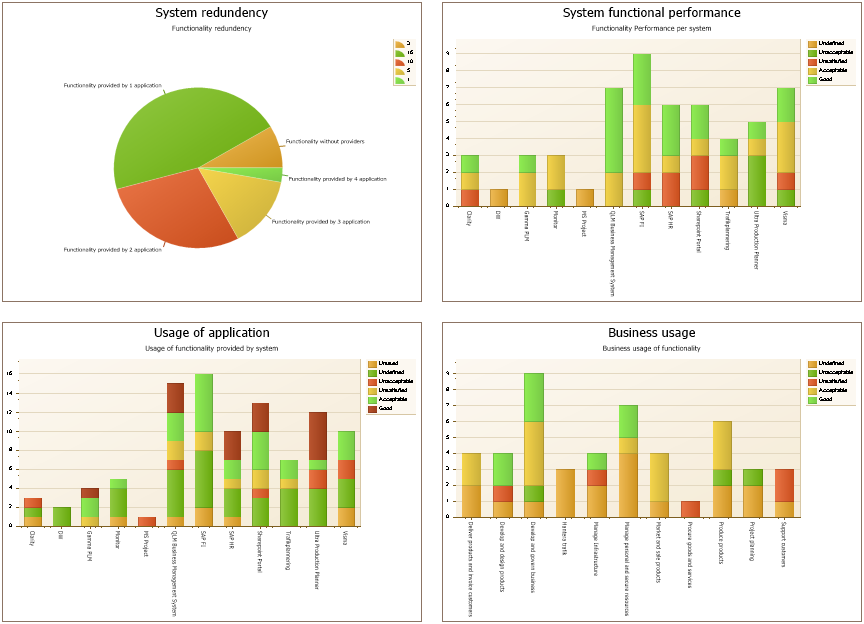
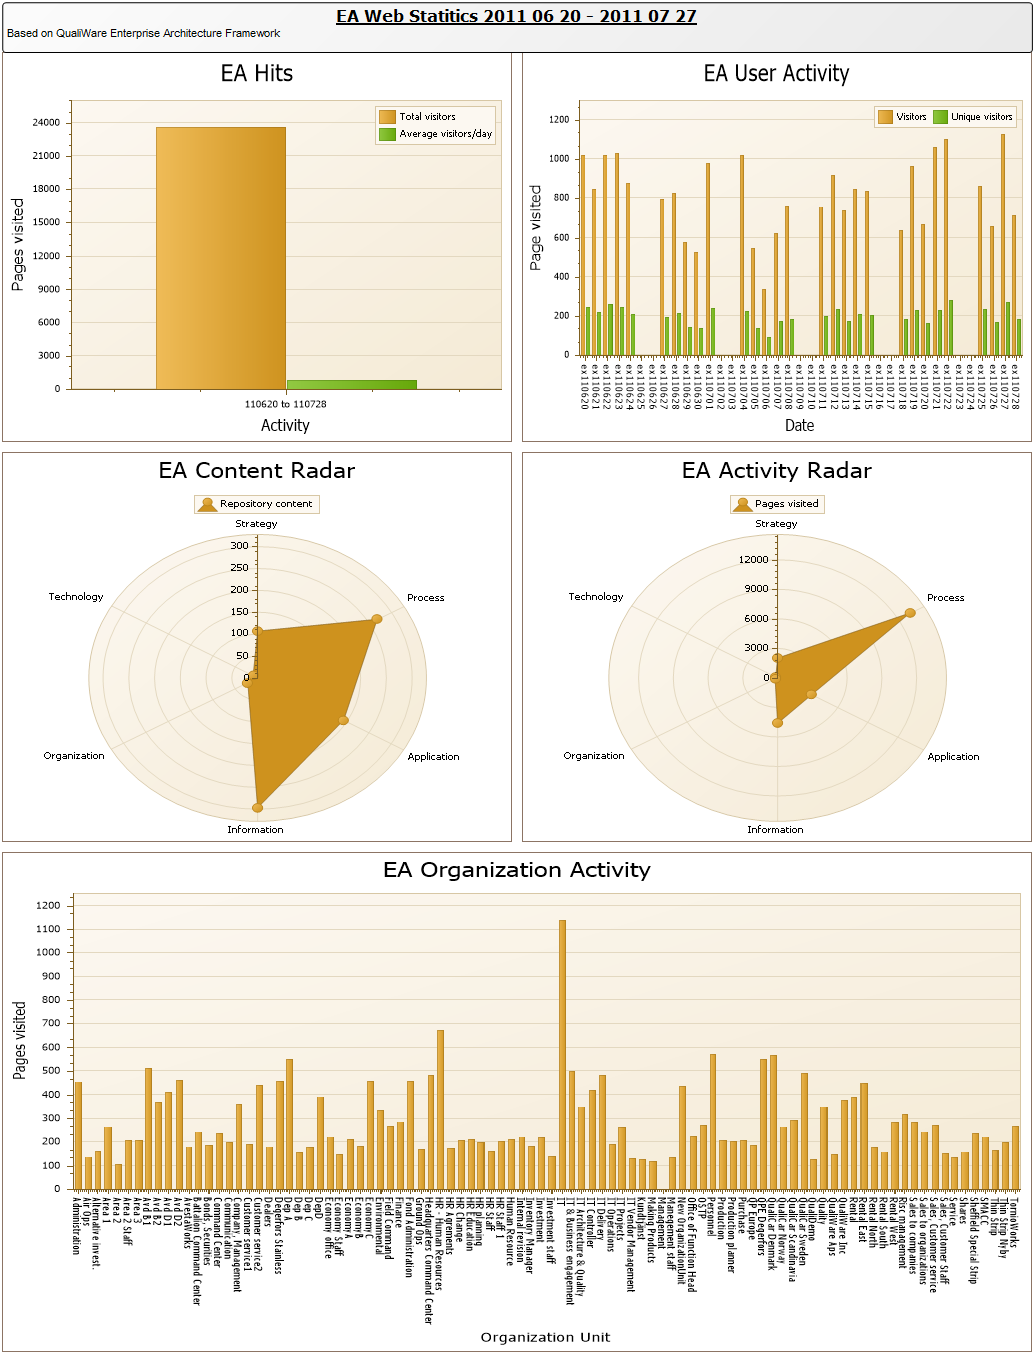
Below, you can see examples of different Dashboards presenting an array of Business Charts:
Relation to other templates: The Dashboard template is closely connected to the Business Chart template, as the Dashboard publishes the charts the Business Chart template generates.
Properties and metadata: The Dashboard can for example retain the following information:
A description of the Dashboard
Link to the owner of the Dashboard
Link to the one responsible for the Dashboard
Audits (auto generated information regarding its current state and access rights)
Associated documents, diagrams and other objects
Inherent Risk detailing risk considerations
Governance information detailing information about the published diagram and who has been involved in the approval of the diagram
The above picture shows the properties dialogue window for the Dashboard template where you can view and edit the dashboard’s properties in QualiWare Lifecycle Manager.
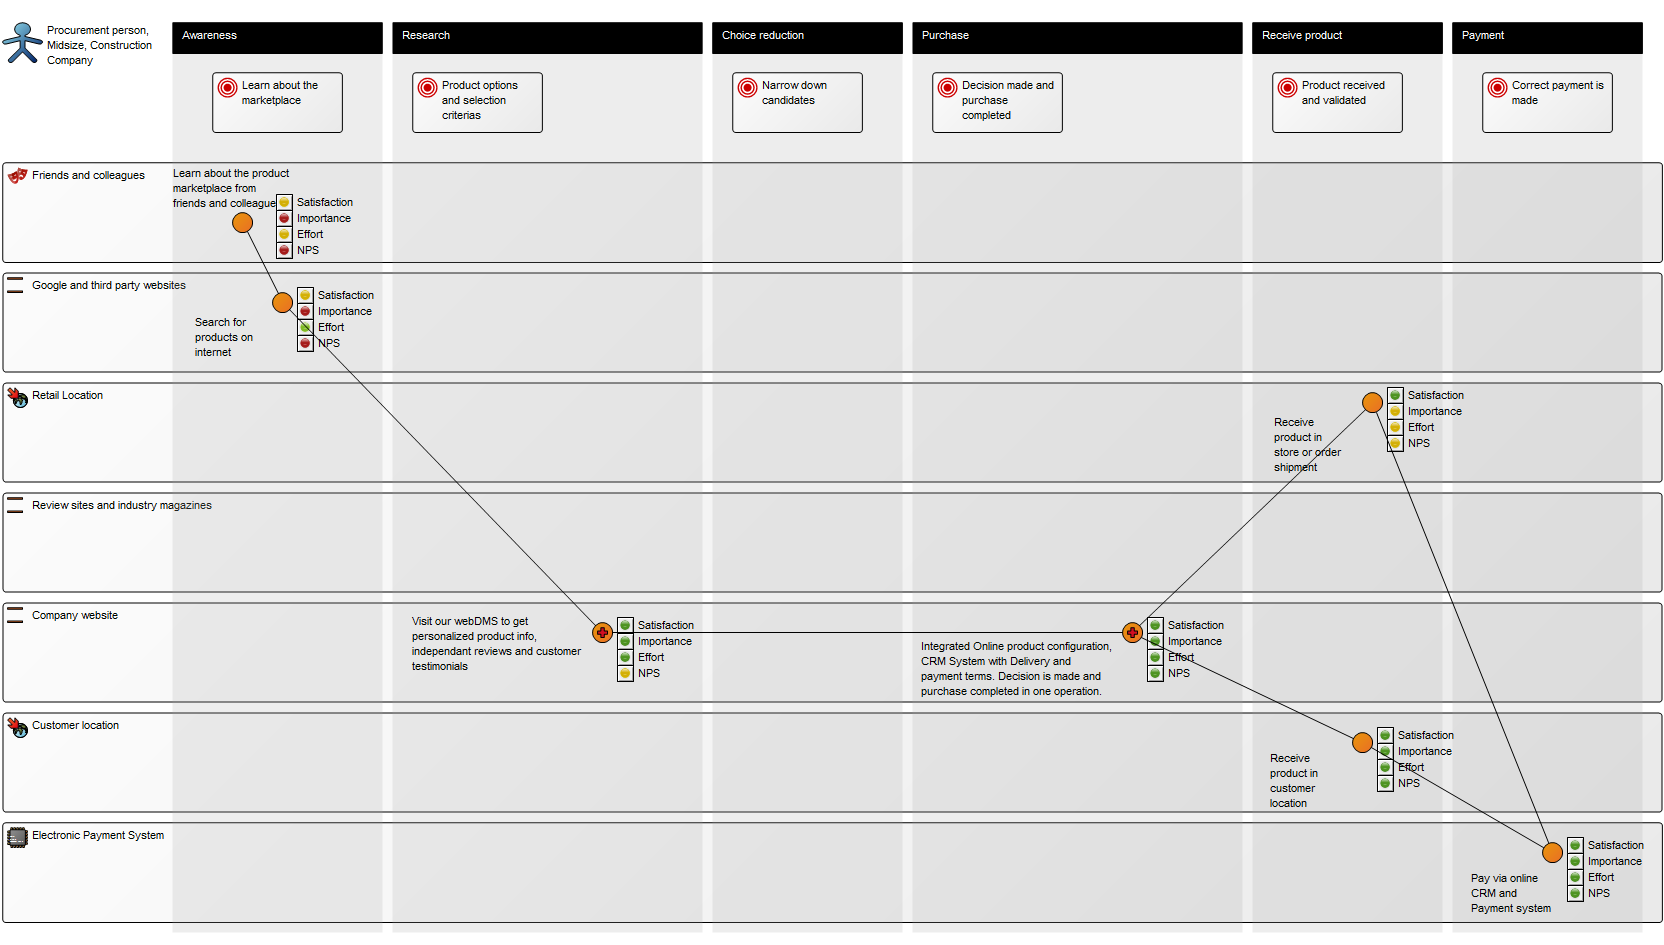
Purpose: The Purpose of the Customer Journey Map template is to document the customer’s journey from awareness to the end of their interaction with an organization, covering possible touch points from the customer’s perspective.
Core Concerns: The Customer Journey Map template allows you to model connections between different Personas, Customer Journey Phases, Touch Points, Goals, Roles, Locations, Channels, Technology and the aspects from a SWOT analysis.
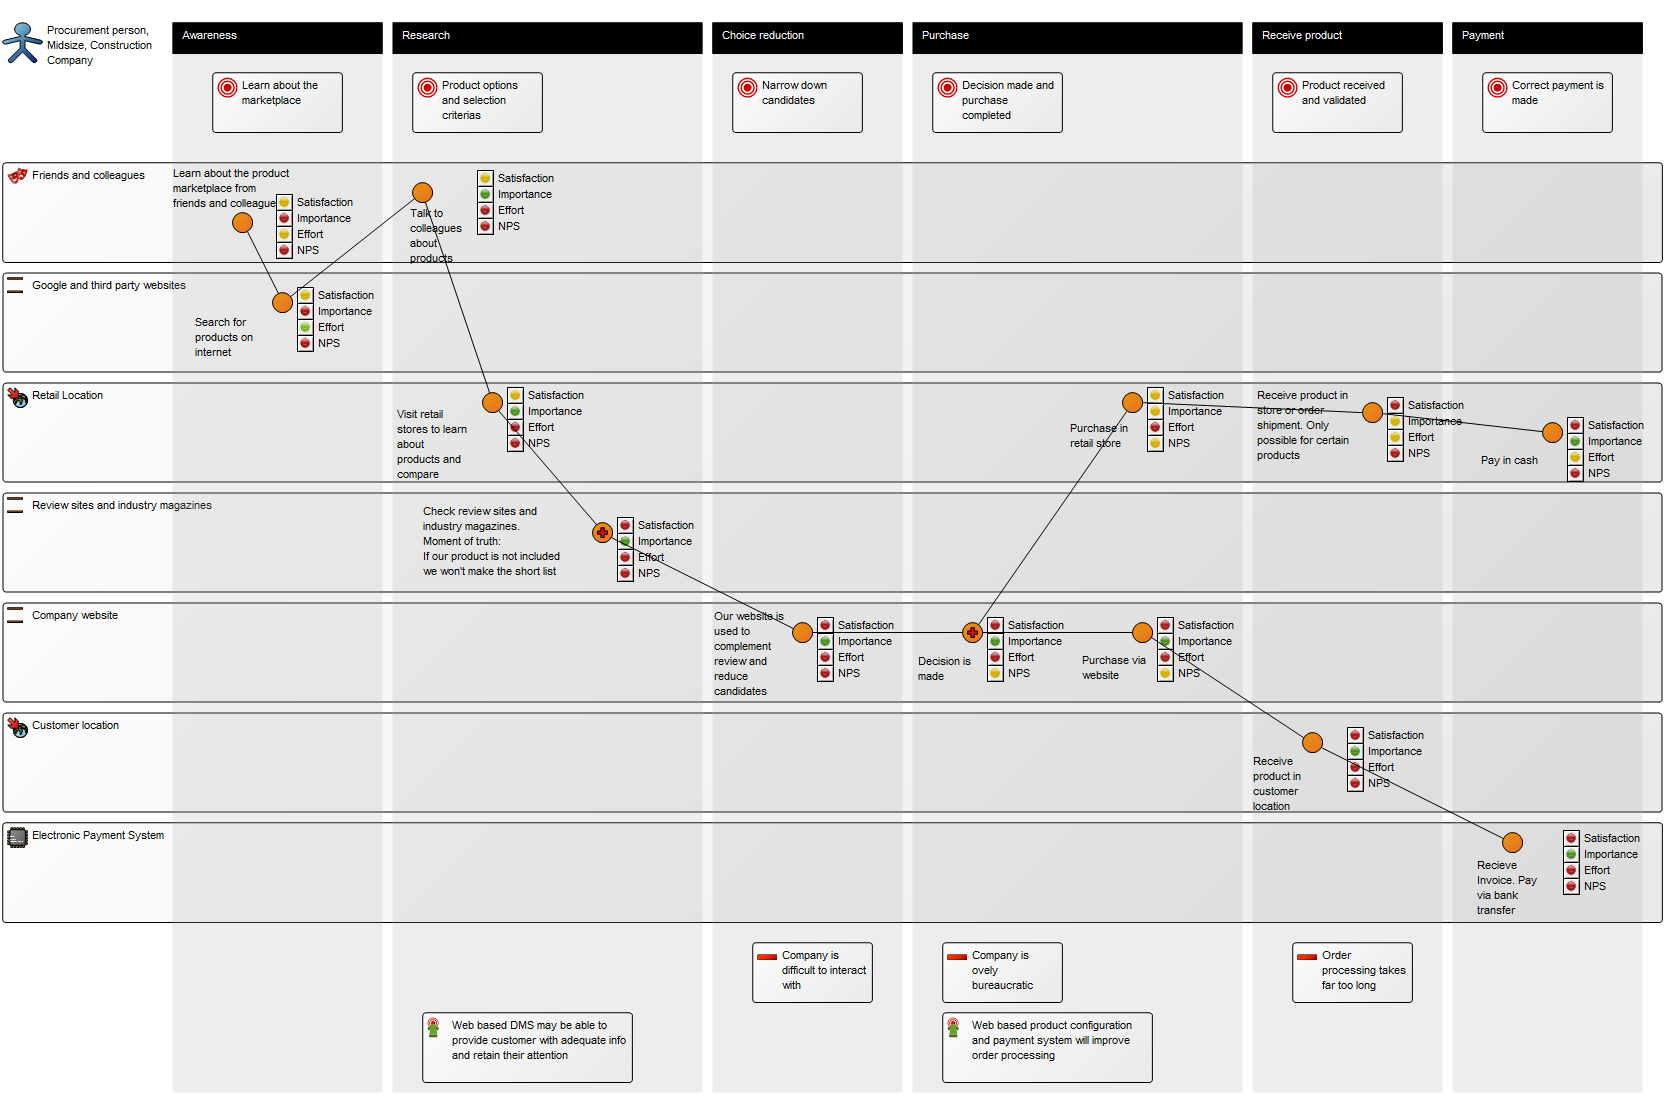
You can choose to model both a current state and a desired future state of the customer journey and use the documentation for process improvement. Below is an example of a current state model and a future state model:
Current state model:
Desired future model:
Other functionalities: The customer’s touchpoints can be elaborated upon with four scores for Customer Satisfaction, Customer Importance, Customer Effort and Net Promoter Score. Particularly vital touchpoints can be designated as a Moment of Truth.
Relation to other templates: The Customer Journey Map can be used as a groundwork for a strategic change, which for example can be modelled in a Work Model, a Business Capability Model and/or a Strategy Model.
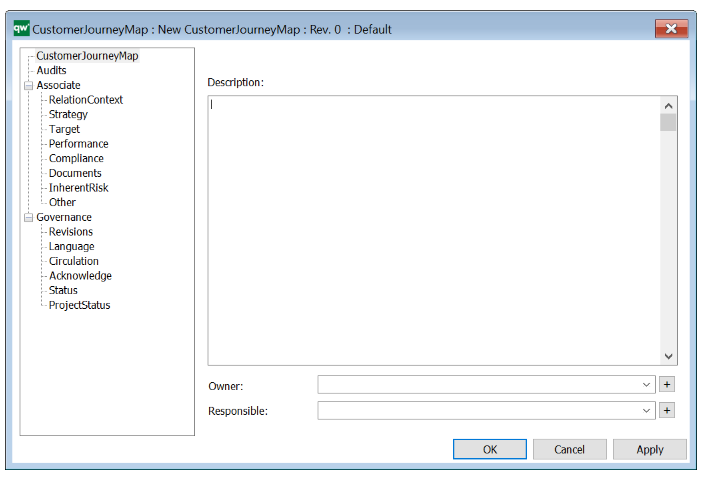
Properties and metadata: The Customer Journey Map can for example retain the following information:
A description of the diagram
Link to the owner of the diagram
Link to the one responsible for the accuracy of the diagram
Audits (auto generated information regarding its current state and access rights)
Associated documents, diagrams and other objects
Inherent Risk detailing risk considerations
Governance information detailing information about the published diagram and who has been involved in the approval of the diagram
Project status: information about budgeted and actual man-hours spent, percentage completed and the latest milestone, result and quality control of a change process.
The above picture shows the properties dialogue window for the Customer Journey Map, where you can view and edit the diagram’s properties.
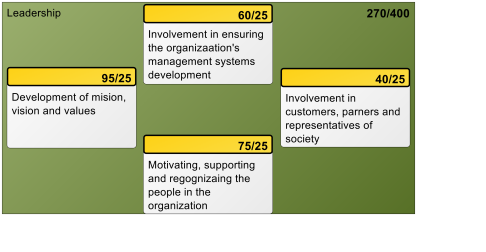
Purpose: The purpose of the Business Excellence Diagram template is to describe a measuring tool based on The European Foundation for Quality Management Excellence Model (EFQM).
Core concerns: The Business Excellence Diagram enables you to model Business Scopes, Criterion and Sub Criterion. These aspects can then be connected by Criterion Influencers.
Below, you can see an example of a Business Excellence Diagram for the Leadership of an organization. The diagram is structured according to the EFQM and shows the overall scores for the leaderships performance:
Other areas covered in the EFQM are Policy & Strategy, People, Partnerships & Resources, Processes, Customer Results, People Results, Society Results and Key Performance Indicators.
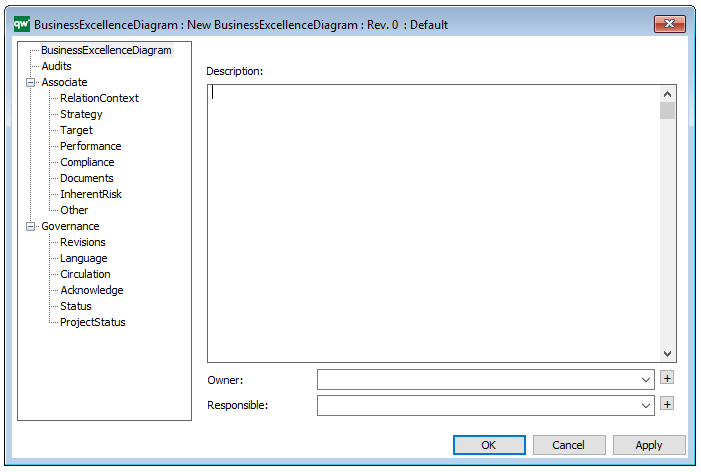
Properties and metadata: The Business Excellence Diagram can for example retain the following information:
A description of the diagram
Link to the owner of the diagram
Link to the one responsible for the diagram
Audits (auto generated information regarding its current state and access rights)
Associated documents, diagrams and other objects
Inherent Risk detailing risk considerations
Governance information detailing information about the published diagram and who has been involved in the approval of the diagram
The above picture shows the properties dialogue window for the Business Excellence Diagram template, where you can view and edit the diagram’s properties in QualiWare Lifecycle Manager.
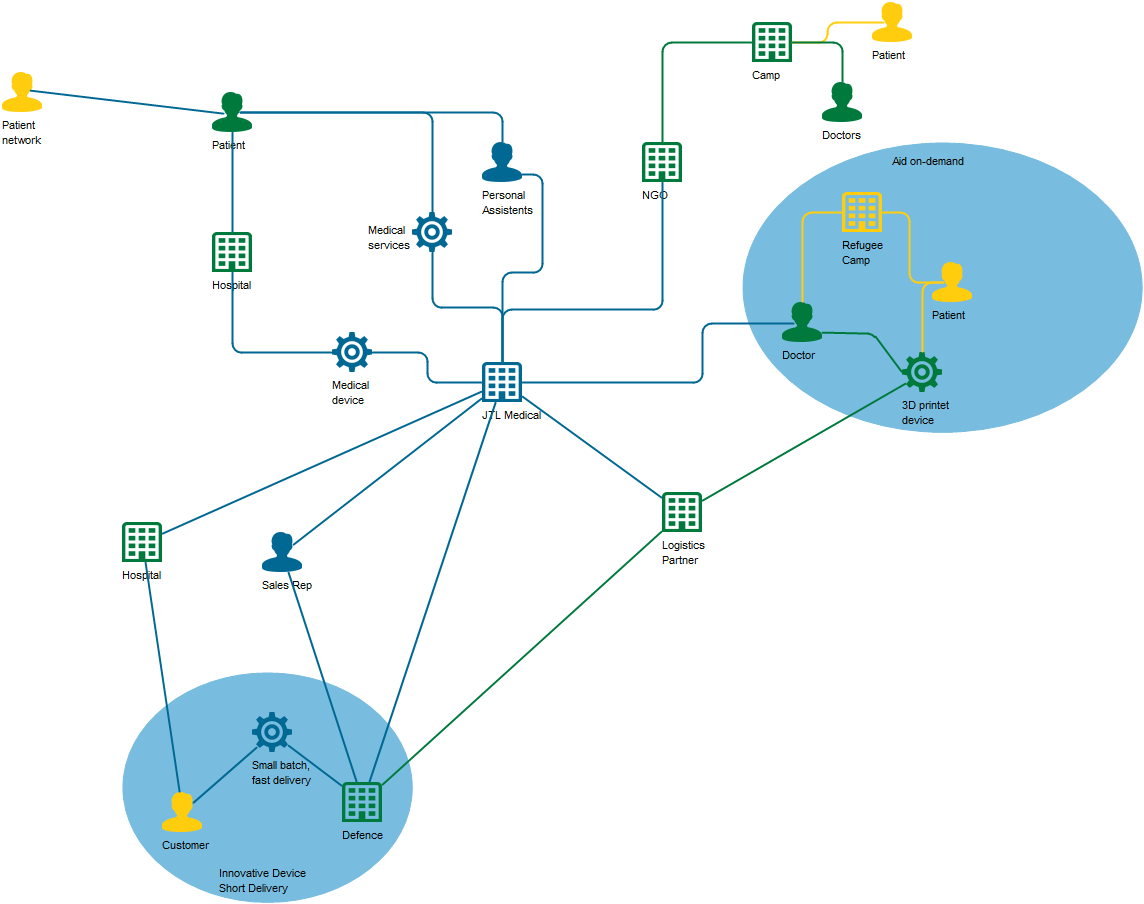
Purpose: The purpose of the Business Ecosystem template is to enable an organization to understand itself from an outside-out perspective by modelling the environment in which the organization is embedded.
Core concerns: The Business Ecosystem supplies five elements to model with: Business, People, Things, Business Interaction and Business Moment. The Business Ecosystem template should primarily be used for modeling entities outside the enterprise to identify new business opportunities in the form of Business Moments.
Above you can see a model of a Business Ecosystem. The blue areas are Business Moments, where the interactions between People, Businesses and Things create business opportunities for your enterprise.
Relation to other templates: The Business Ecosystem model is based on the Enterprise Design theories and is as such in the same family as the Customer journey map.
Properties and metadata: The Business Ecosystem can for example retain the following information:
A description of the diagram
Link to the owner of the application architecture
Link to the one responsible for the application architecture
Audits (auto generated information regarding its current state and access rights)
Associated documents, diagrams and other objects
Inherent Risk detailing risk considerations
Governance information detailing information about the published diagram and who has been involved in the approval of the diagram
Project status: information about budgeted and actual man-hours spent, percentage completed and the latest milestone, result and quality control of a change process.
For more information: If you want to learn more about Enterprise Design, we have a four-part webinar by Milan Guenther available for viewing. You can also visit Milan’s website, where you can learn more about the Enterprise Design framework.
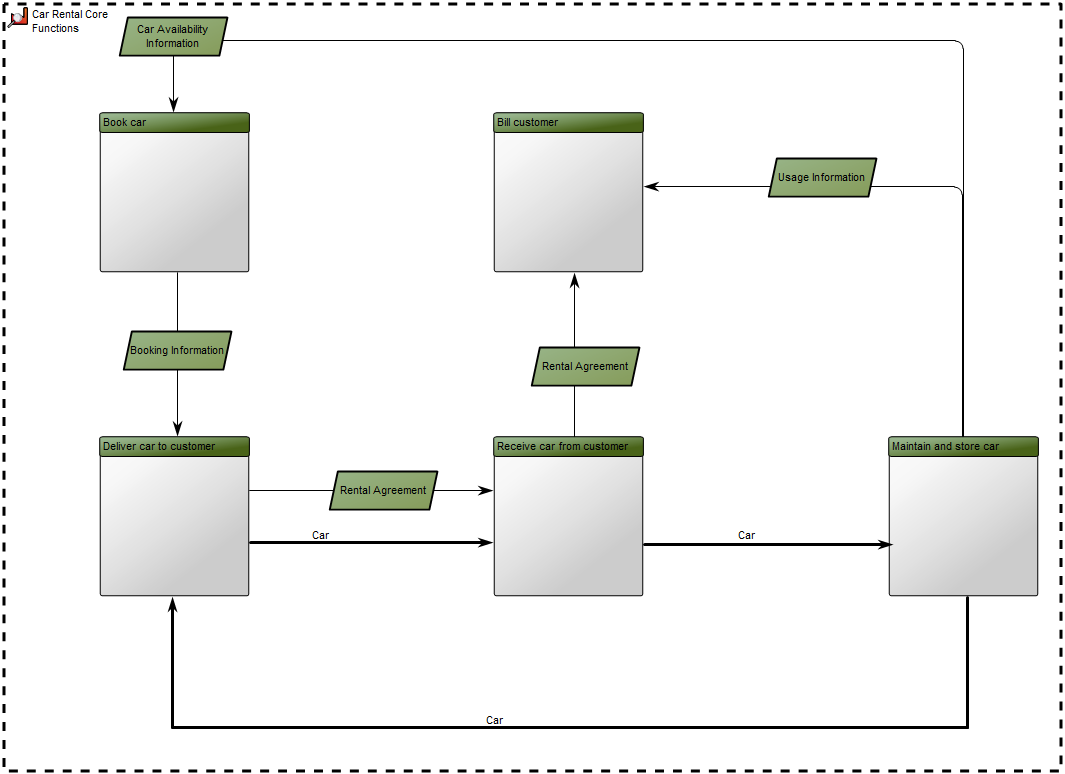
Purpose: The purpose of a Business Diagram is to show the functional structure and relationships of the whole or part of an organization.
Core concerns: The Business Diagram template enables you to model Business Functions, Information Systems, Inventory, Business Scope, Lines of Business, Information Flow and Logistical Flow. The diagram’s syntax can be extended to also include strategic elements such as Goals, Objectives, Stakeholders and Performance Indicators.
The Business Diagram should be broken down into several levels of recurring Business Diagram templates. In the model below, you can see an example of a high-level Business Diagram showing Business Functions and their Information Flows and Logistical Flows – describing the flow of products and services – in this case for a car rental service.
The Business Functions are placed with the operational functions in the bottom together with the Logistical Flow and with management control at the top of the Business Diagram.
On lower levels (decompositions) of Business Diagrams, Information Systems are placed close to the Business Functions that are responsible for or own the Information Systems.
Relation to other templates: The Business Diagram can be used as an addition to a Business Process Network and Strategy Models, giving a practical view of how the organizations functions fit together, illuminating interdependencies.
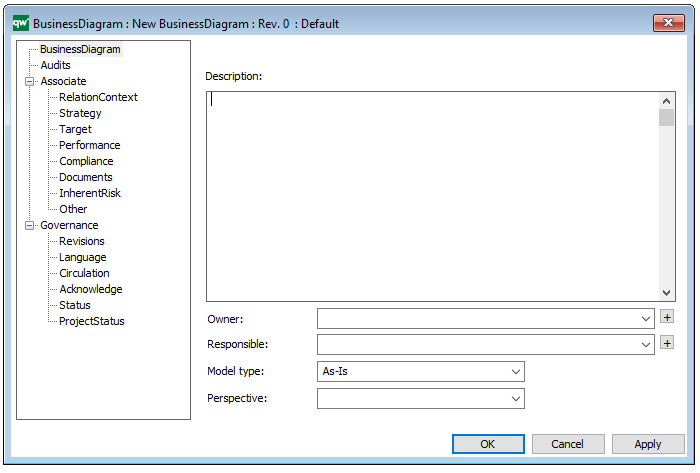
Properties and metadata: The Business Diagram can for example retain the following information:
A description of the diagram
Link to the owner of the Diagram
Link to the one responsible for the Diagram
Indication of the diagram portrays an as-is situation or a to-be situation
The Perspective can be defined as either: Holistic, Sub-functional, Process, or IT Focused.
Audits (auto generated information regarding its current state and access rights)
Associated documents, diagrams and other objects
Inherent Risk detailing risk considerations
Governance information detailing information about the published diagram and who has been involved in the approval of the diagram
The above picture shows the properties dialogue window for the Business Diagram where you can view and edit the diagram’s properties in QualiWare Lifecycle Manager.
Purpose: The purpose of the Business Capability Model template is to provide an overview of the of the state and health of an enterprise in the form of its Capabilities.
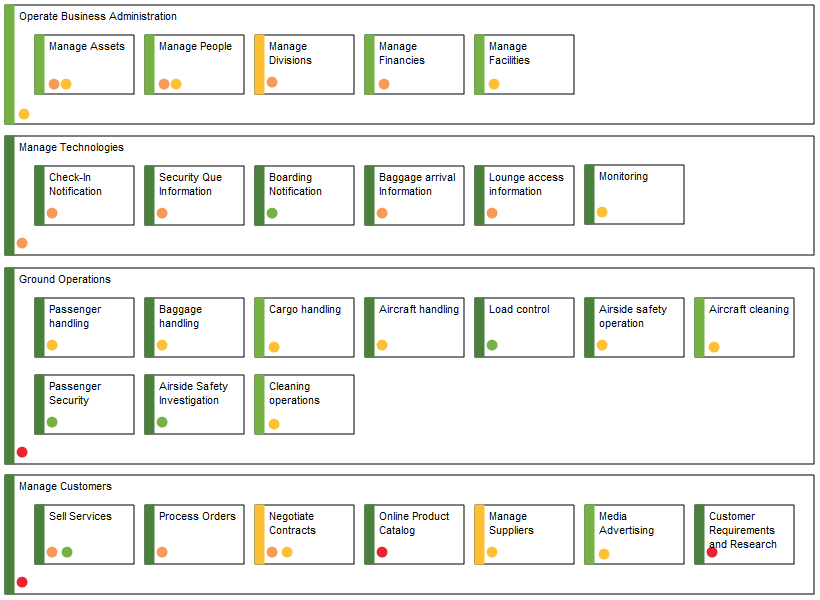
Core concerns: The Business Capability Model is a simple template that by default only allows for the modelling of Capabilities with the possibility to add notes if needed. The metadata of the Capabilities – such as status and importance can then be graphically displayed in the business capabilities to create a useful overview.
The stripe on the left side to represent Business Importance and two dots representing Business Maturity and Target Maturity. The new design scales better and provides management with a single view of important strategic capabilities with a plan for improvements. Also it allows the business architect to highlight a set of capabilities by coloring the symbol’s background – a widely used technique.
Business Capability model with new symbol design
In the picture above you can see an example of a Business Capability Model. Here the Business Capabilities are grouped in different areas and the status and importance of them are shown by their green, yellow or red colorings.
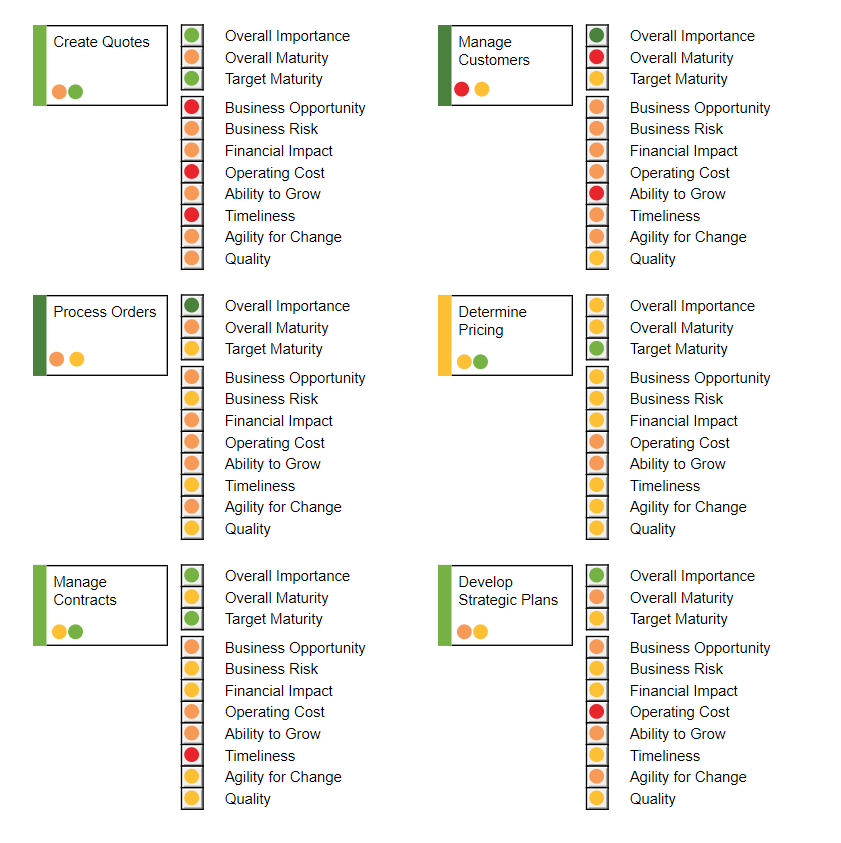
In this Business Capability Model (shown above), more attributes are shown at the right-hand side of the Capability. This way you can get a more detailed view of the state of your enterprises Capabilities.
Other functionalities: Using the Analysis tool, the information from the Business Capability Model template can generate maturity- and score heat maps, hierarchies, score views, capability contexts, gap analyses, dashboards, and what-if-, impact- and investment analyses.
Relation to other templates: The Business Capability Model is a strategic template and is as such complimentary to for example the Strategy Model and Work Model. It can be used to illustrate a change process going from one set of capabilities to another. A Capability can link to the Business Processes that uses it as well as the resources it employs. This way it can also be analyzed which Business Processes would be affected by the improvement or worsen of a given Capability.
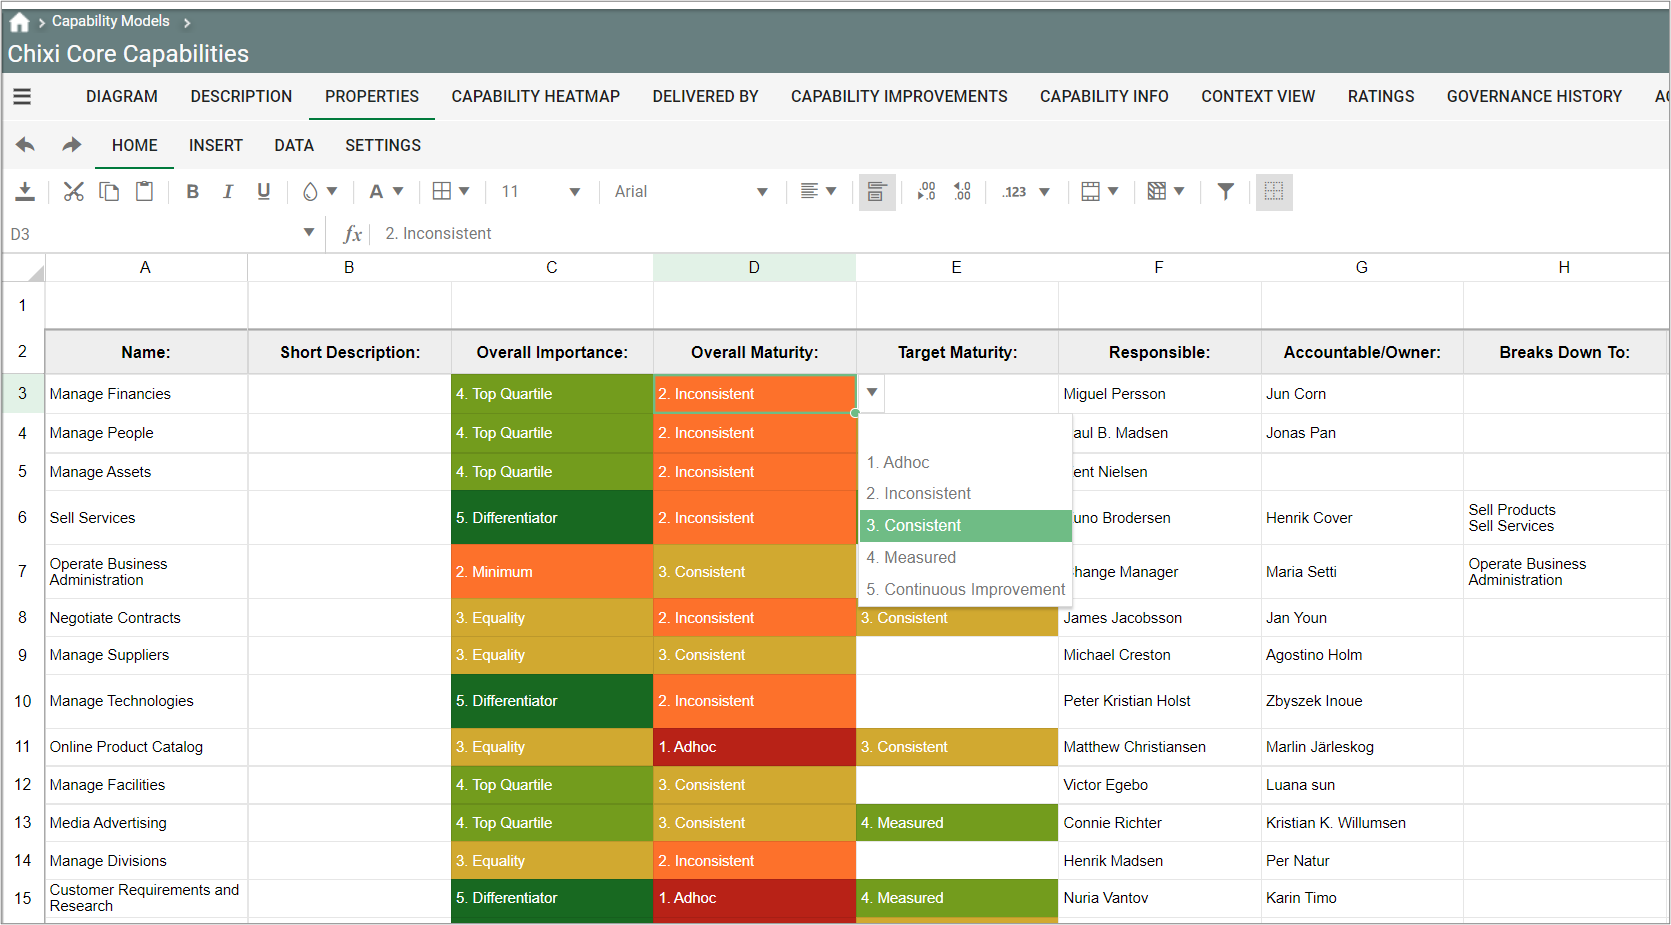
It is easy to update and analyse the capability models via the standard views on the web:
The capabilities in a Business Capability Model can easily be scored and presented in filterable and editable lists via the spreadsheet functionality in e.g. the Properties view
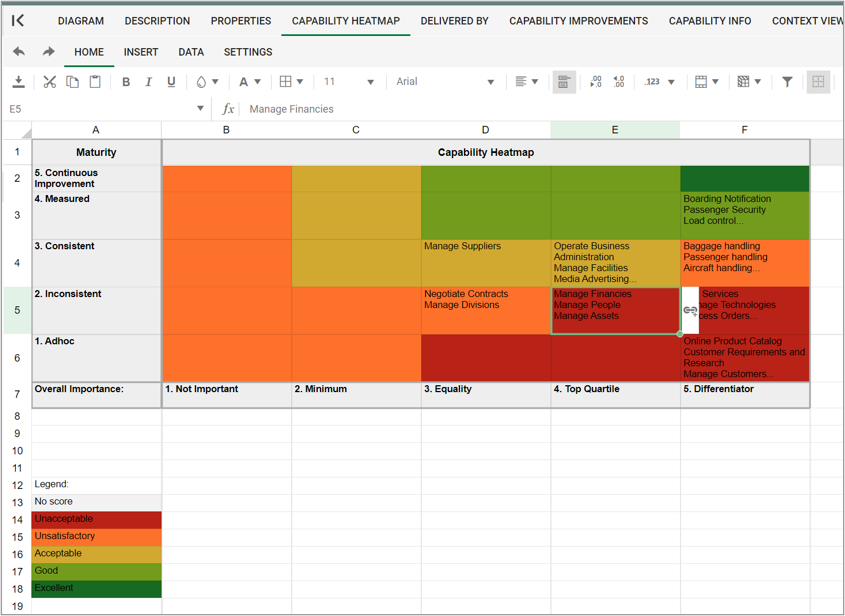
The capabilities can be presented in a Capability heatmap
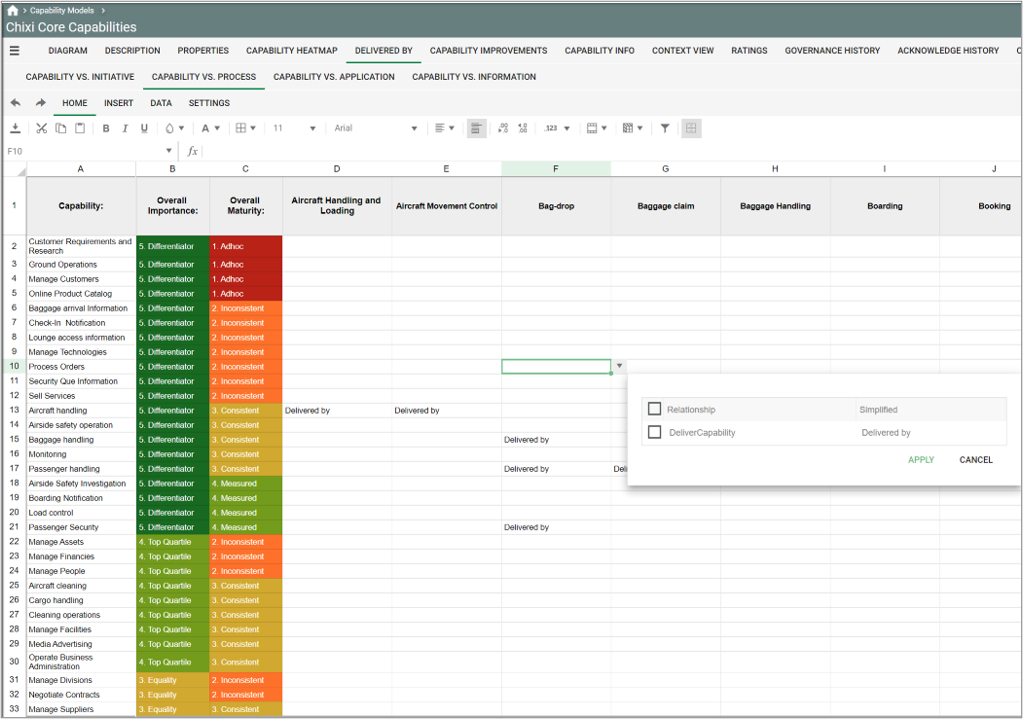
From the Delivered by view you can analyze and update relations between capabilities and initiatives, processes, applications and information-objects.
Properties and metadata: The Business Capability Model can for example retain the following information:
A description of the diagram
Link to the owner of the diagram
Link to the one responsible for the accuracy of the diagram
Associated documents, diagrams and other objects
Inherent Risk detailing risk considerations
Governance information detailing information about the published diagram and who has been involved in the approval of the diagram
Project status: information about budgeted and actual man-hours spent, percentage completed and the latest milestone, result and quality control of a change process.
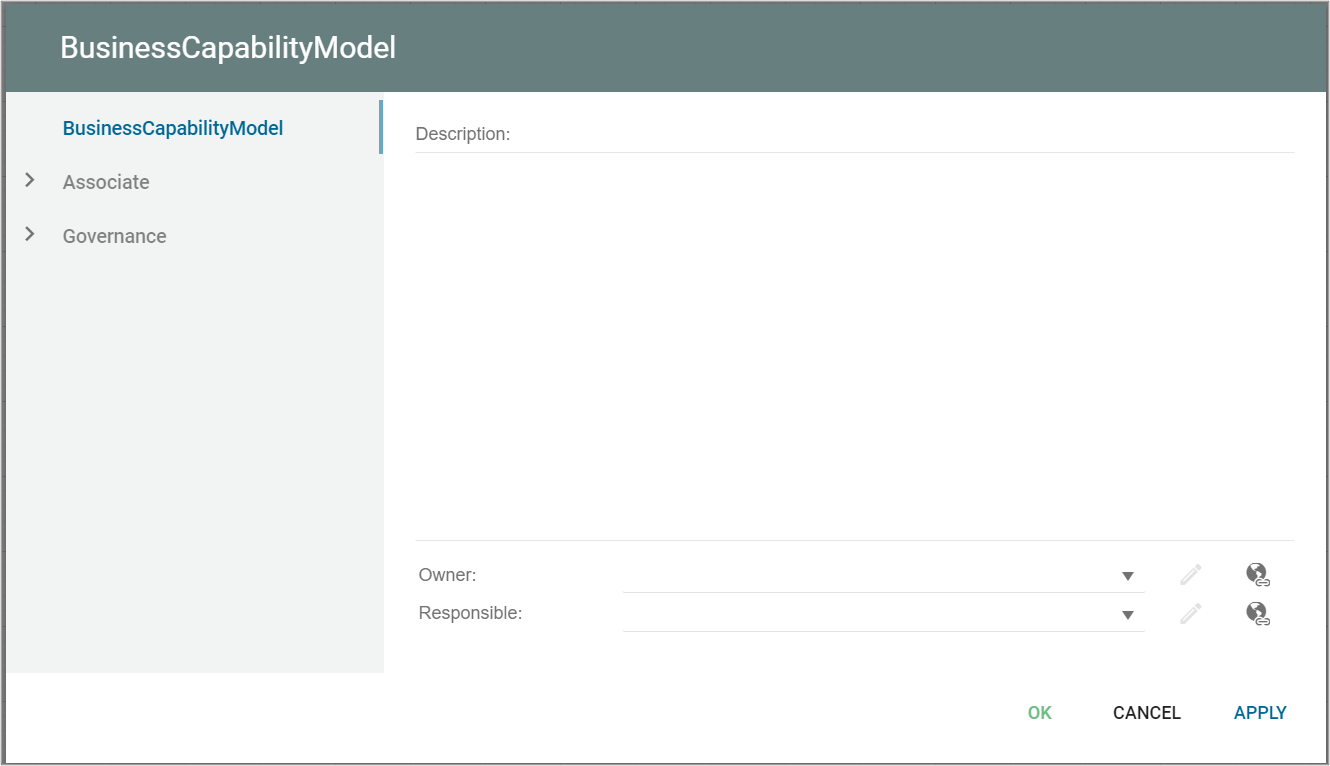
The above picture shows the properties dialogue window for the Business Capability Model where you can edit the diagram’s properties.
Note that the Capabilities’ metadata that are exhibited in the Business Capability Model is not further described here as they belong to the Capability object and not the Business Capability Model template.