An actual label.
Archives: Templates
Templates and model types in the QualiWare platform.
Value : ArchiMate
Value may apply to what a party gets by selling or making available some product or service, or it may apply to what a party gets by buying or obtaining access to it. Value is often expressed in terms of money, but it has long since been recognized that non-monetary value is also essential to business; for example, practical/functional value (including the right to use a service), and the value of information or knowledge. Though value can hold internally for some system or organizational unit, it is most typically applied to external appreciation of goods, services, information, knowledge, or money, normally as part of some sort of customer-provider relationship.
A value can be associated with all core elements of an architecture as well as with outcomes. To model the stakeholder for whom this value applies, this stakeholder can also be associated with that value. Although the name of a value can be expressed in many different ways (including amounts, objects), where the “functional” value of an architecture element is concerned it is recommended to try and express it as an action or state that can be performed or reached as a result of the corresponding element being available.
Vision
Idea that the the future strategy will seek to realize.
Window
A design of a dialog in the developed system.
WorkFlow Condition
A workflow condition is a symbol on the WorkFlowDiagram that is used to split the path through the diagram into two. Depending on the workflow condition either one of the paths are chosen.
WorkPackage : ArchiMate
The central behavioral element is a work package. A work package is a behavior element that has a clearly defined start and end date, and realizes a well-defined set of goals or deliverables. The work package element can be used to model sub-projects or tasks within a project, complete projects, programs, or project portfolios.
Conceptually, a work package is similar to a business process, in that it consists of a set of causally-related tasks, aimed at producing a well-defined result. However, a work package is a unique, “one-off” process. Still, a work package can be described in a way very similar to the description of a process.
Zone
A zone is typically defined by a port on the firewall.
Dialog Layout
Purpose: The purpose of the Dialog Layout template is to provide a representation of a dialog design for the system developed in the Dialog Model.
Core concerns: The Dialog Layout template enables you to model Windows, Fields, Menu Layouts and General Concepts.
Relation to other templates: The Dialog Layout is a QualiWare system template and is related to the Dialog Model, Menu Layout, Report Layout and Help Model.
Properties and metadata: The Dialog Layout template can for example retain the following information:
- A description of the diagram
- A link to Epilog and Prolog
- Audits (auto generated information regarding its current state and access rights)
- Associated documents, diagrams and other objects
- Inherent Risk detailing risk considerations
- Governance information detailing information about the published model and who has been involved in the approval of the layout
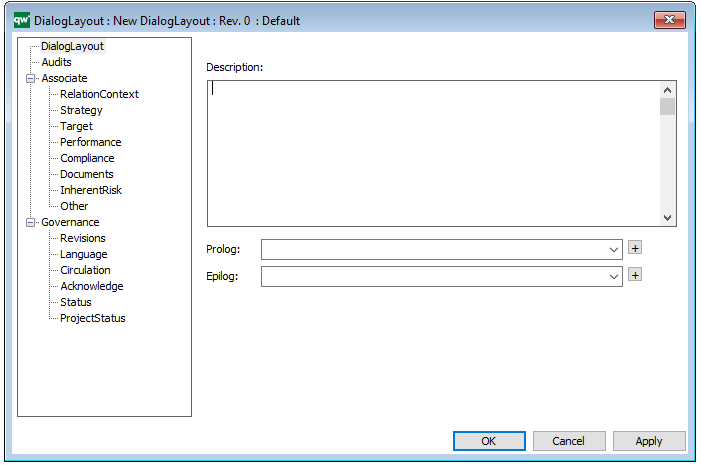
The above picture shows the properties dialogue window for the Dialog Layout template where you can view and edit the model’s properties in QualiWare Lifecycle Manager.
Dialog Model
Purpose: The purpose of the Dialog Model is to enable the creation of customized applications for your QualiWare solution that, for example, can generate codes for the Data Model Diagram.
Core concerns: The Dialog Model template enables you to model Dialog Layout, Menu Layout, Report Layout, Help Model and Application Specifiers. These elements can be associated through Connections.
Relation to other templates: The Dialog Model is a QualiWare system template and is related to the Dialog Layout, Menu Layout, Report Layout and Help Model.
Properties and metadata: The Dialog Model template can for example retain the following information:
- A description of the diagram
- Audits (auto generated information regarding its current state and access rights)
- Associated documents, diagrams and other objects
- Inherent Risk detailing risk considerations
- Governance information detailing information about the published model and who has been involved in the approval of it.
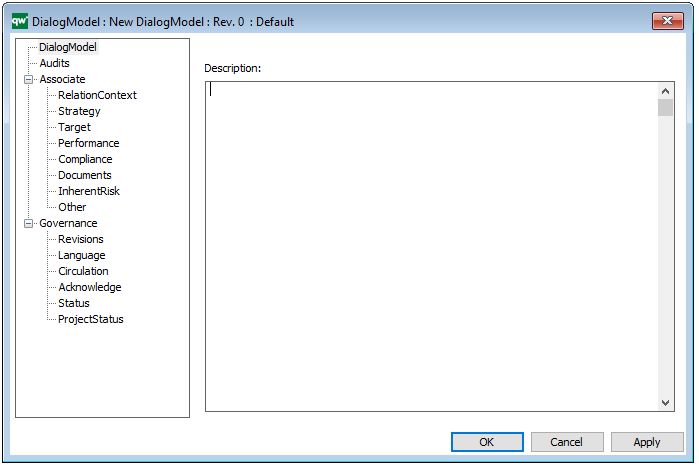
The above picture shows the properties dialogue window for the Dialog Model template where you can view and edit the template’s properties in QualiWare Lifecycle Manager.
Document Desktop
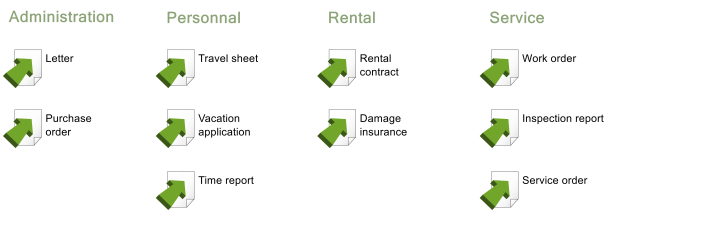
Purpose: The purpose of the Document Desktop is to show the internal and external documents currently in use.
Core concerns: The Document Desktop template enables you to model Document Structures, Document Fragments, Documents, External Documents and Configuration Diagrams.
Below, you can see an example of a Document Desktop, where an organizations templates and forms are gathered in the form of external documents:
In the next example, you can see two collections of Reports, which set the structure for the reports available to print from the collaboration platform:
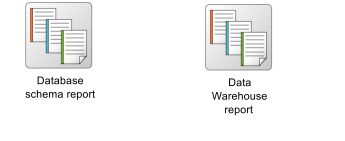
The Document Desktop template can also be used to gather collections of reports, which you can see examples of below:
QualiWare Diagram Template Reports:
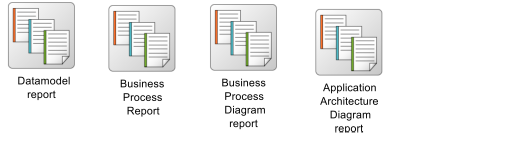
Reports:
Relation to other templates: To document a well-defined combination of documents and files, a Configuration Diagram should be used. Other templates related to the configuration of Reports are: Browser Diagram, Document Structure, and Document Header.
Properties and metadata: The Document Desktop can for example retain the following information:
- A description of the desktop
- Audits (auto generated information regarding its current state and access rights)
- Associated documents, diagrams and other objects
- Inherent Risk detailing risk considerations
- Governance information detailing information about the published diagram and who has been involved in the approval of the diagram
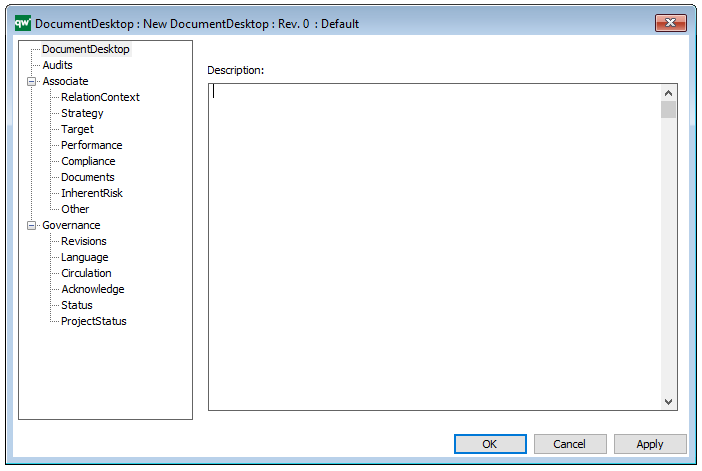
The above picture shows the properties dialogue window for the Document Desktop, where you can view and edit the diagram’s properties in QualiWare Lifecycle Manager.