An essential aspect of compliance is documenting the link between a set of regulations (for example, an ISO standard when pursuing certification) and the corresponding objects in the management systems that fulfill these regulations or requirements.

Compliance Matrices in QualiWare 10.10
Compliance matrices are generated automatically in QualiWare based upon the relations between the objects in the system. The Regulation Diagram is used to capture a set of regulations and the matrices are derived based upon the content (regulations) and their related complying objects. (Learn more about how to create and enrich the content contained in the compliance matrices).
In QualiWare 10.10 the Diagram Dashboard for RegulationDiagram contains a set of standard compliance matrices.
The Dashboard contains a tile with a query showing relevant regulations, their complying objects and their related audits.

The compliance matrix can be expanded/toggled to full size (clicking in the top right corner). The full size contains an additional set of columns enabling you to analyze and focus on the relevant subset.
- The first columns contain properties about the regulation (paragraph number, text, relevant for business)
- Audits where the regulation is target regulation (name, audit date and audit governance state)
- Complying objects (responsible for the object, type of template, governance state of the object)
- Change request related to the complying object, and their governance state
- Non-Conformances related to the complying object, and their governance state
- Audits where the complying object is target object (name, audit date and audit governance state)

Other tiles on the Diagram Dashboard for RegulationDiagram support essential steps related to compliance matrices and compliance analysis.
The Edit tile contains a set of Editable Spreadsheets where data and relations can be managed and updated:
Click here to explore the full list of spreadsheets available in the Edit tile on the Regulation Diagram Dashboard.

The Analyses tile contains a set of filterable QRVs each focusing on a relevant subset of properties and relation to the regulations:

The Highlight tile contains a set of Advanced highlights that are based upon derived relationships and underlying data. This enables the user to get an easy and comprehensive view whether a regulatory object is relevant for business, has complying objects and if so when it has last been audited.
Click here to explore the full list of Highlights available in the Highlight tile on the Regulation Diagram Dashboard.


Compliance Matrices in QualiWare 10.9 and earlier
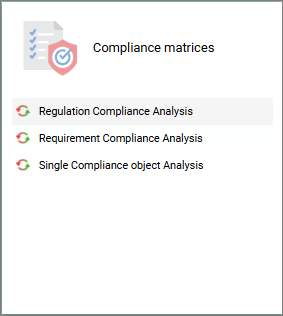
 The Compliance Matrices are available from the standard tiles on the Compliance Desktop (version 10.9 and earlier). One tile for regulatory compliance and another for requirements.
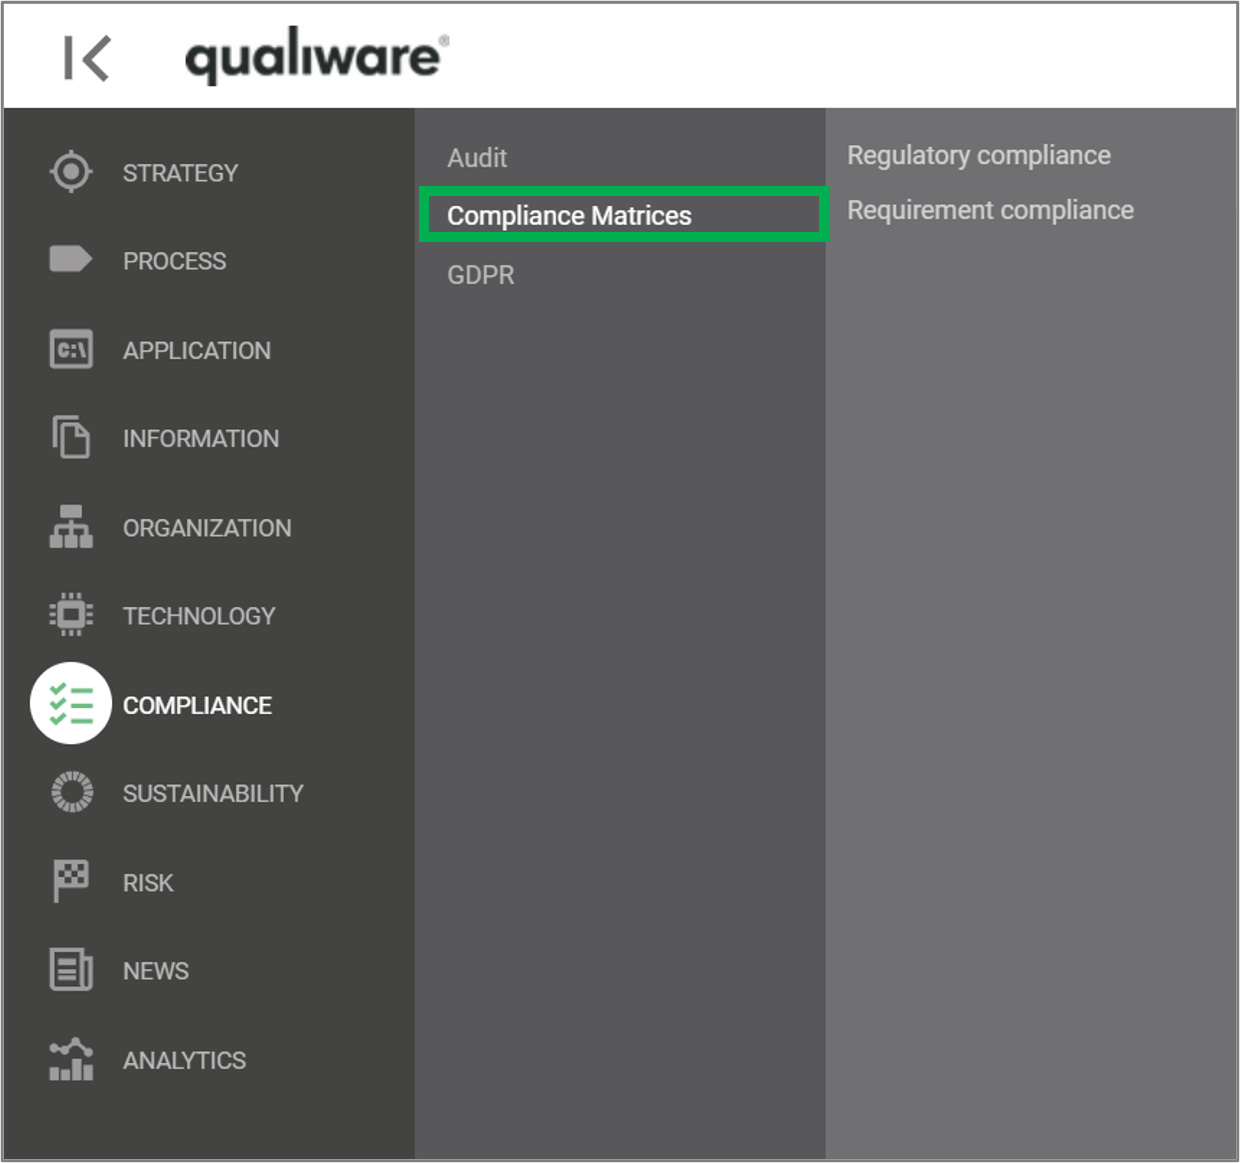
The Compliance Matrices can also be accessed from the left-menu under Compliance.
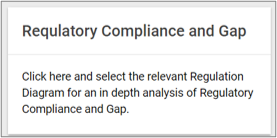
The tile “Compliance and Gap Analysis” and the menupoint “Regulatory compliance” provides access to the list of Regulation Diagrams in the repository. The Regulation Diagram allows the user to create a diagram containing the relevant regulation for a specific purpose. This may be the entire set of clauses in an ISO standard, or it may be a selected set of regulations that the business needs to document compliance towards.
Note, you need to add a regulation diagram / requirement diagram to the repository, to get content in the compliance matrix. Click here to learn how to create a compliance matrix.
When a Regulation Diagram is selected in the list, the tool does not show a diagram. Instead, two analysis tabs with compliance analysis and gap analysis are available. The Compliance Analysis looks like this:
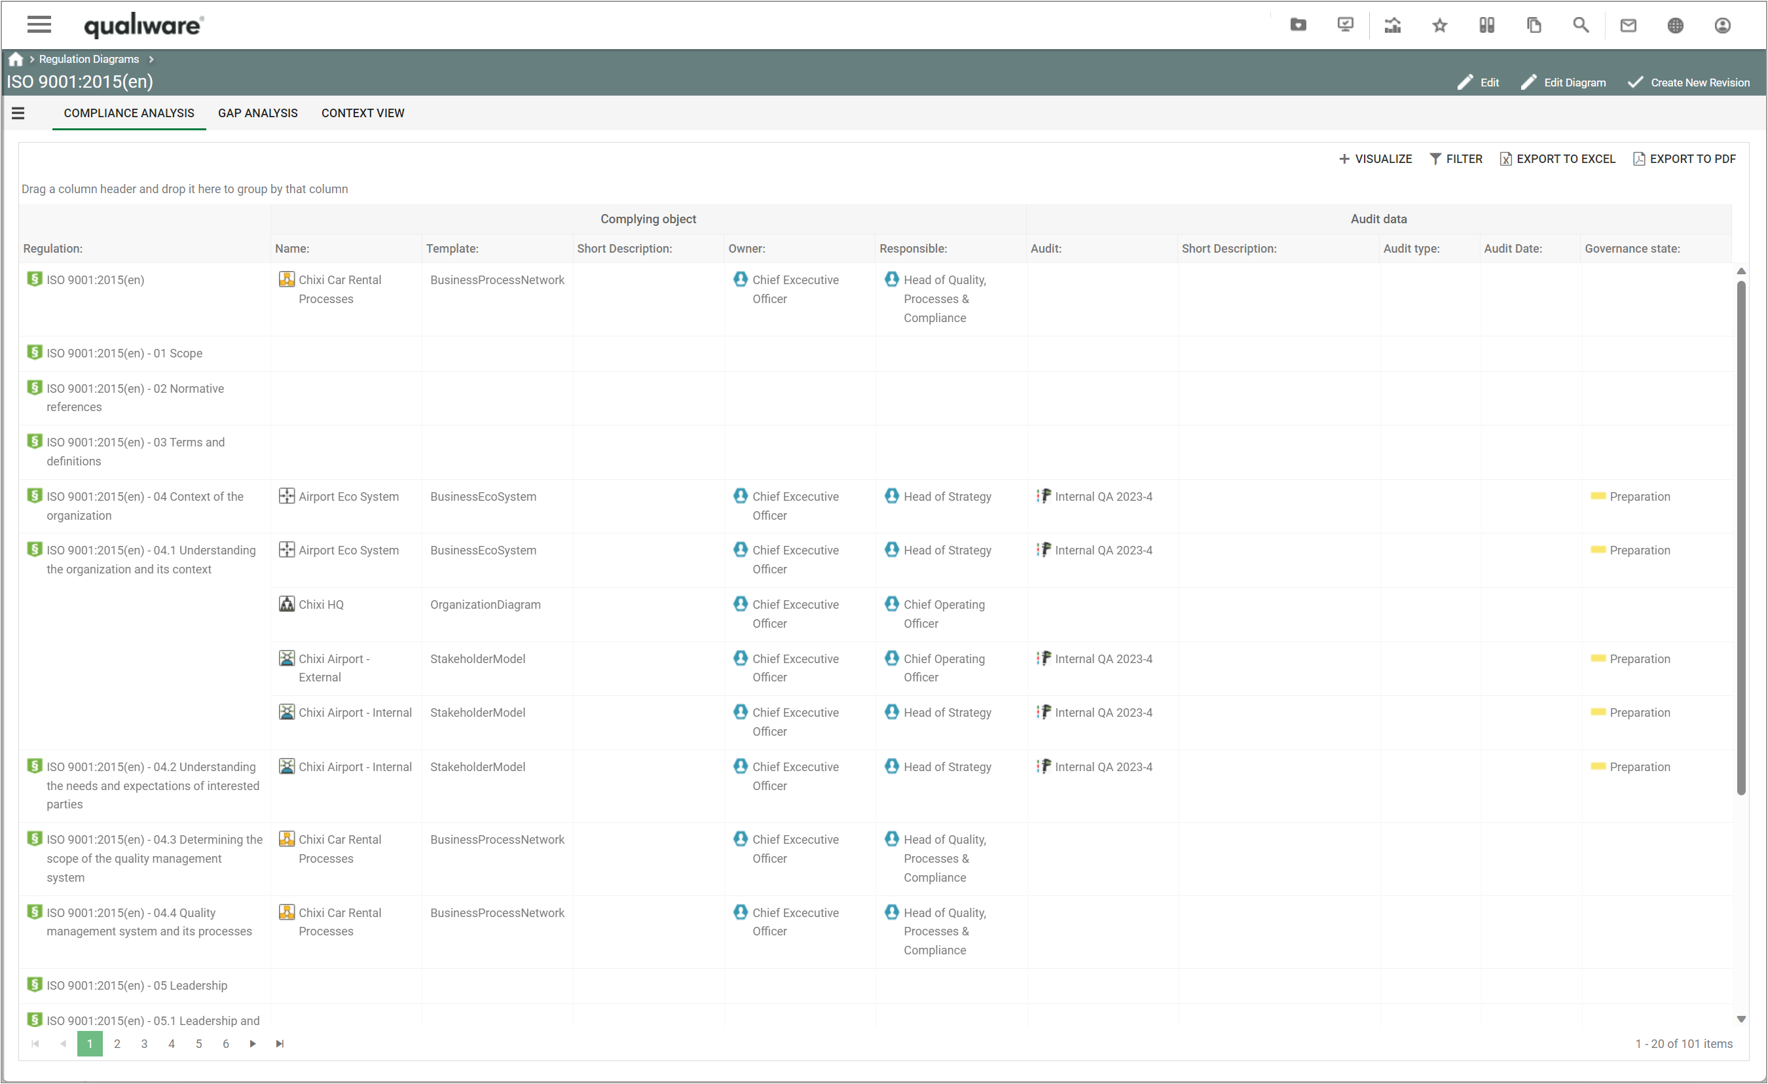
The left part of the compliance analysis lists the objects complying with a regulation. If compliance is missing, the Complying object part of that row will be empty (see section below for how to add content to the complying object). The right part of the analysis details the audits that have been executed with focus on the complying objects. This way, the auditor can easily find the validation of a compliance, and identify needs for target to upcoming audits.
The gap analysis includes the same left part as the compliance analysis, but the right part shows a list of Change Requests defined for the complying objects:
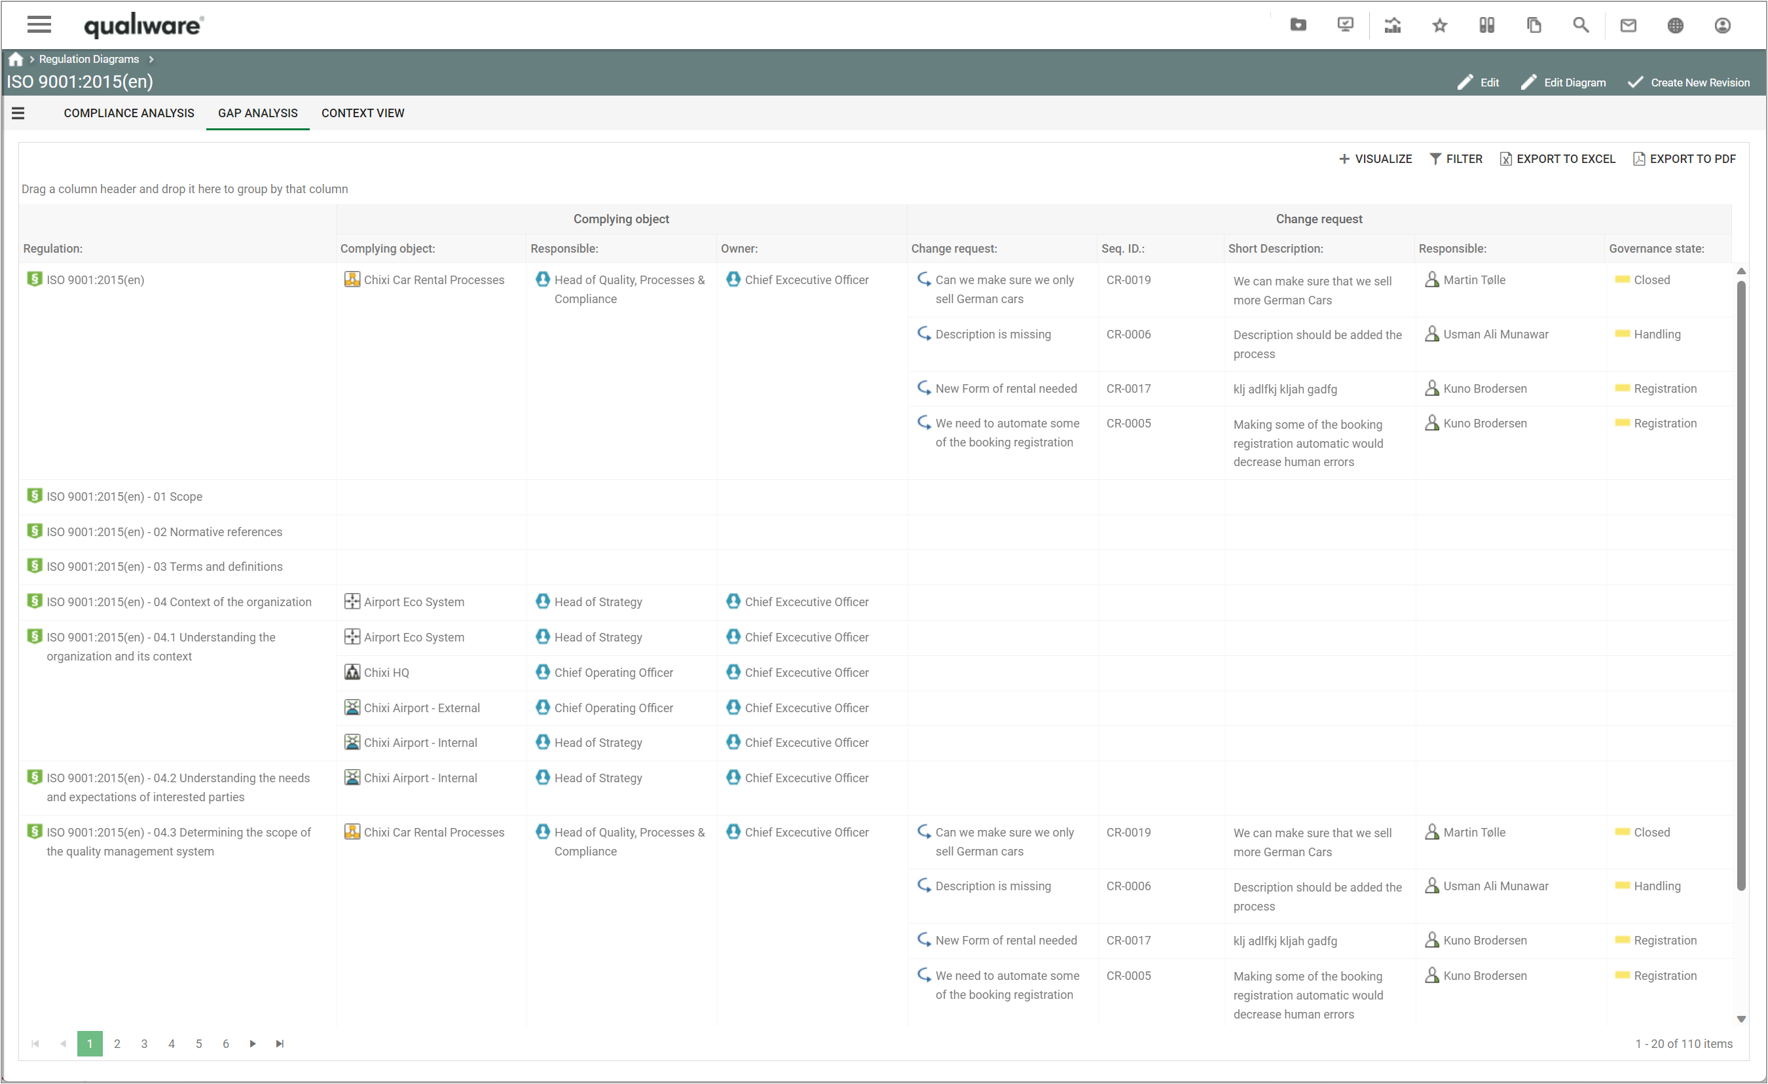
With this analysis, it is easy to see which changes are required to reach the desired level of compliance.
Similar tabs and compliance matrices are associated to the requirement models.
Create a Compliance Matrix
- To create a compliance matrix, you need to create a regulation diagram or a requirement model that contains the relevant regulations or requirements in scope for your organisation (see more here)
- Once you have created the regulations/requirements in the repository, you can associate the relevant complying objects in the repository to each of the relevant regulations/requirements
- You link from the complying object to the regulation via the “Compliance With” association
- The easiest way to establish the link is via the standard “Property” spreadsheets on the process dashboards on the “Edit” tile.
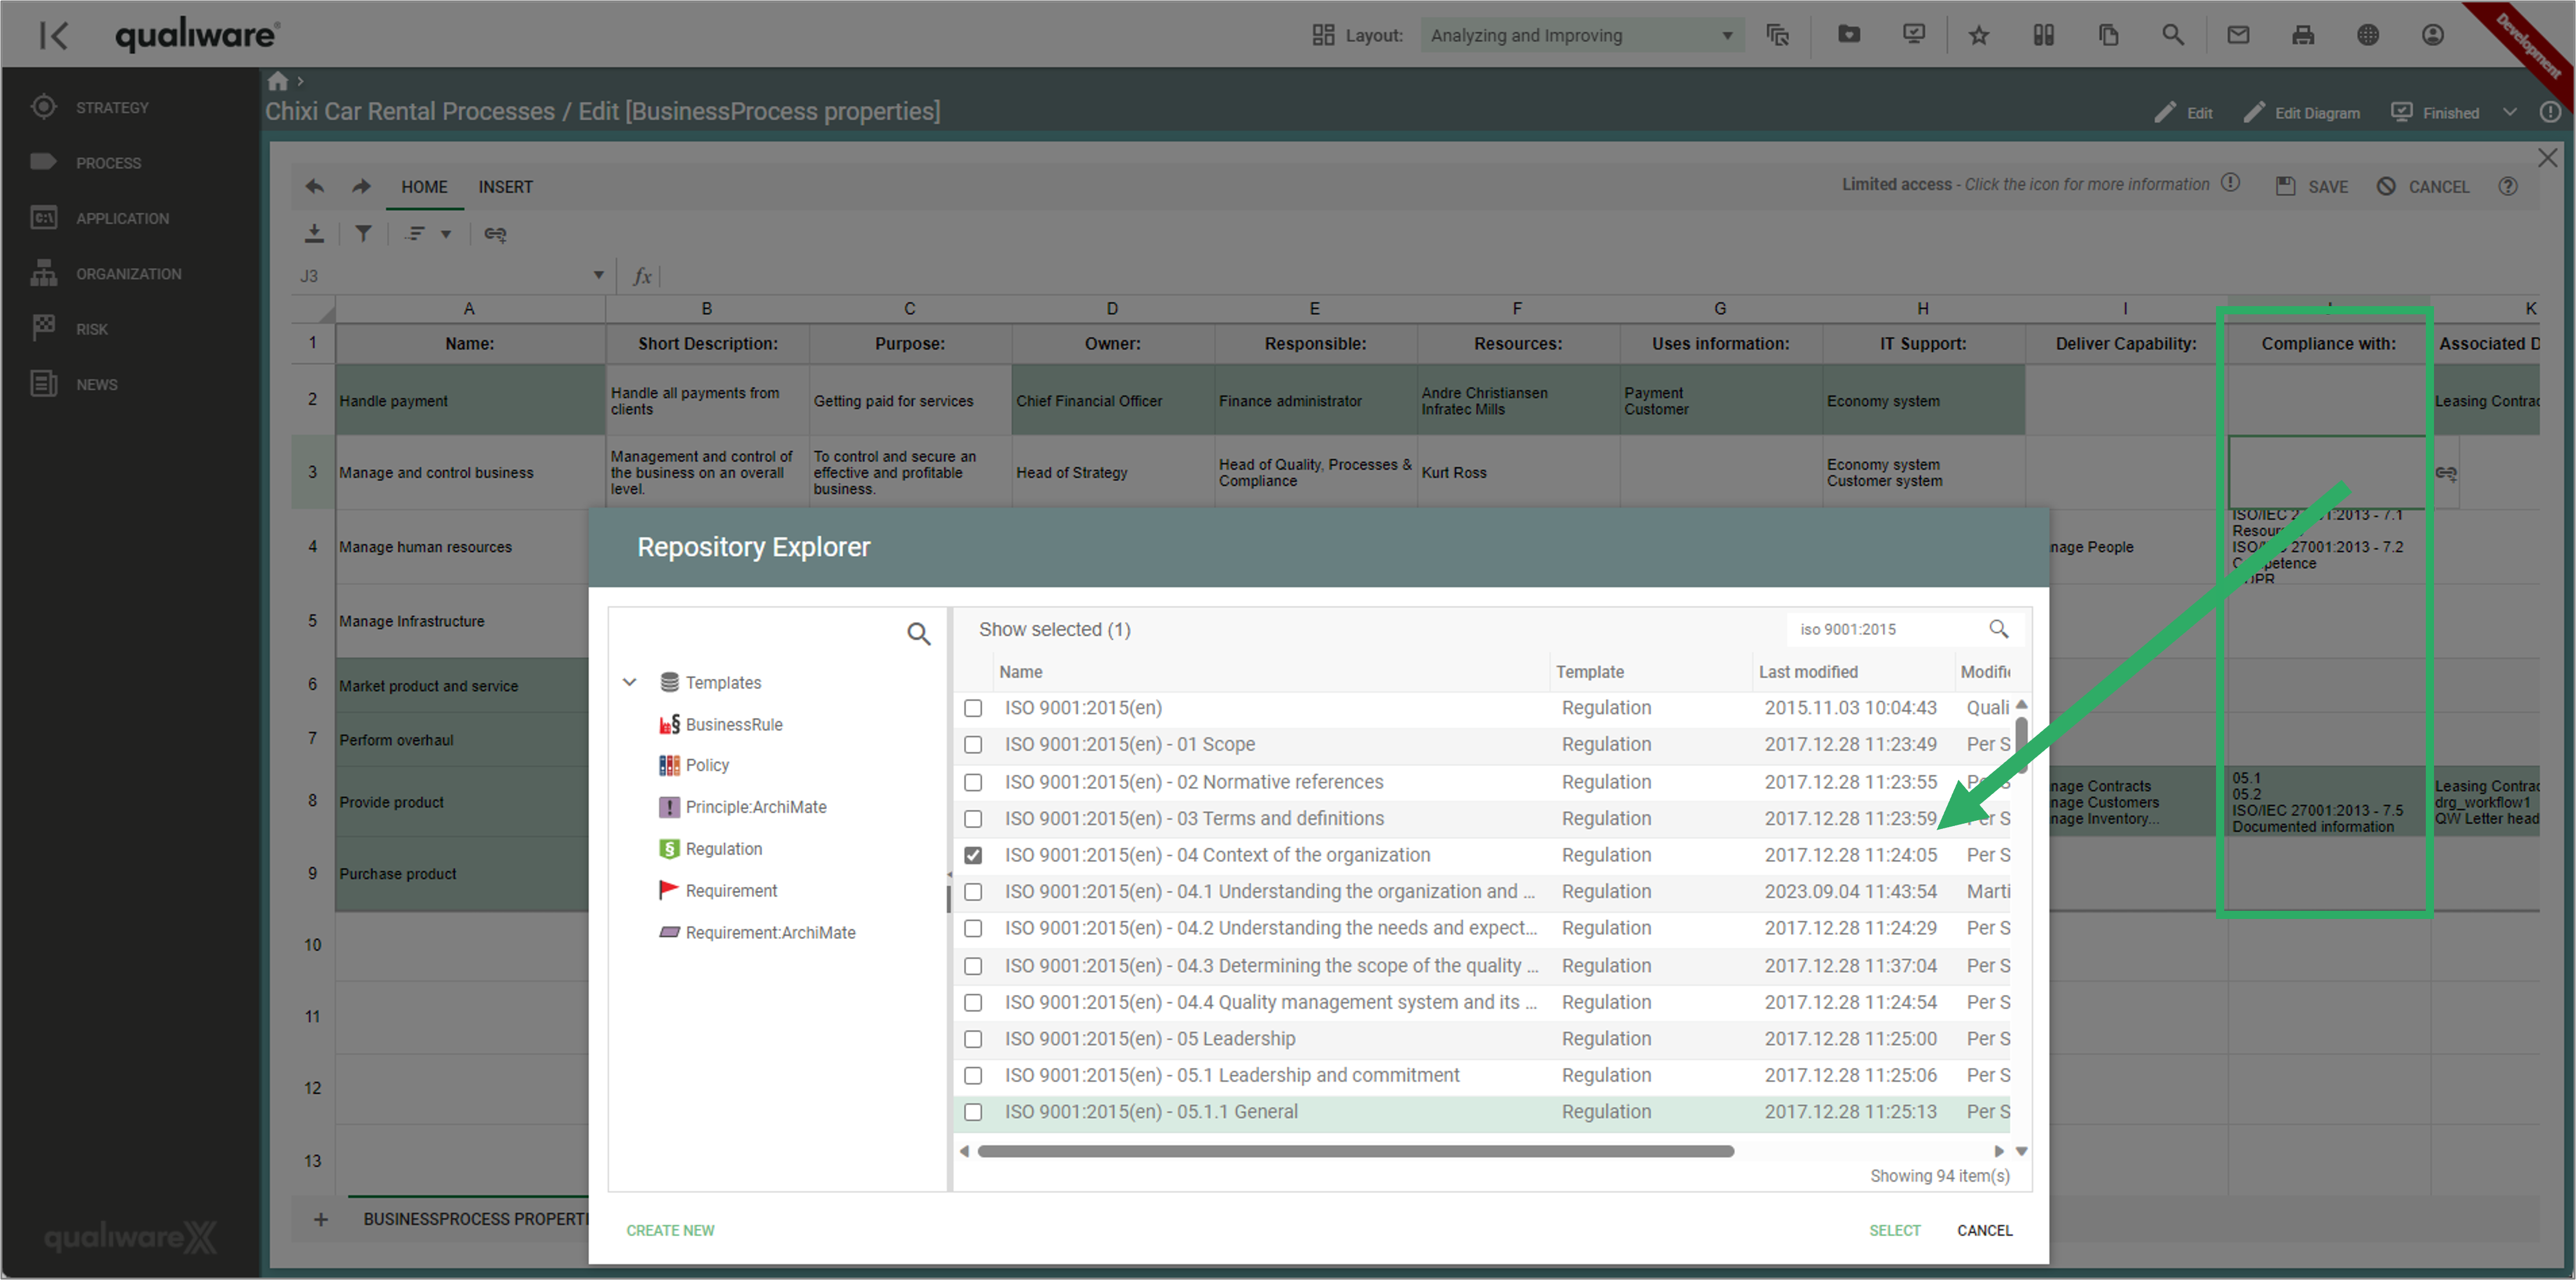
- In the example above the compliance with relation is established “from” the complying object to the regulation, you can also insert the relation from each regulations “to” the complying objects using the Edit tile on the RegulationDashboard.
Click here to see a more detailed step by step guide of how to work with compliance matrices in QualiWare 10.10.