Deployment Diagram

Purpose: The purpose of the Deployment Diagram is to document the configuration of run-time processing nodes and the components they contain.

Core concerns: The Deployment Diagram template is structural UML diagram that enables you to model Packages, Components, Artifacts, Instance Specifications, Properties, Nodes, Devices, Execution Environments, Deployment Specifications, Objects, Classes, Interfaces, and Annotations. They can then be connected through Association, Dependency, Generalization, Deployment or Manifestation.

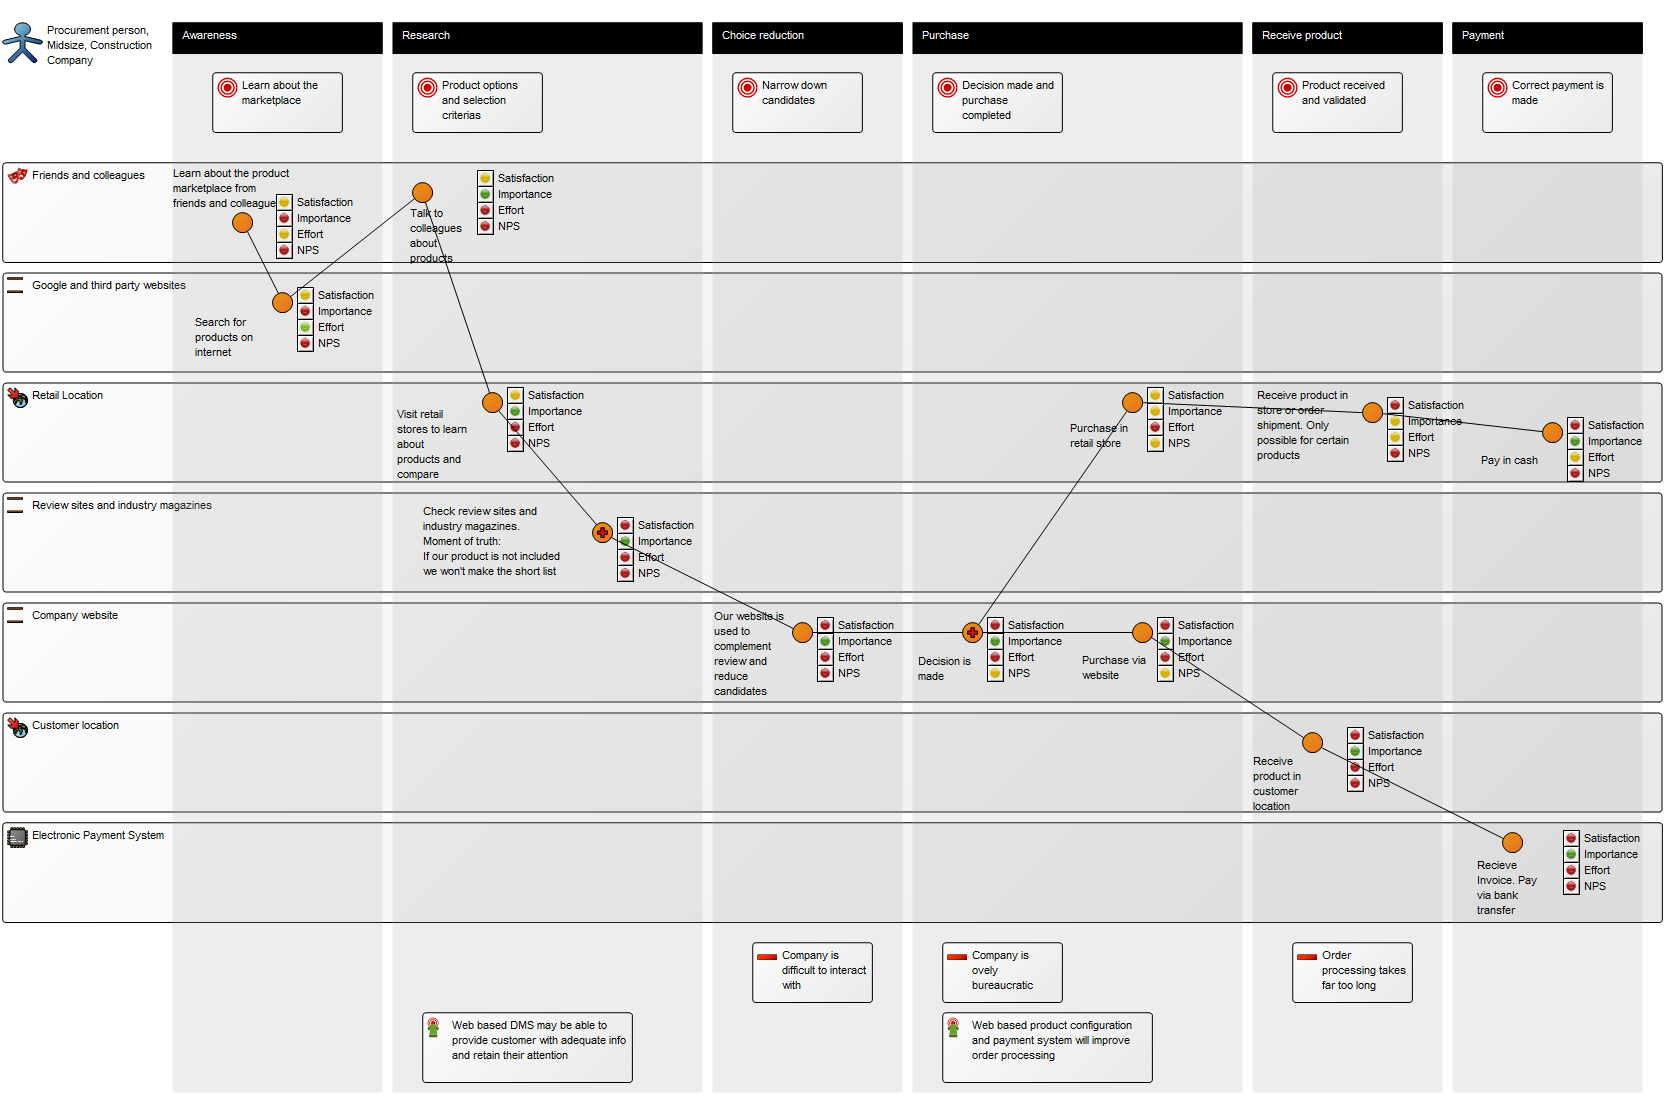
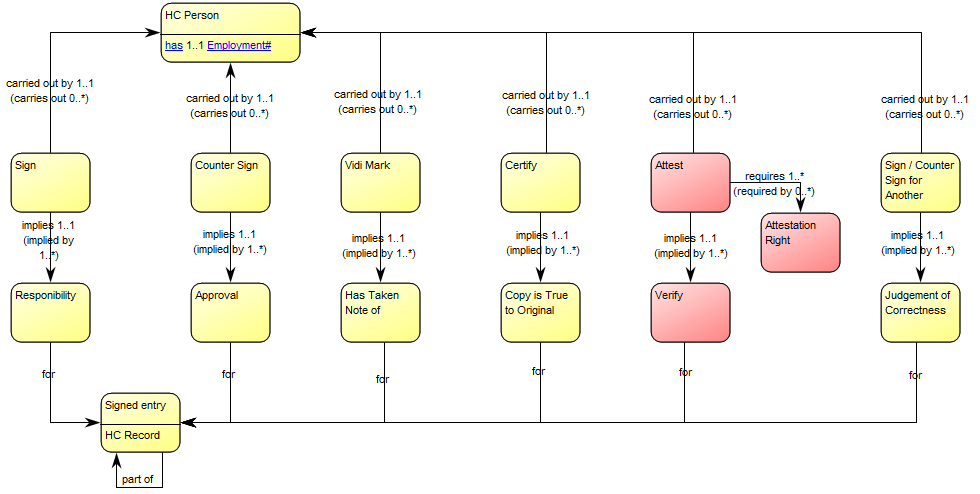
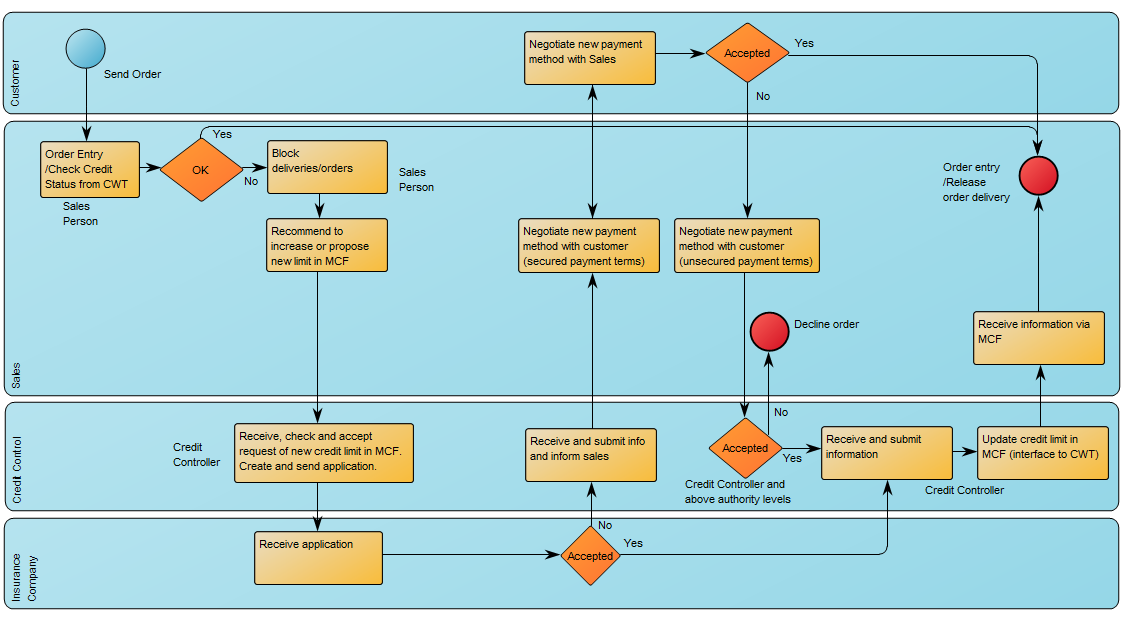
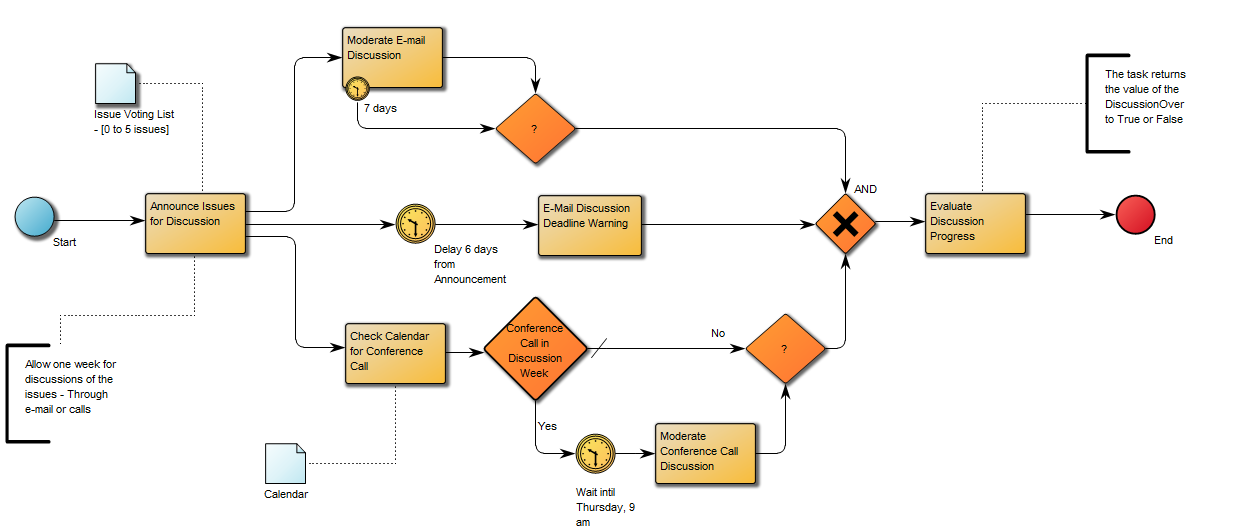
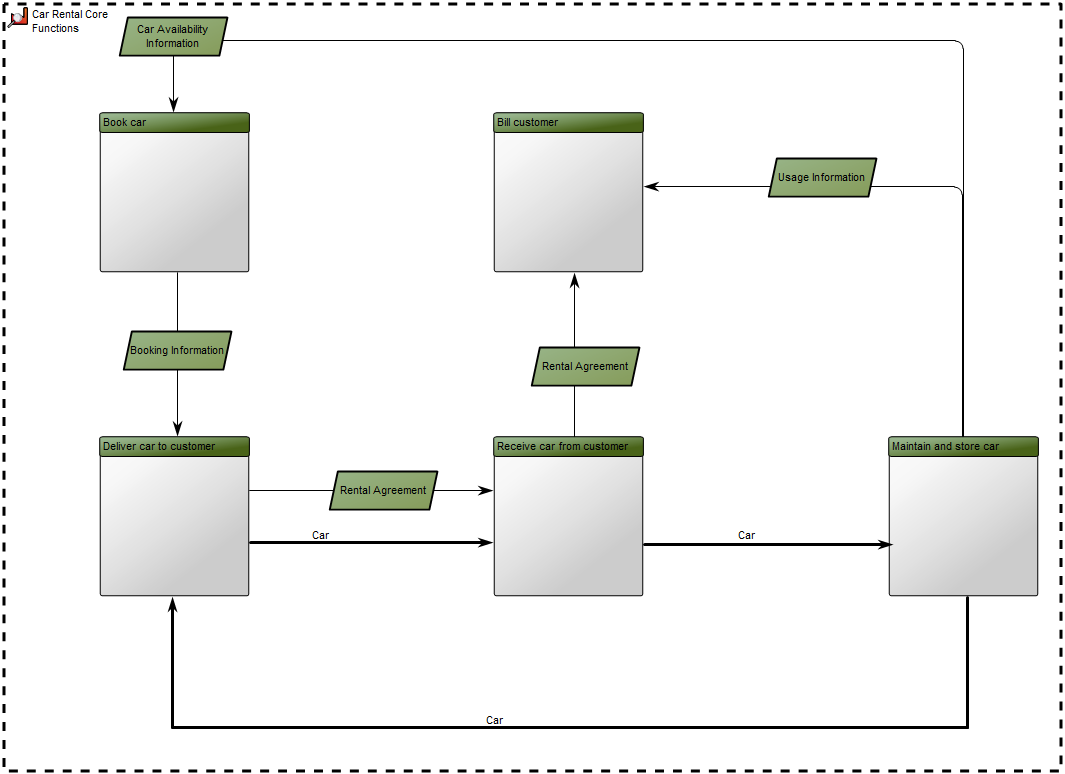
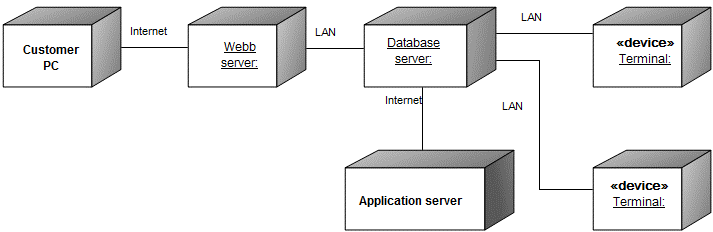
The Deployment Diagram models how the different hardware component and software components are connected. Below you can see an example of a Deployment Diagram for a booking service:

DeploymentDiagram_1

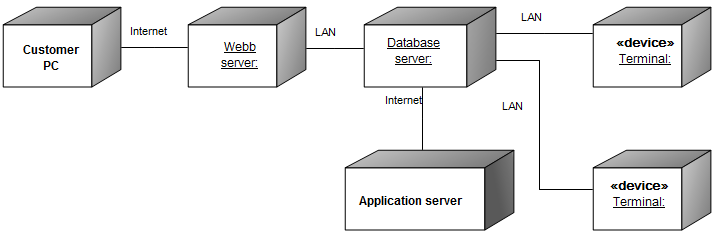
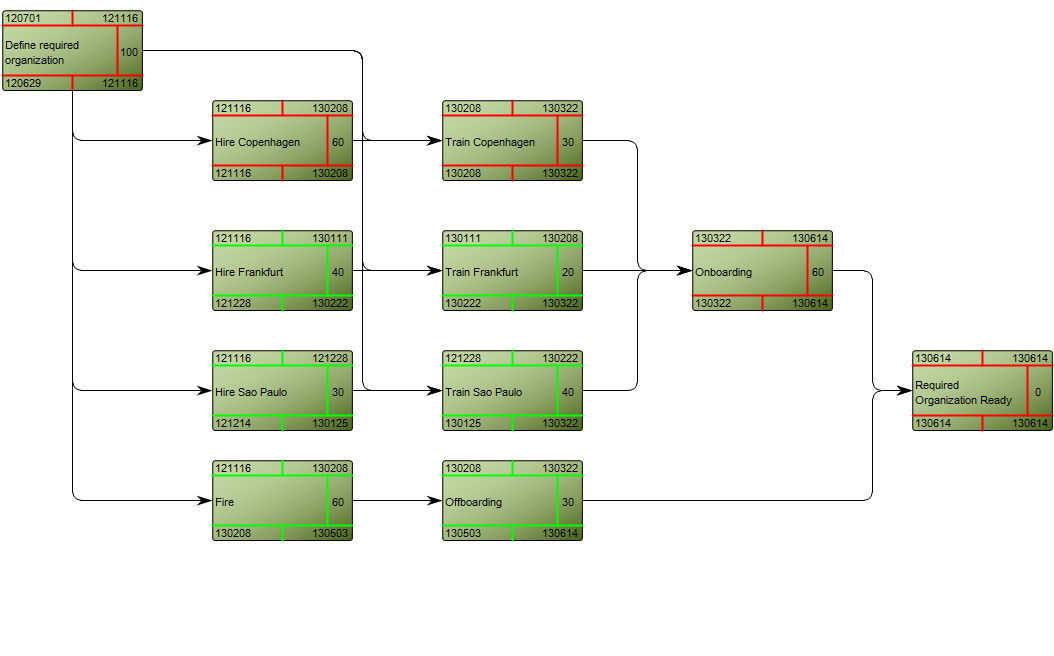
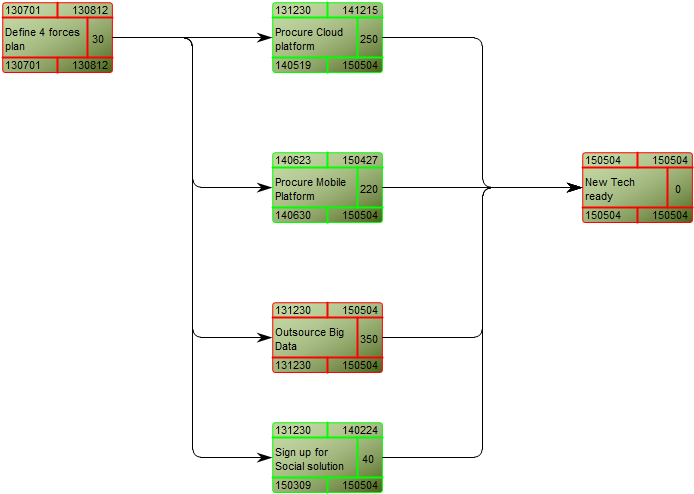
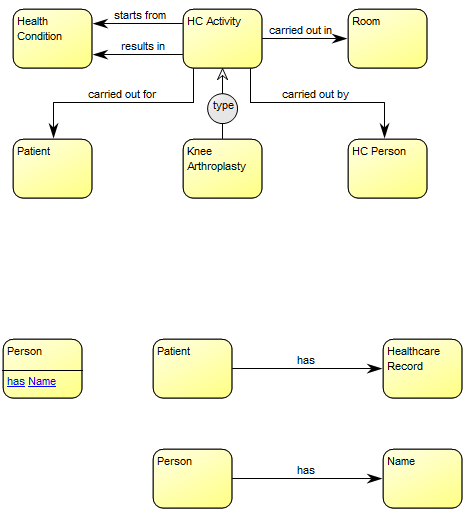
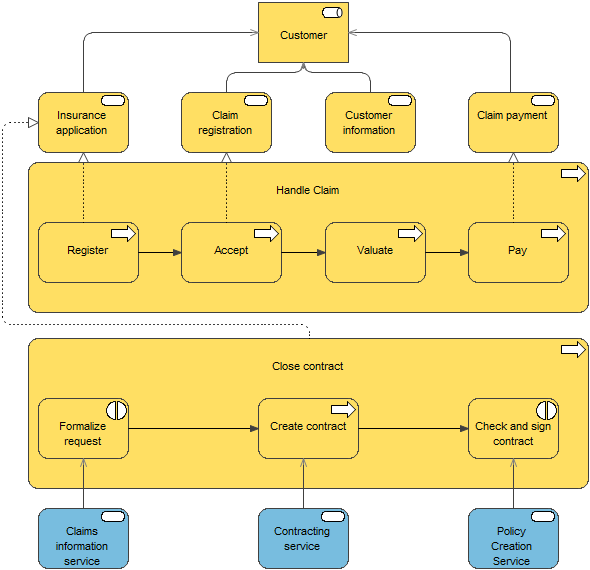
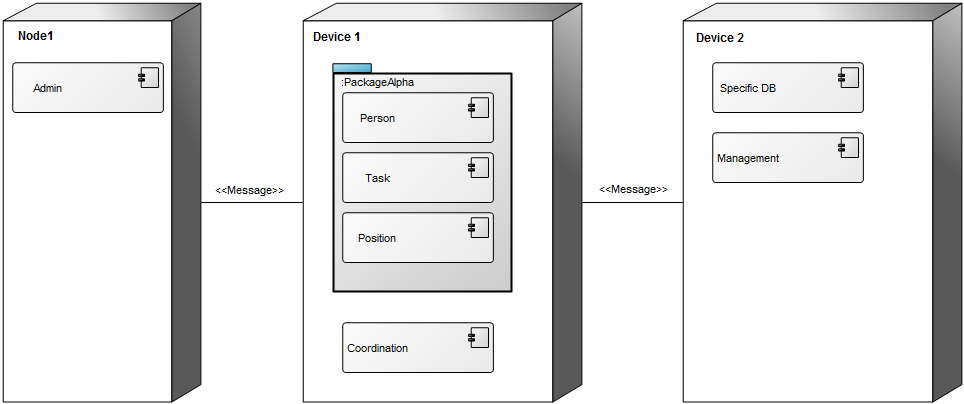
In the next example, you can see how Packages and Components would be included in a Deployment Diagram:

DeploymentDiagram_2

Relation to other templates: The Deployment Diagram is, as a component model, part of the application domain on the operational level. As such, it offers a complimentary view to those of the Application Architecture Diagram, Class Diagram, Component Diagram, Data Flow Diagram, Data Mapping Diagram, Data Replication Diagram, Sequence Diagram, State Event Diagram, Structure Chart, and Use Case Diagram.

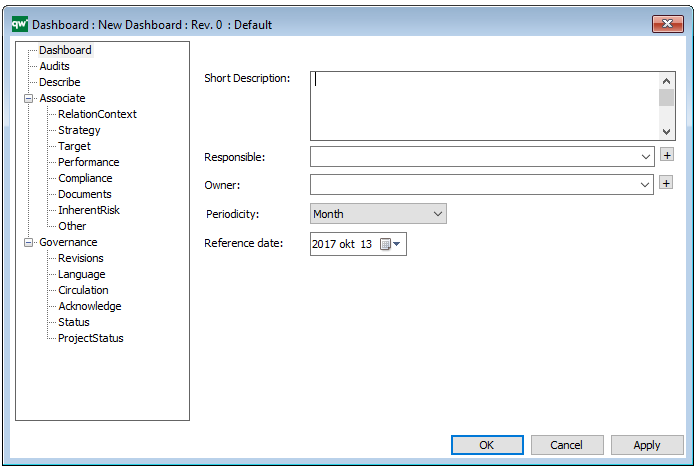
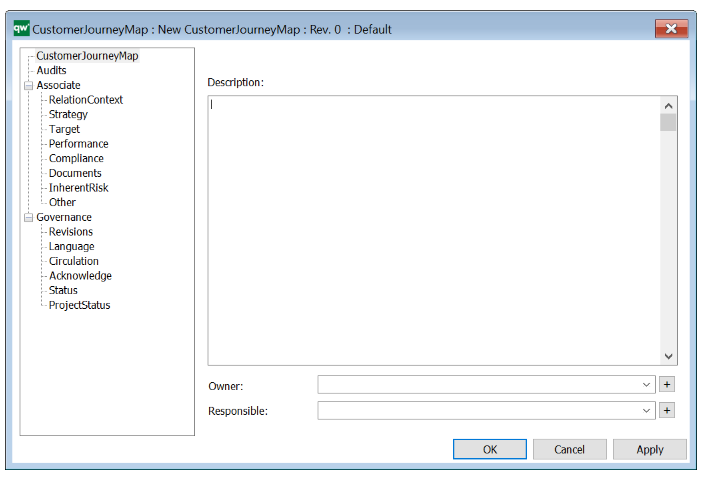
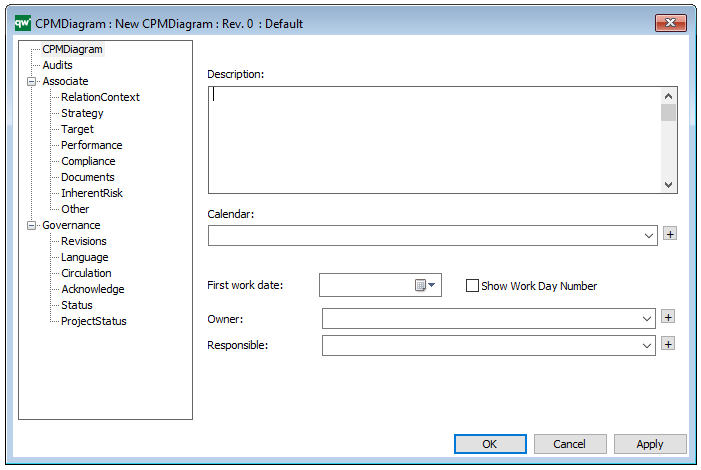
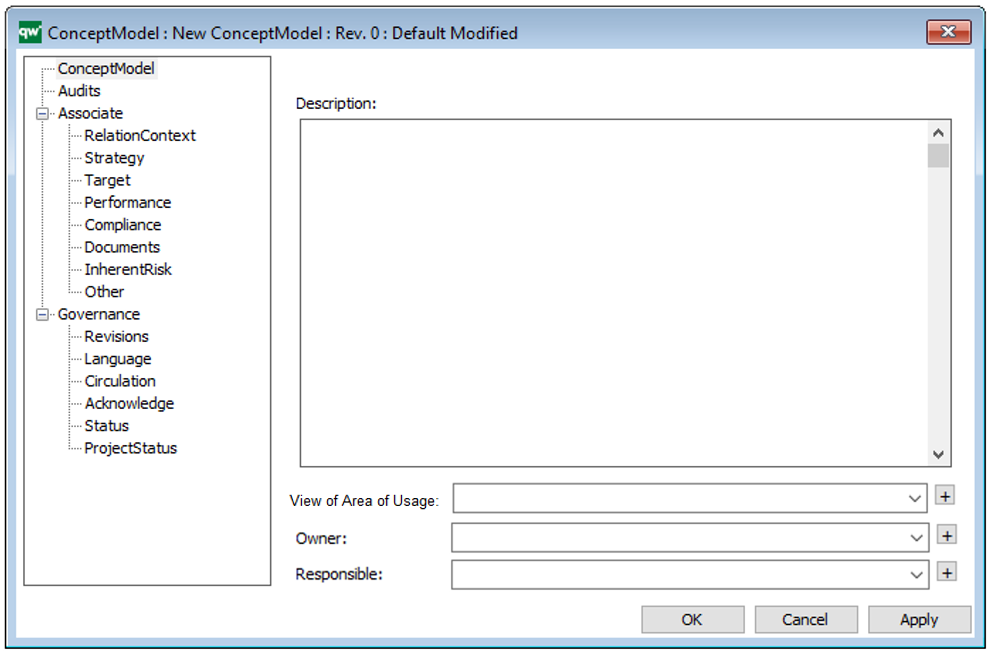
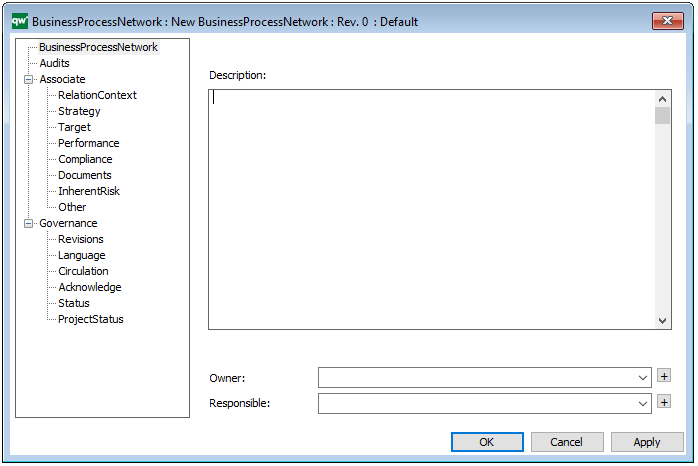
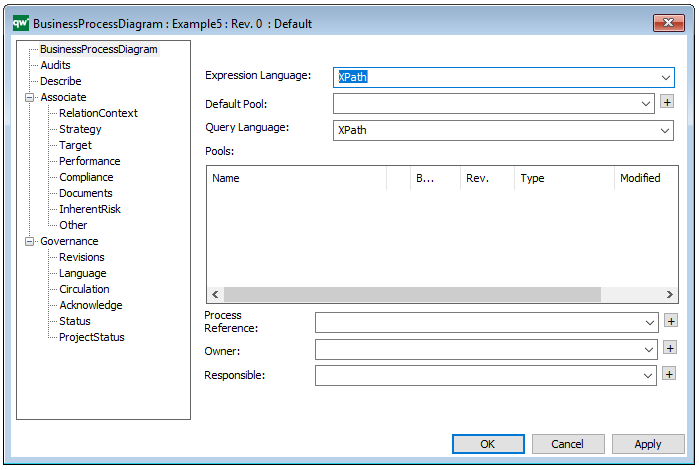
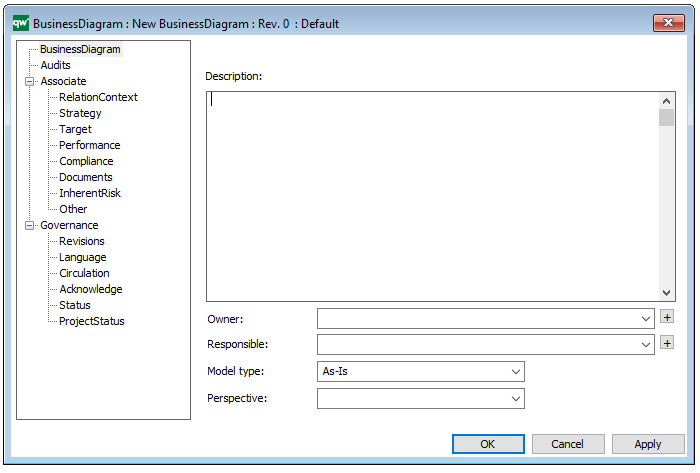
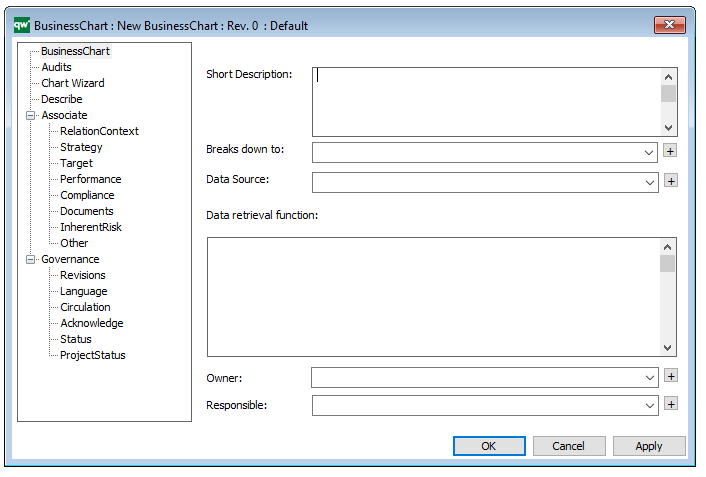
Properties and metadata: The Deployment Diagram can for example retain the following information:

  • A description of the diagram
  • Link to the owner of the diagram
  • Link to the one responsible for the diagram
  • Links to extensions such as Stereotypes and Constraints
  • Audits (auto generated information regarding its current state and access rights)
  • Associated documents, diagrams and other objects
  • Inherent Risk detailing risk considerations
  • Governance information detailing information about the published diagram and who has been involved in the approval of the diagram

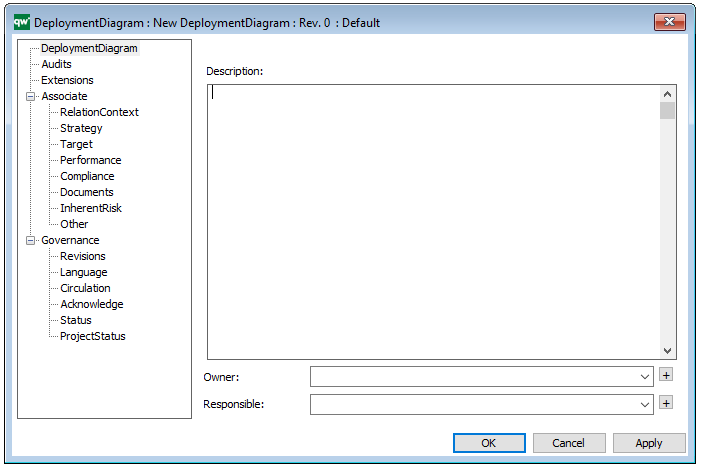
The above picture shows the properties dialogue window for the Deployment Diagram where you can view and edit the diagram’s properties in QualiWare Lifecycle Manager.


Dashboard

Purpose: The purpose of the Dashboard template is to publish selections of Business Charts targeting different stakeholders. It should be used to gather a series of relevant or connected Business Charts to provide a dashboard-like overview.

Core concerns: The Dashboard template enables you to gather Business Charts, Key Performance Indicators, Performance Indicators and General Concepts to create stakeholder specific views of analyzed data. For example, an Enterprise Architect could find a Dashboard containing Business Charts relevant to the usage and governance of the Enterprise Architecture useful.

Below, you can see examples of different Dashboards presenting an array of Business Charts:

Dashboard_1


Dashboard_2

Relation to other templates: The Dashboard template is closely connected to the Business Chart template, as the Dashboard publishes the charts the Business Chart template generates.

Properties and metadata: The Dashboard can for example retain the following information:

  • A description of the Dashboard
  • Link to the owner of the Dashboard
  • Link to the one responsible for the Dashboard
  • Audits (auto generated information regarding its current state and access rights)
  • Associated documents, diagrams and other objects
  • Inherent Risk detailing risk considerations
  • Governance information detailing information about the published diagram and who has been involved in the approval of the diagram

The above picture shows the properties dialogue window for the Dashboard template where you can view and edit the dashboard’s properties in QualiWare Lifecycle Manager.

Customer Journey Map

Purpose: The Purpose of the Customer Journey Map template is to document the customer’s journey from awareness to the end of their interaction with an organization, covering possible touch points from the customer’s perspective.

Core Concerns: The Customer Journey Map template allows you to model connections between different Personas, Customer Journey Phases, Touch Points, Goals, Roles, Locations, Channels, Technology and the aspects from a SWOT analysis.

You can choose to model both a current state and a desired future state of the customer journey and use the documentation for process improvement. Below is an example of a current state model and a future state model:

Current state model:

CustomerJourneyMap_2

Desired future model:

CustomerJourneyMap_1

Other functionalities: The customer’s touchpoints can be elaborated upon with four scores for Customer Satisfaction, Customer Importance, Customer Effort and Net Promoter Score. Particularly vital touchpoints can be designated as a Moment of Truth.

Relation to other templates: The Customer Journey Map can be used as a groundwork for a strategic change, which for example can be modelled in a Work Model, a Business Capability Model and/or a Strategy Model.

Properties and metadata: The Customer Journey Map can for example retain the following information:

  • A description of the diagram
  • Link to the owner of the diagram
  • Link to the one responsible for the accuracy of the diagram
  • Audits (auto generated information regarding its current state and access rights)
  • Associated documents, diagrams and other objects
  • Inherent Risk detailing risk considerations
  • Governance information detailing information about the published diagram and who has been involved in the approval of the diagram
  • Project status: information about budgeted and actual man-hours spent, percentage completed and the latest milestone, result and quality control of a change process.

The above picture shows the properties dialogue window for the Customer Journey Map, where you can view and edit the diagram’s properties.

For more information: on Customer Journey Mapping, please view our webinar Experience Mapping – Customer Obsession for IT and Digital Professionals with Milan Guenther and Katharina Weber.


CPM Diagram

Purpose: The Purpose of the Critical Path Method Diagram (CPM Diagram) is to reveal the critical path through a project, i.e. the list of activities that needs special attention since a delay in these activities will delay the whole project.

Core concerns: The CPM Diagram enables you to model Project Activities and connect them with Activity Paths. The Project Activities are then enriched with information about latest and earliest dates for start and finish as well as information about duration and slack for each Project Activity.

This makes it possible to calculate the probability of finishing the project within the planned timeframe, and to successively improve and detail the plan.

Below, you can see an example of a CPM Diagram about how to develop an organization to support a strategic change. It concerns the incoming and outgoing flow of employees as well as their training across several locations:


CPMDiagram_2

As you can see, the critical path is marked with red.

The following example is of a technology roadmap, where the critical path shows the three most critical project activities for on-time completion:

Other functionalities: A Calendar can be linked to the Property Dialog of the diagram showing holidays for the project.

Relation to other templates: The CPM Diagram template should be used after a project has been broken down into Project Activities. As such, it can be a decomposition of a Project Activity from a Business Canvas, Value Proposition, Work Model, Strategy Model or Innovation Canvas.

Properties and metadata: The CPM Diagram ­­­­can for example retain the following information:

  • A description of the diagram
  • Link to owner
  • Link to responsible
  • Link to calendar
  • Audits (auto generated information regarding its current state and access rights)
  • Associated documents, diagrams and other objects
  • Inherent Risk detailing risk considerations
  • Governance information detailing information about the published diagram and who has been involved in the approval of the diagram

The above picture shows the properties dialogue window for the CPM diagram where you can view and edit the diagram’s properties in QualiWare Lifecycle Manager.

Concept Model

Purpose: The purpose of a Concept Model is to organize an enterprise’s vocabulary to support cPonsistent and unambiguous communication about specific problem domains across business units.

Core concerns: The Concept Model template enables you to model Concepts, Specialization Aspects and Subject Areas. They can be linked by Concept Associations, Concept Aggregations, Concept Generalizations, Type Relationships, and Relationship Constraints.

You are also able to link the diagram to its area of usage through the model’s property dialogue. This area of usage can by default be set to be either an Organization Unit, Role, Actor or External Entity.

Below you can see some examples of Concept Models from a healthcare domain:

The model above shows the concepts related to the healthcare activity ‘knee arthroplasty’. The model below shows the concepts related to a signature in the healthcare domain:

ConceptModel_1

The model above shows the concepts related to the healthcare activity ‘knee arthroplasty’.

The model below shows the concepts related to a signature in the healthcare domain:

ConceptModel_2

Relation to other templates: A Concept Model should enable the identification of the right terms to use in communications where high precision is needed. This is useful when creating large sets of business rules or processes that need to fit together without ambiguity and when creating complex Data Models. As such, it could be advantageous to link to a concept model from the affected Business Process Networks, Workflow Diagrams, Requirements Models and Regulation Diagrams.

Properties and metadata: The Concept Model can for example retain the following information:

  • A description of the diagram
  • Link to the owner of the model
  • Link to the one responsible for the model
  • Link to view of area of usage
  • Audits (auto generated information regarding its current state and access rights)
  • Associated documents, diagrams and other objects
  • Inherent Risk detailing risk considerations
  • Governance information detailing information about the published diagram and who has been involved in the approval of the diagram

The above picture shows the properties dialogue window for the Concept Model, where you can view and edit the diagram’s properties in QualiWare Lifecycle Manager.

For more information: to learn more about Concept Models, you can read the following article:

Ronald G. Ross , “What Is a Concept Model?” Business Rules Journal Vol. 15, No. 10, (Oct. 2014). URL: http://www.brcommunity.com/a2014/b779.html

Business Process Network

Purpose: The purpose of the Business Process Network is to at document a mid- to high-level view of Business Processes and their interrelationships.

Core concerns: The Business Process Network template enables the documentation of top to mid-level processes. The core objects available to model with are Business Processes, Business Events, Business Objects, Business Scope, Information Systems, and different types of connections. Below you can see two examples of a Business Process Network modelled in different styles.

High level process view without business events or connections between processes:

BusinessProcessNetwork_2

High-level process view where business events and connections indicate a flow between processes, stakeholders and customers:

BusinessProcessNetwork_1

Relation to other templates: The top-level processes would typically be broken down to one or more levels of mid-level processes. The last level of Business Process Networks can then be broken down to several Workflow Diagrams or Business Process Diagrams detailing the activities contained within the business process

Properties and metadata: The Business Process Network can for example retain the following information:

  • Description of the diagram
  • Link to the owner of the diagram
  • Link to the one responsible for executing the processes in the diagram
  • Audits (auto generated information regarding its current state and access rights)
  • Associated documents, diagrams and other objects
  • Inherent Risk detailing risk considerations
  • Governance information detailing information about the published diagram and who has been involved in the approval of the diagram

In the picture below you can see the Business Process Network’s properties dialogue window, where the diagrams properties can be viewed and edited:

Business Process Diagram

Purpose: The purpose of the Business Process Diagram template is to enable workflow modelling using the industry standard BPMN (Business Process Modeling Notation).

Core concerns: The Business Process Diagram template supply you with the BPMN icons that enable you to draw a workflow diagram. These icons include different types of events, activities, gateways, connectors, as well as pools, lanes and artifacts such as data objects and messages. The Business Process Diagram is typically used to illustrate business processes and software processes used in requirement documentation. Below is an example of a classic BPMN diagram with swimlanes:

BusinessProcessDiagram_1

To ensure the right BPMN syntax, the Business Process Diagram template will continuously perform Graphic Syntax Checks while you model. When a graphic syntax error occurs, you will be met with an error message like the one shown below:

Other functionalities: The Business Process Diagram can enable the execution and automation of a process when the diagram is converted into XML type files.

If you don’t wish to have a visible pool in your diagram, you can choose to have a ‘default pool’ that doesn’t have to be graphically represented. You can see an example of a diagram without pool and lanes below:

BusinessProcessDiagram_2

Relation to other templates: The Business Process Diagram template is exclusively aimed at modeling using the BPMN standard. If the BPMN is not chosen as a mandatory standard, the WorkFlow Diagram template, which has fewer syntax limitations, can be used instead.

The Business Process Diagram is typically linked as a decomposition of a Business Process contained in a Business Process Network template.

Properties and metadata: The Business Process Diagram can for example retain the following information:

  • Description of the diagram
  • Expression and query language
  • Link to the owner of the process
  • Link to the one responsible for executing the process
  • Audits (auto generated information regarding its current state and access rights)
  • Associated documents, diagrams and other objects
  • Inherent Risk detailing risk considerations
  • Governance information detailing information about the published diagram and who has been involved in the approval of the diagram

In the picture above you can see the Business Process Diagram’s properties dialogue window, where the diagram’s properties can be viewed and edited:

For more information: about the BPMN standard please visit OMG’s dedicated website.

Business Process Cooperation Viewpoint : Archimate

Purpose: Designing, deciding

Concerns: Dependencies between business processes, consistency and completeness, responsibilities

Scope: Multiple layer/Multiple aspect

The business process cooperation viewpoint is used to show the relationships of one or more business processes with each other and/or with their environment. It can be used both to create a high-level design of business processes within their context and to provide an operational manager responsible for one or more such processes with insight into their dependencies. Important aspects of business process cooperation are:

  • Causal relationships between the main business processes of the enterprise
  • Mapping of business processes onto business functions
  • Realization of services by business processes
  • Use of shared data

Each of these can be regarded as a “sub-viewpoint” of the business process cooperation viewpoint.

BusinessProcessCoopViewpoint.docx

Business Diagram

Purpose: The purpose of a Business Diagram is to show the functional structure and relationships of the whole or part of an organization.

Core concerns: The Business Diagram template enables you to model Business Functions, Information Systems, Inventory, Business Scope, Lines of Business, Information Flow and Logistical Flow. The diagram’s syntax can be extended to also include strategic elements such as Goals, Objectives, Stakeholders and Performance Indicators.

The Business Diagram should be broken down into several levels of recurring Business Diagram templates. In the model below, you can see an example of a high-level Business Diagram showing Business Functions and their Information Flows and Logistical Flows –  describing the flow of products and services – in this case for a car rental service.

The Business Functions are placed with the operational functions in the bottom together with the Logistical Flow and with management control at the top of the Business Diagram.

On lower levels (decompositions) of Business Diagrams, Information Systems are placed close to the Business Functions that are responsible for or own the Information Systems.

Relation to other templates: The Business Diagram can be used as an addition to a Business Process Network and Strategy Models, giving a practical view of how the organizations functions fit together, illuminating interdependencies.

Properties and metadata: The Business Diagram can for example retain the following information:

  • A description of the diagram
  • Link to the owner of the Diagram
  • Link to the one responsible for the Diagram
  • Indication of the diagram portrays an as-is situation or a to-be situation
  • The Perspective can be defined as either: Holistic, Sub-functional, Process, or IT Focused.
  • Audits (auto generated information regarding its current state and access rights)
  • Associated documents, diagrams and other objects
  • Inherent Risk detailing risk considerations
  • Governance information detailing information about the published diagram and who has been involved in the approval of the diagram

The above picture shows the properties dialogue window for the Business Diagram where you can view and edit the diagram’s properties in QualiWare Lifecycle Manager.

Business Chart

Purpose: The purpose of the Business Chart template is to create different graphs and charts using information from other diagrams and templates. The Business charts can then either be published on a Dashboard and/or stored.

Core concerns: The Business Chart template is concerned with analyzing other templates and models. Therefore, it is not modelled like a typical template, but created using the Chart Wizard found in the template’s property window:

Below, you can see the Chart Wizard that helps you create your Business Chart:

The Business Chart template can for example be used to generate a chart over how the capabilities or Key Performance Indicators of an enterprise are performing over time or compared to desired values. Additionally, Business Charts can be used to analyze static data entered in a Matrix model. You choose the input to your Business Chart as a ‘Data Source’ in the templates metadata (see figure under Metadata).

Below, you can see two very different examples of business charts:

BusinessChart_2


BusinessChart_1

Relation to other templates: The Business Charts are published using the Dashboard template.

 Properties and metadata: The Business Chart template can for example retain the following information:

  • A description of the diagram
  • Link to the owner of the business chart
  • Link to the one responsible for the business chart
  • Link to data source
  • Audits (auto generated information regarding its current state and access rights)
  • Associated documents, diagrams and other objects
  • Inherent Risk detailing risk considerations
  • Governance information detailing information about the published diagram and who has been involved in the approval of the diagram

The above picture shows the properties dialogue window for the Business Chart Template where you can view and edit the diagram’s properties in QualiWare Lifecycle Manager.