Product Canvas

Purpose: The purpose of the Product Canvas template is to present the relevant information related to a specific product.

Core concerns: The Product Canvas template enables you to gather relevant Business Charts and model Personae, Product Demands, Markets, Locations and Products. Additionally, you can model a SWOT analysis that details the Strengths, Weaknesses, Opportunities and Threats the product is affected by.

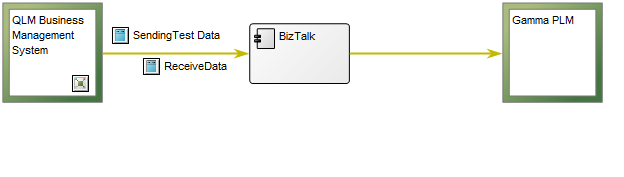
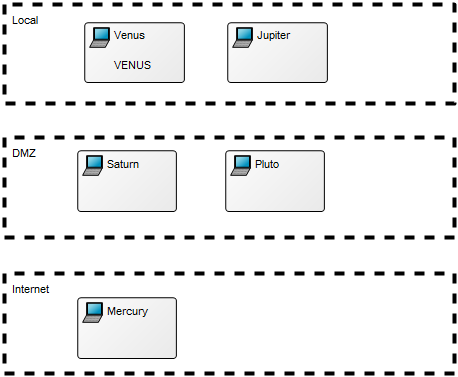
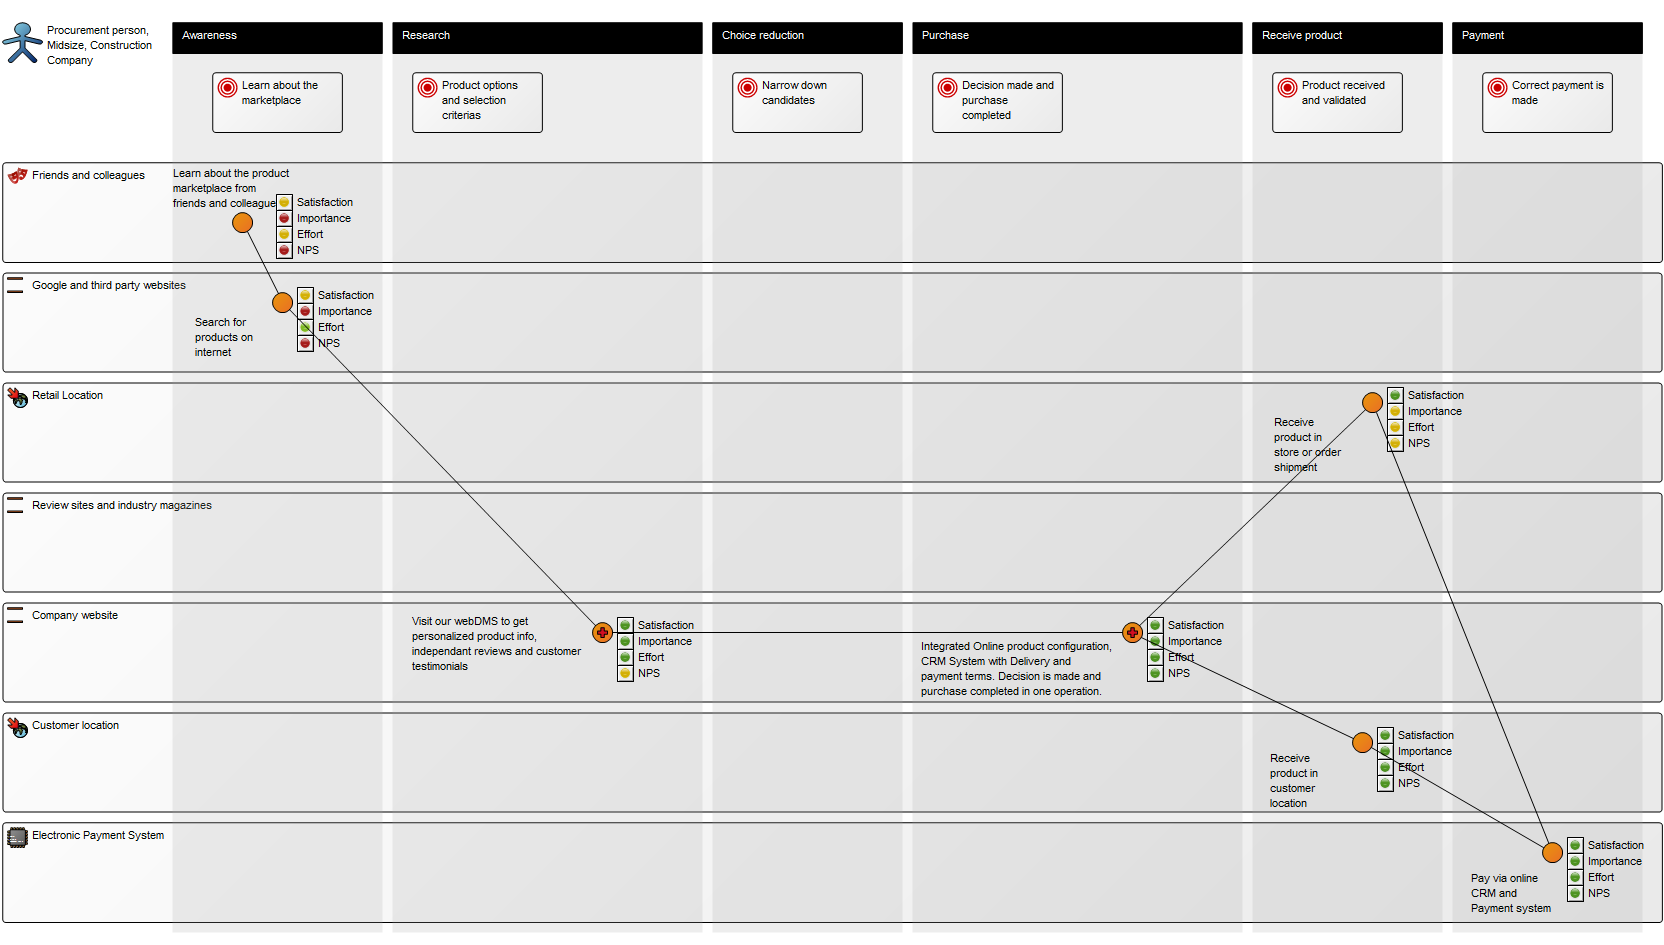
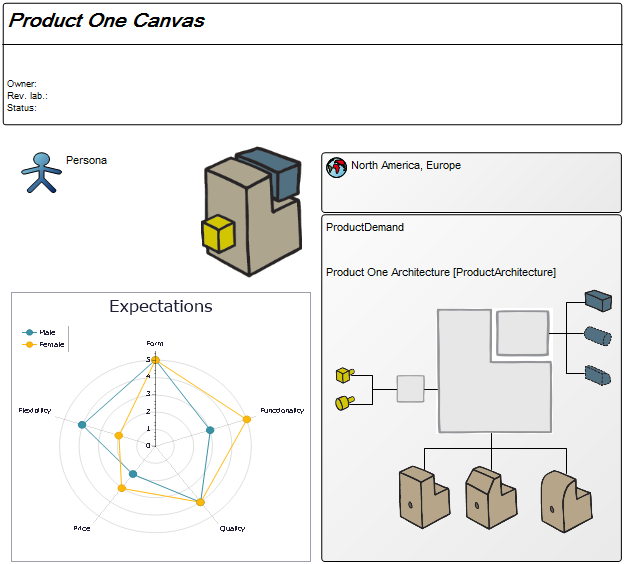
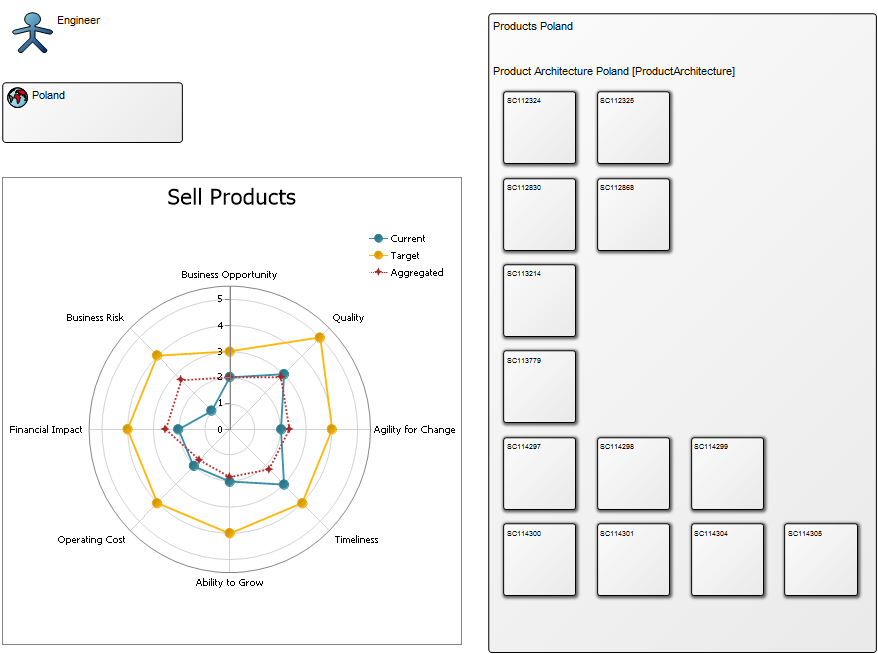
Below, you can see two Product Canvases. The first has its focus on a product within two markets, showing the expectations two different customer segments have to the product.

ProductCanvas_2

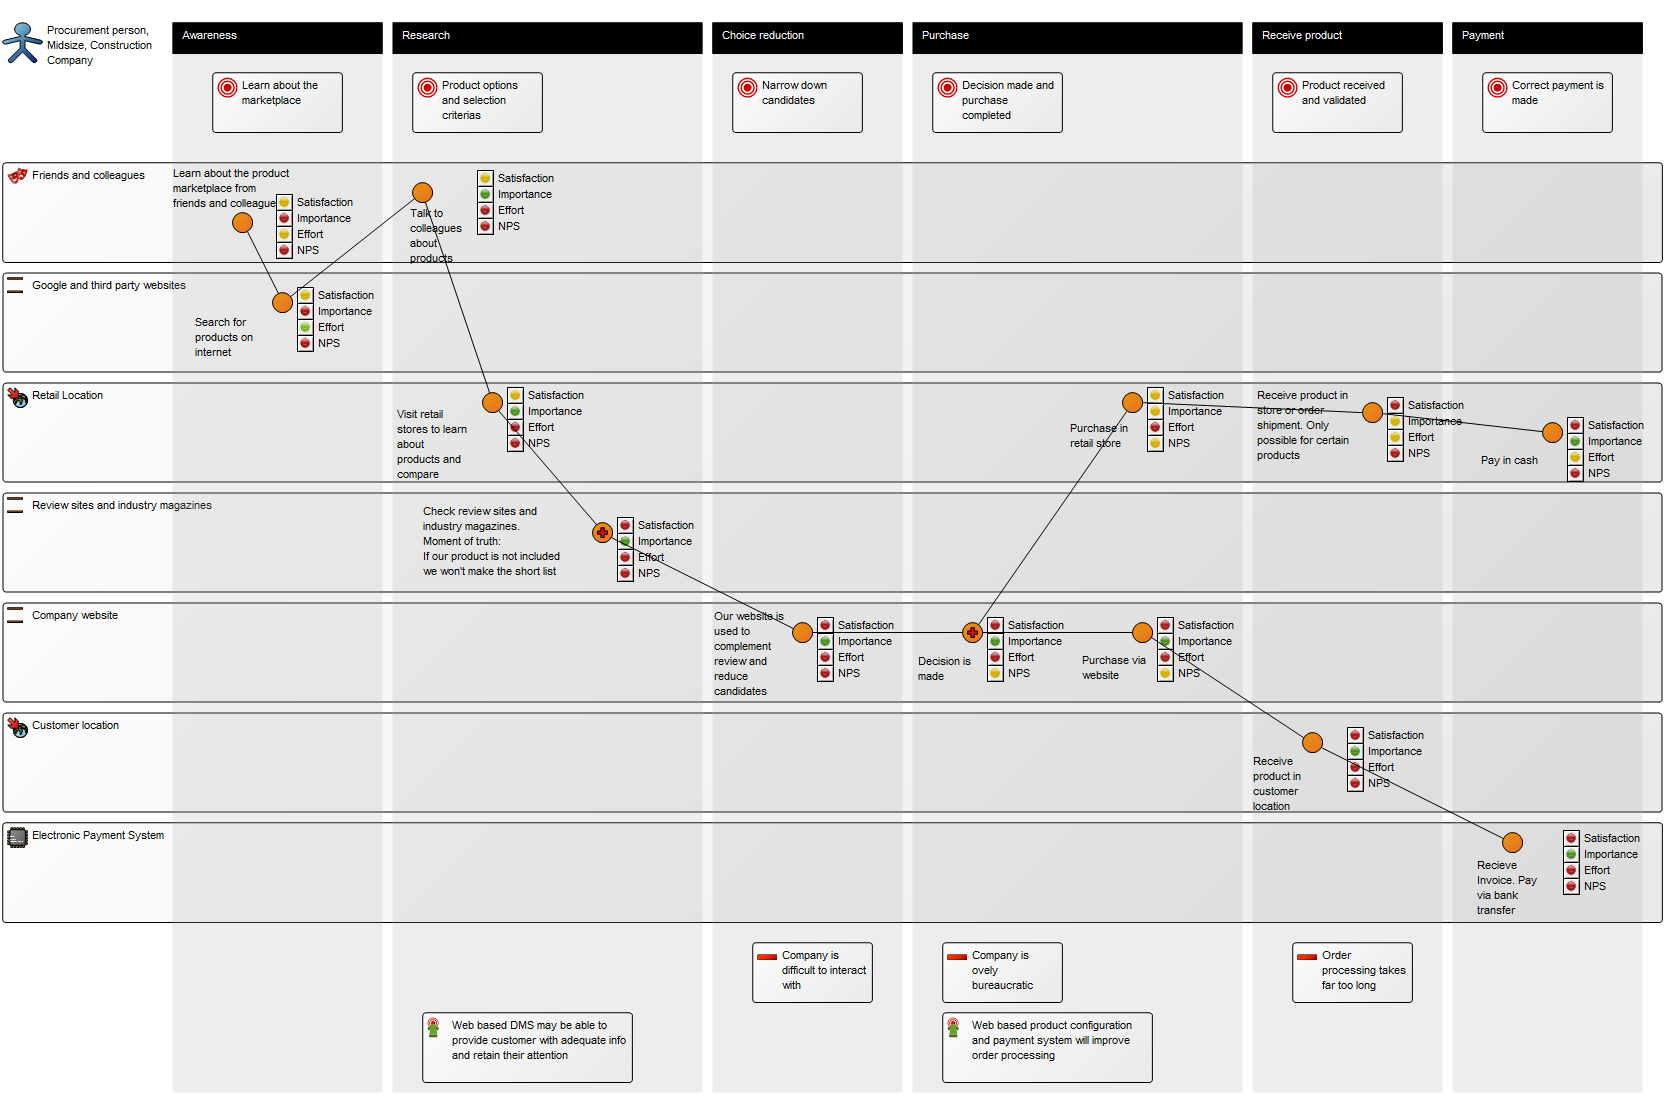
The second example shows information related to a specific market, Poland, including product architecture and business assessment:

ProductCanvas_1

Relation to other templates:

The Product Canvas Template is inherently related to the Product Architecture, Product Roadmap and Product Variant Master, in the sense that all these models focus on different aspects of the lifecycle of a product. Furthermore, you can create additional Business Charts for the Product Canvas by using the dedicated template. Another view on projects and initiatives are provided from the Enterprise Investment Portfolio. There, the reasoning behind the investment in the project is visualized by connecting the initiative (in this case a new product) to the specific goals of the enterprise that it contributes to. Another view on how the product meets customer needs can be documented in the Value Proposition Canvas.

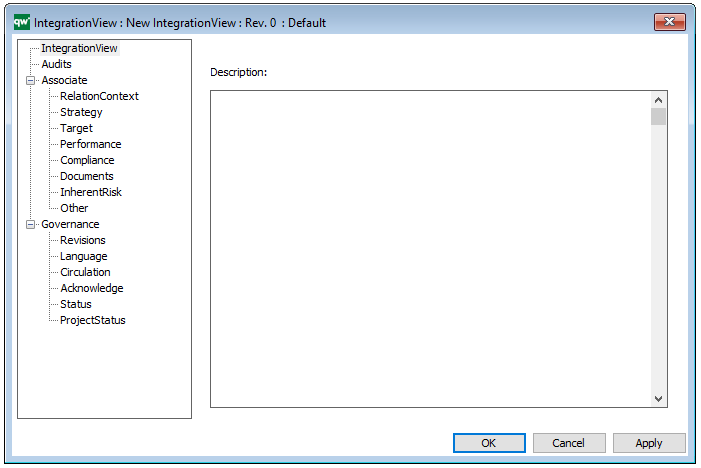
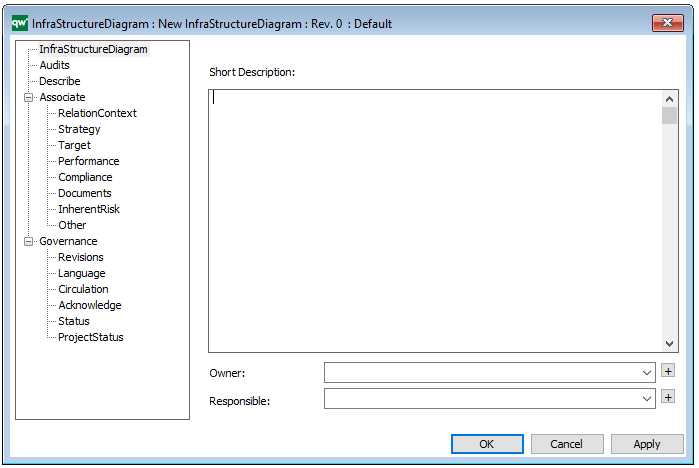
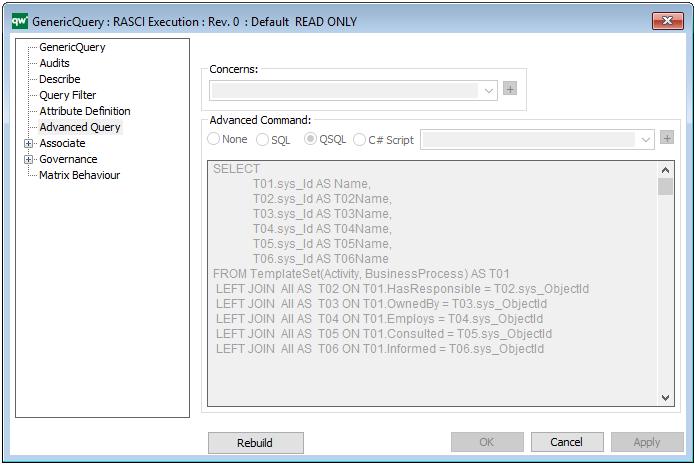
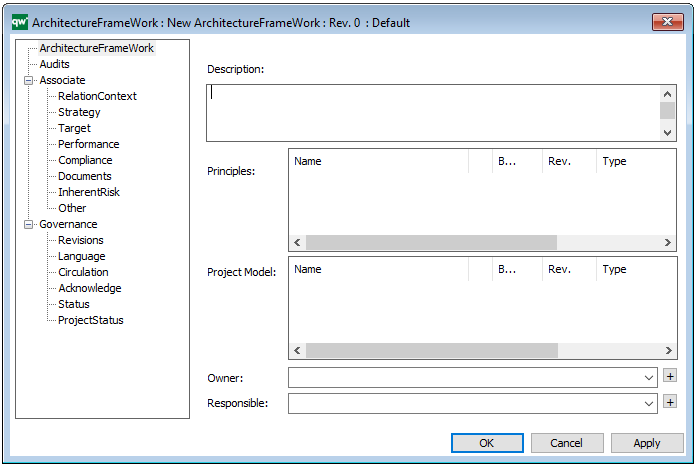
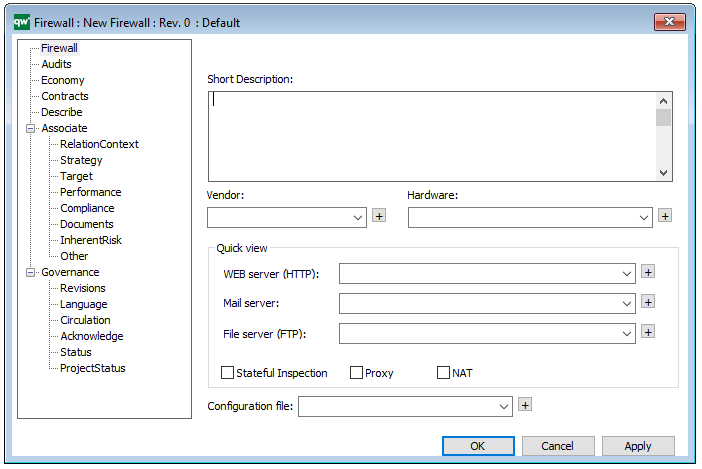
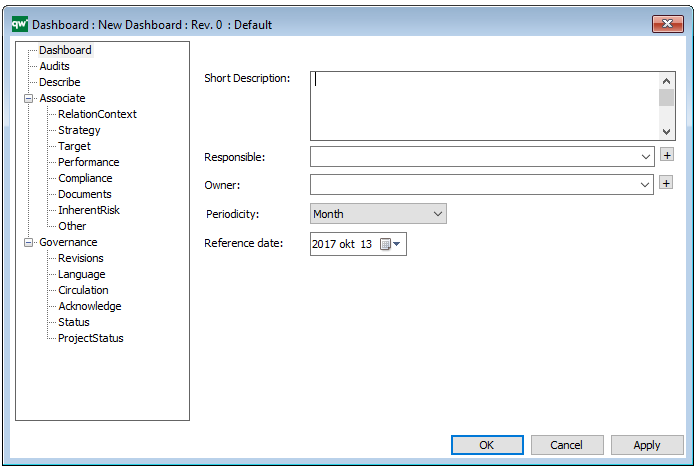
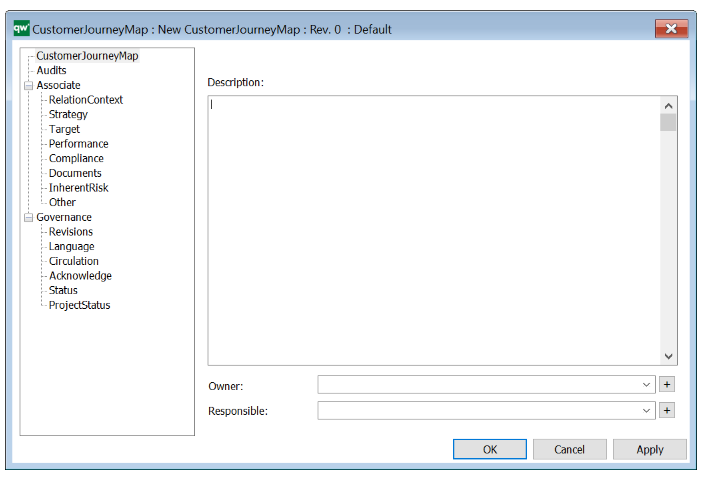
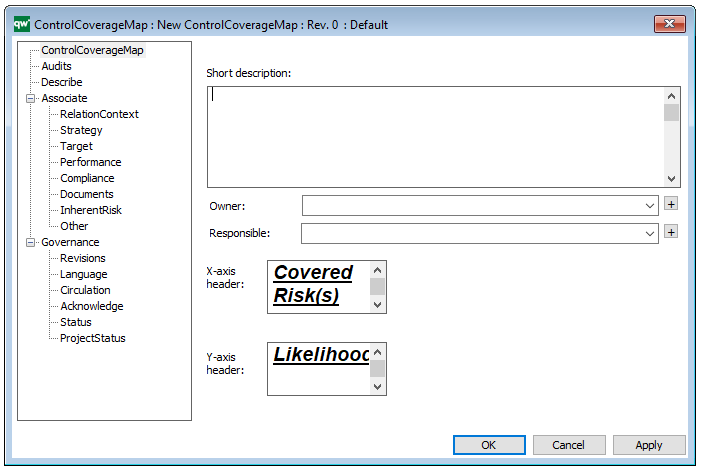
Properties and metadata: The Product Canvas can for example retain the following information:

  • A description of the diagram
  • Link to the owner of the canvas
  • Link to the one responsible for the canvas
  • Audits (auto generated information regarding its current state and access rights)
  • Associated documents, diagrams and other objects
  • Inherent Risk detailing risk considerations
  • Governance information detailing information about the published diagram and who has been involved in the approval of the diagram

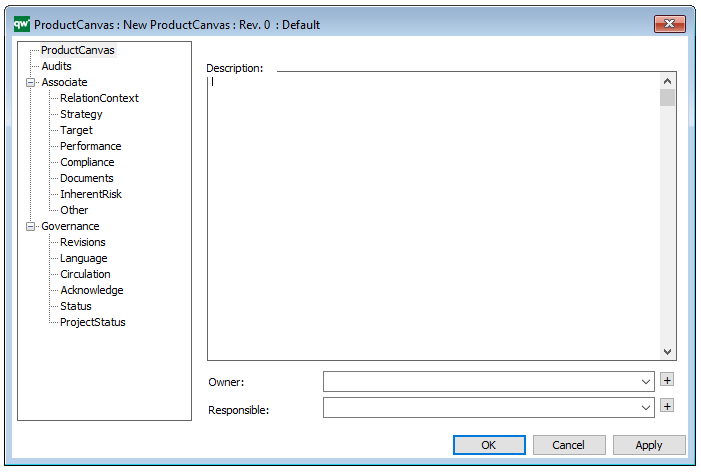
The above picture shows the properties dialogue window for the Product Canvas where you can view and edit the diagram’s properties in QualiWare Lifecycle Manager.

Integration View

Purpose: The purpose of the Integration View template is to document the routing of integrations between systems.

Core concerns: The Integration View template enables you to model Information Systems, System Components and External Entities (a source to or a receiver of information from a system), and connect them using Integration Flows.

Below is an example of an Integration View concerning the flow of test data:

Relation to other templates: The Integration View belongs to the Application layer of the architecture and is as such related to the Application Architecture Diagram, the Data Flow Diagram and the Component Diagram.

Properties and metadata: The Integration View template can for example retain the following information:

  • A description of the model
  • Audits (auto generated information regarding its current state and access rights)
  • Associated documents, diagrams and other objects
  • Inherent Risk detailing risk considerations
  • Governance information detailing information about the published diagram and who has been involved in the approval of the diagram

The above picture shows the properties dialogue window for the Integration View template where you can view and edit the diagram’s properties in QualiWare Lifecycle Manager.


Infrastructure Diagram

Purpose: The purpose of the Infrastructure Diagram template is to document the physical infrastructure of the enterprise, which includes but is not limited to databases, wires, firewalls, computers etc.

Core concerns: The Infrastructure Diagram enables you to model your organizations infrastructure including: Computer Categories, Computers, Firewalls, Printers, Networks, Connection Points, Peripherals, Locations, Information Systems, System Components, Databases, Network Connections, Object Dependencies, Technology Domains, Technology Capabilities and Technology Components.

The models below exemplify how you would construct this type of diagram:

InfraStructureDiagram_1

InfraStructureDiagram_2

Relation to other templates: The Infrastructure Diagram template should not be used to document logical architecture, as the connections available in an Infrastructure Diagram are predominately geared towards documenting physical information about IT infrastructure. The Infrastructure Diagram can through its components be linked to other architectural diagrams such as the Application Architecture Diagram, and the data they contain. This way, if a firewall is breached, you would be able to very quickly identify what data has been vulnerable.

Properties and metadata: The Infrastructure Diagram can for example retain the following information:

  • A description of the diagram
  • Link to the owner of the diagram
  • Link to the one responsible for the diagram
  • Audits (auto generated information regarding its current state and access rights)
  • Associated documents, diagrams and other objects
  • Inherent Risk detailing risk considerations
  • Governance information detailing information about the published diagram and who has been involved in the approval of the diagram


The above picture shows the properties dialogue window for the Infrastructure Diagram, where you can view and edit the diagram’s properties in QualiWare Lifecycle Manager.

Generic Query

Purpose: The Purpose of the Generic Query template is to provide datasets for QualiWare System templates.

Core concerns: The Generic Query template is an auxiliary template. The Generic Query can be created using a Query Design template which enables you to easily structure the query for creating reports. When creating a Report for a diagram, the Generic Query created using the Query Design should be used as a Data Set in the Report Definition.

A Generic Query can also be generated using its Property Dialog, where you can link to Data Source and filter the data selection using a wizard – see example of the property dialog below:

The Generic Query can, for example, take the form of data sheets:

GenericQuery_2

The Generic Query template can also execute a command using the Advanced Query tab:

Relation to other templates: Generic Queries are automatically created when creating a Query Design. Generic Queries are used in the following templates: HTML Template Definitions, HTML Embedded content, HTML Publisher and HTML Content tab.

Properties and Metadata: The Generic Query can for example rentain the following information:

  • A description
  • Audits (auto generated information regarding its current state and access rights)
  • Query Filter, including a wizard for filter options
  • Attribute Definition
  • Advanced Query
  • Matrix Behavior

The above picture shows the properties dialogue window for the Generic Query where you can view and edit the diagram’s properties in QualiWare Lifecycle Manager.


Firewall

Purpose: The purpose of the Firewall template is to document network zones designated by firewalls.

Core concerns: The Firewall template enables you to model Zones, Computers, Networks and Firewall Policies to create a model of a firewall. A firewall is used to control the communication between different networks, typically for security reasons.

Graphical representation of objects:

A Firewall diagram will typically show the Zones of the firewall and the communication policies/rules (Firewall Policies) that exist between the zones. Below, you can see an example of a Firewall diagram containing Zones and Servers (represented by the Computer object):

Firewall_1

Relation to other templates: The Firewall template is a technology template and related to the Infrastructure Diagram.

Properties and metadata: The Firewall template ­­­­can for example retain the following information:

  • A description of the diagram
  • Link to Vendor and Hardware
  • Link to servers
  • Contract information
  • Details about resources, costs and benefits
  • Audits (auto generated information regarding its current state and access rights)
  • Associated documents, diagrams and other objects
  • Inherent Risk detailing risk considerations
  • Governance information detailing information about the published diagram and who has been involved in the approval of the diagram


The above picture shows the properties dialogue window for the Firewall template, where you can view and edit the diagram’s properties in QualiWare Lifecycle Manager.

Dashboard

Purpose: The purpose of the Dashboard template is to publish selections of Business Charts targeting different stakeholders. It should be used to gather a series of relevant or connected Business Charts to provide a dashboard-like overview.

Core concerns: The Dashboard template enables you to gather Business Charts, Key Performance Indicators, Performance Indicators and General Concepts to create stakeholder specific views of analyzed data. For example, an Enterprise Architect could find a Dashboard containing Business Charts relevant to the usage and governance of the Enterprise Architecture useful.

Below, you can see examples of different Dashboards presenting an array of Business Charts:

Dashboard_1


Dashboard_2

Relation to other templates: The Dashboard template is closely connected to the Business Chart template, as the Dashboard publishes the charts the Business Chart template generates.

Properties and metadata: The Dashboard can for example retain the following information:

  • A description of the Dashboard
  • Link to the owner of the Dashboard
  • Link to the one responsible for the Dashboard
  • Audits (auto generated information regarding its current state and access rights)
  • Associated documents, diagrams and other objects
  • Inherent Risk detailing risk considerations
  • Governance information detailing information about the published diagram and who has been involved in the approval of the diagram

The above picture shows the properties dialogue window for the Dashboard template where you can view and edit the dashboard’s properties in QualiWare Lifecycle Manager.

Customer Journey Map

Purpose: The Purpose of the Customer Journey Map template is to document the customer’s journey from awareness to the end of their interaction with an organization, covering possible touch points from the customer’s perspective.

Core Concerns: The Customer Journey Map template allows you to model connections between different Personas, Customer Journey Phases, Touch Points, Goals, Roles, Locations, Channels, Technology and the aspects from a SWOT analysis.

You can choose to model both a current state and a desired future state of the customer journey and use the documentation for process improvement. Below is an example of a current state model and a future state model:

Current state model:

CustomerJourneyMap_2

Desired future model:

CustomerJourneyMap_1

Other functionalities: The customer’s touchpoints can be elaborated upon with four scores for Customer Satisfaction, Customer Importance, Customer Effort and Net Promoter Score. Particularly vital touchpoints can be designated as a Moment of Truth.

Relation to other templates: The Customer Journey Map can be used as a groundwork for a strategic change, which for example can be modelled in a Work Model, a Business Capability Model and/or a Strategy Model.

Properties and metadata: The Customer Journey Map can for example retain the following information:

  • A description of the diagram
  • Link to the owner of the diagram
  • Link to the one responsible for the accuracy of the diagram
  • Audits (auto generated information regarding its current state and access rights)
  • Associated documents, diagrams and other objects
  • Inherent Risk detailing risk considerations
  • Governance information detailing information about the published diagram and who has been involved in the approval of the diagram
  • Project status: information about budgeted and actual man-hours spent, percentage completed and the latest milestone, result and quality control of a change process.

The above picture shows the properties dialogue window for the Customer Journey Map, where you can view and edit the diagram’s properties.

For more information: on Customer Journey Mapping, please view our webinar Experience Mapping – Customer Obsession for IT and Digital Professionals with Milan Guenther and Katharina Weber.


Control Coverage Map

Purpose: The purpose of the Control Coverage Map is to provide an overview of uncovered risks, residual risks and potential cost of the risk occurring.

Core concerns: The Control Coverage Map concerns itself with Financial Risk Management and is created using the Actions tabs in QLM. It can be created based on the information in a Risk Heatmap or by using information from a diagram which contains risks that also have control actions.

Below, you can see an example of a Control Coverage map for four risks related to a Bellhouse, a Pump, a Suction pipe and using Check lists:

ControlCoverageMap

The Blue column represents the likelihood of the risk before the control action, the green column represents the likelihood of the risk after the implementation of a control action. The red columns represent the estimated cost if the risk is realized.

Relation to other templates: The Control Coverage Map presents graphical views of information from other diagrams the same as the Heatmap, Business Charts and the Graphical Matrix. It can be used by any diagram containing Activities with attached risks that have control activities.

Properties and metadata: The Control Coverage Map ­­­­can for example retain the following information:

  • A description
  • Link to the owner
  • Link to the one responsible
  • Graphical specification for the headers of the X-axis and Y-axis
  • Audits (auto generated information regarding its current state and access rights)
  • Associated documents, diagrams and other objects
  • Inherent Risk detailing risk considerations
  • Governance information detailing information about the published diagram and who has been involved in the approval of the Control Coverage Map

The above picture shows the properties dialogue window for the Control Coverage Map template where you can view and edit the template’s properties in QualiWare Lifecycle Manager.

Communication Diagram

Purpose: The purpose of the Communication Diagram template is to document interactions between objects or parts, focusing on sequenced messages.

Core concerns: The Communication Diagram template is a simplified UML 2.0 alternative to the UML Collaboration Diagram. It enables you to model Lifelines and Annotation, which can be connected by messages.

Below you can see a simple example of a Communication Diagram:

CommunicationDiagram_1

Relation to other templates: Usually, Communication Diagrams would be modeled using information from Class Diagram, Sequence Diagram, and Use case diagram. It is related to the other UML interaction diagrams: Sequence Diagram, Interaction overview diagram and Timing Diagram.

While the Communication Diagram show much of the same information a Sequence Diagram does, the Communication Diagram conveys which elements each one interacts with better, while sequence diagrams show the order in which the interactions take place more clearly.

Other UML diagrams that QualiWare support include: Activity Diagram, Communication Diagram, Deployment Diagram, , Composite Structure Diagram, State Diagram, Package Diagram, Component Diagram, Composite structure Diagram, and Object Diagram.

Properties and metadata: The Communication Diagram ­­­­can for example retain the following information:

  • A description of the diagrams
  • Link to related sequence diagram
  • Extensions (Stereotype, Constraints and Tagged values)
  • Audits (auto generated information regarding its current state and access rights)
  • Associated documents, diagrams and other objects
  • Inherent Risk detailing risk considerations
  • Governance information detailing information about the published diagram and who has been involved in the approval of the diagram

The above picture shows the properties dialogue window for the Communication diagram, where you can view and edit the diagram’s properties in QualiWare Lifecycle Manager.

For more information: about the UML, please visit the Object Management Group’s Website, where you can find the complete specification.

Business Ecosystem

Purpose: The purpose of the Business Ecosystem template is to enable an organization to understand itself from an outside-out perspective by modelling the environment in which the organization is embedded.

Core concerns: The Business Ecosystem supplies five elements to model with: Business, People, Things, Business Interaction and Business Moment. The Business Ecosystem template should primarily be used for modeling entities outside the enterprise to identify new business opportunities in the form of Business Moments.

BusinessEcoSystem

Above you can see a model of a Business Ecosystem. The blue areas are Business Moments, where the interactions between People, Businesses and Things create business opportunities for your enterprise.

Relation to other templates: The Business Ecosystem model is based on the Enterprise Design theories and is as such in the same family as the Customer journey map.

The Business Ecosystem is a strategic model and can be used to document a strategic possibility or track along with for example Business Capability Models, Strategy Models, and Work Models.

Properties and metadata: The Business Ecosystem can for example retain the following information:

  • A description of the diagram
  • Link to the owner of the application architecture
  • Link to the one responsible for the application architecture
  • Audits (auto generated information regarding its current state and access rights)
  • Associated documents, diagrams and other objects
  • Inherent Risk detailing risk considerations
  • Governance information detailing information about the published diagram and who has been involved in the approval of the diagram
  • Project status: information about budgeted and actual man-hours spent, percentage completed and the latest milestone, result and quality control of a change process.

For more information: If you want to learn more about Enterprise Design, we have a four-part webinar by Milan Guenther available for viewing. You can also visit Milan’s website, where you can learn more about the Enterprise Design framework.