Lifecycle Assessment Diagram

Purpose: The purpose of the Life Cycle Assessment Diagram template is to document the relations for an activity or product in a lifecycle context.

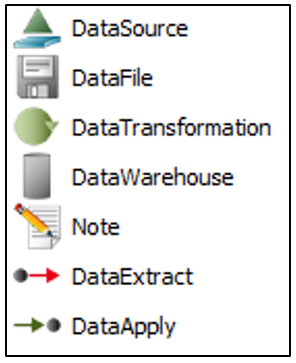
Core concerns: The Lifecycle Assessment Diagram concerns itself with modelling elements in a company that interact with the environment. The template enables you to model Environmental Aspects and Objectives for Activities in your organization. This template allows you to model Business Objects, Activities, Performance Indicators, Business Connection, Goals, Policies, Critical Success Factors, Change Requests and Problems. These elements can be grouped into Categories and connected by Impact Quantity, Recycling, Logistical Flows, Information Flows, and Activity Paths.

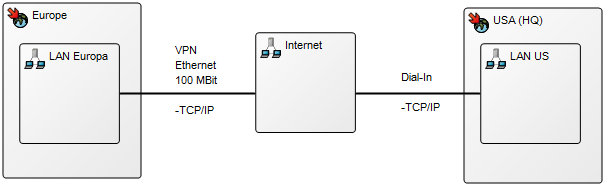
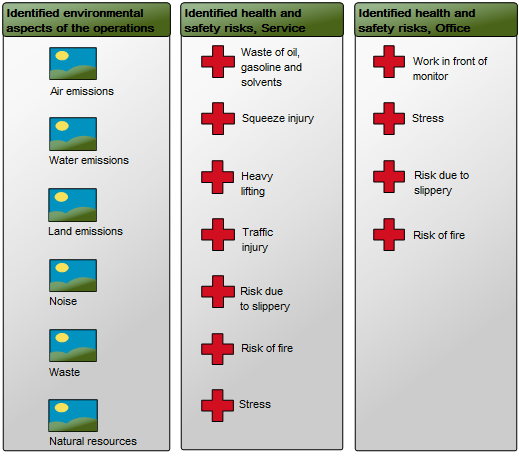
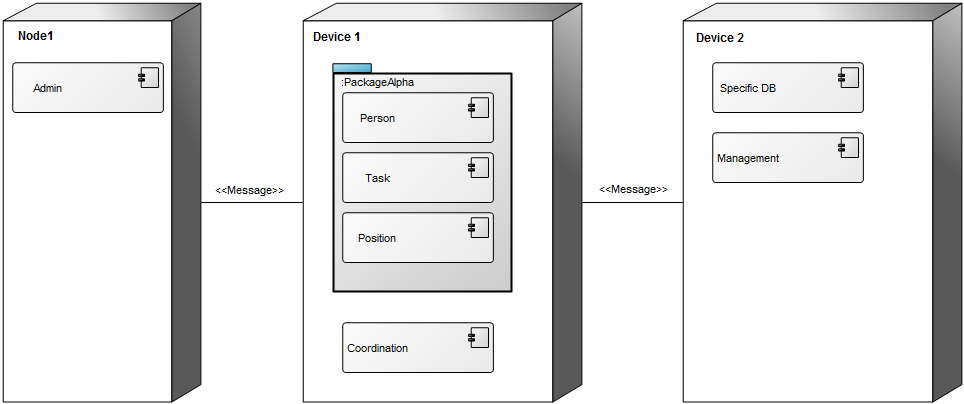
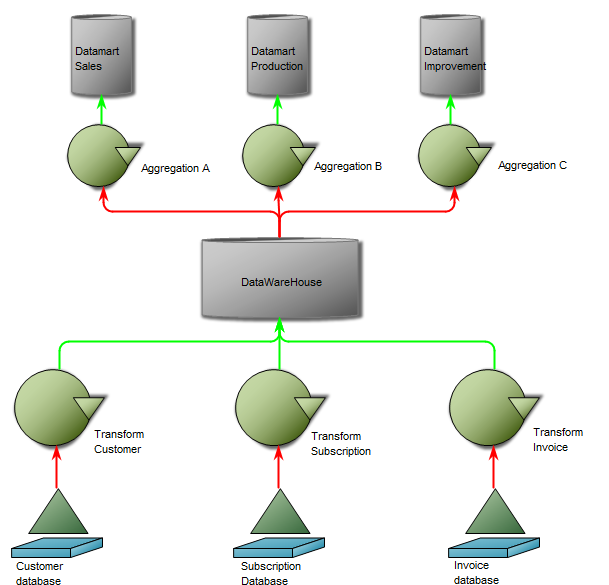
Below, you can see an example of a Lifecycle Assessment Diagram for a Product, from production to packaging, focusing on reducing unbiodegradable waste:

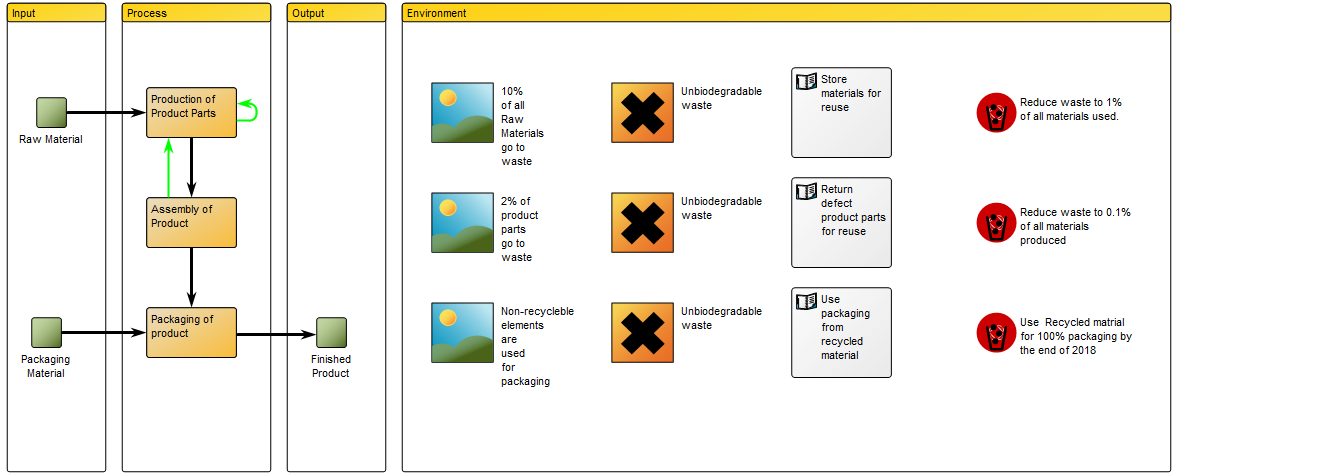
The elements used in this example are Business Objects as input and output, Activities showing Logistical Flows and Recycle under Process. Under the Environment Category, Environmental Aspects, Impact and Objectives are identified and Policies for reaching the Objectives are also included. The diagram focus on a single Environmental impact: Waste. You can also choose to map out several Environmental impacts that are relevant to a specific activity or product.

Relation to other templates: The Environmental Aspects and Impacts from the Lifecycle Assessment Diagram can be further explored in the Environmental Impact Diagram. The Lifecycle Assessment Diagram is also related to the Business Process Diagram and Workflow Diagram, in the sense that they all are related to detailing aspects of processes. The Lifecycle Assessment Diagram can also be decomposed from the Inventory object shown in, for example, the Production Site template.

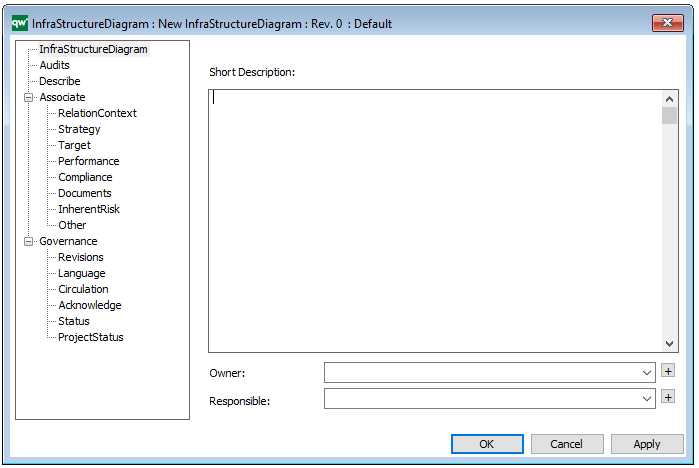
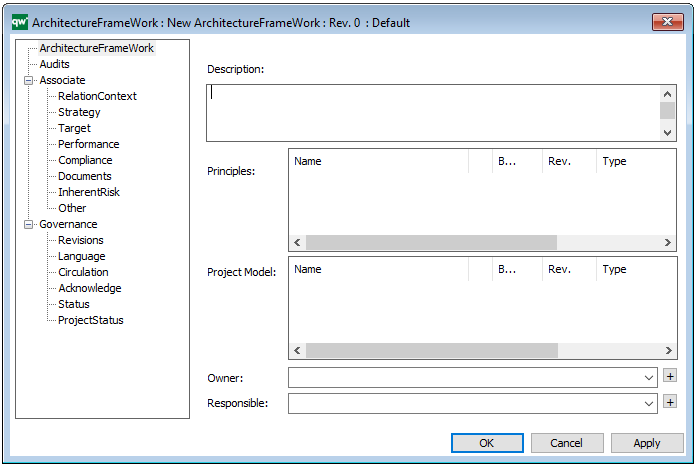
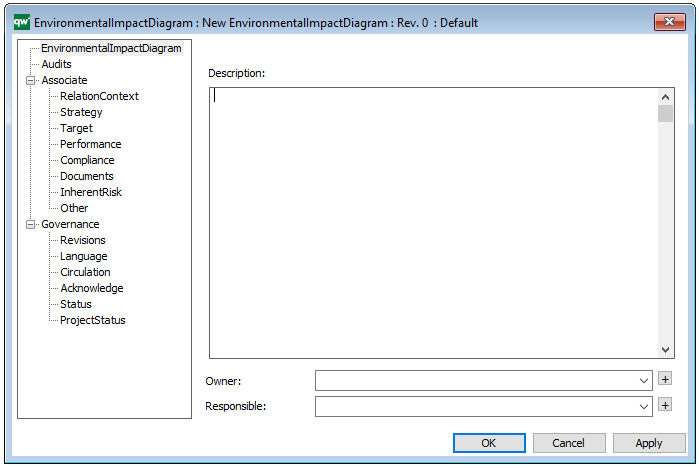
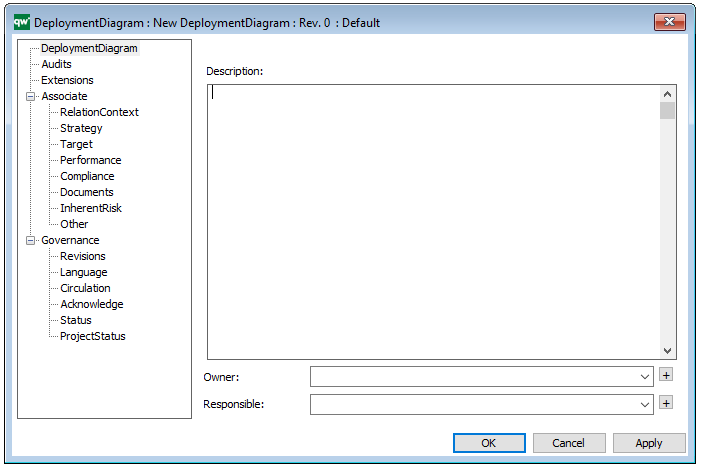
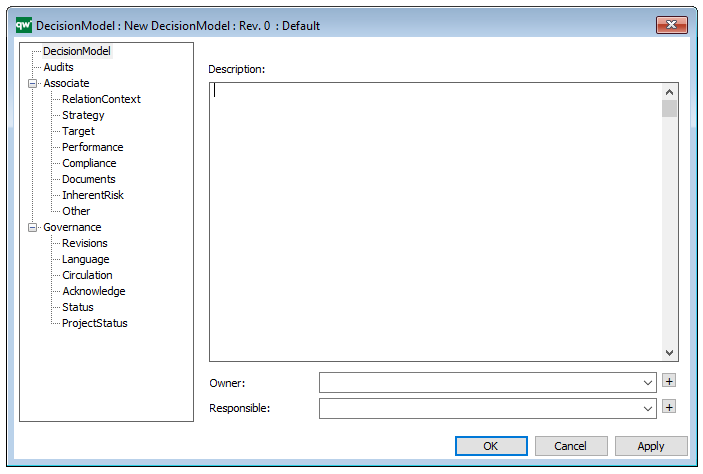
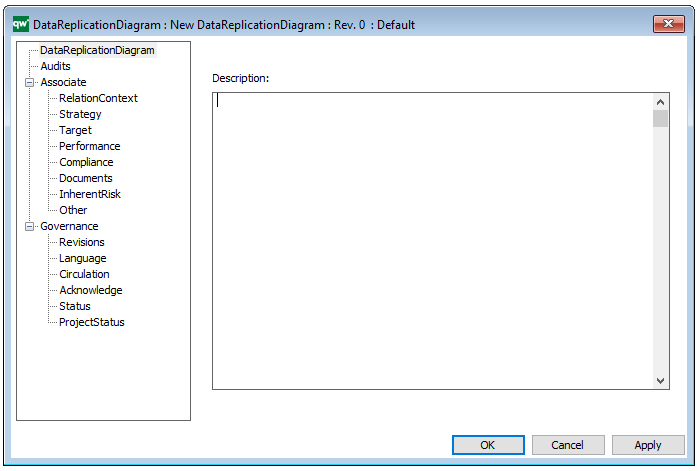
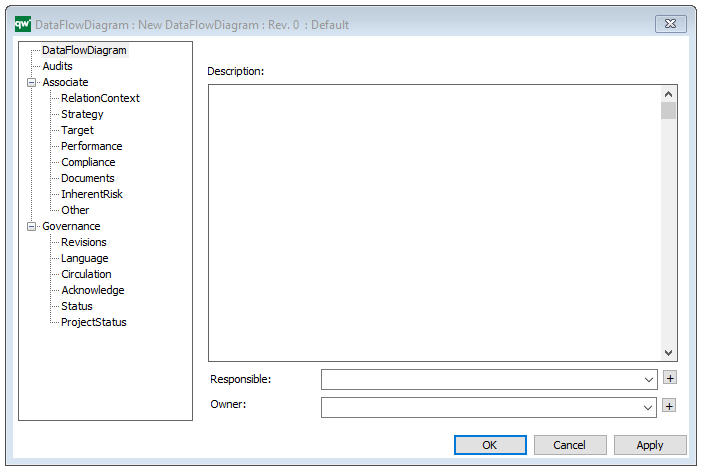
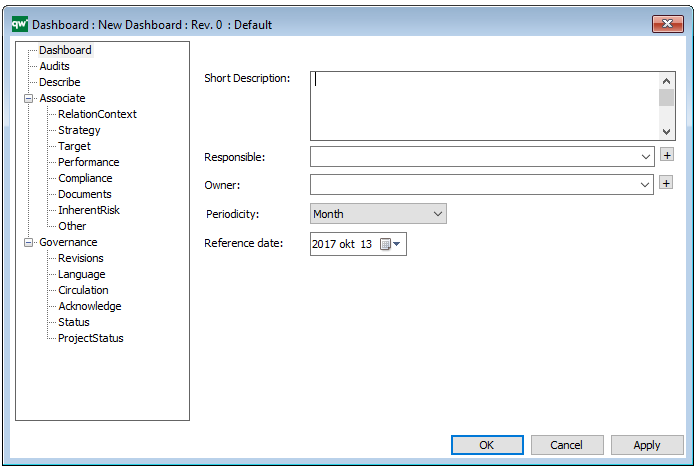
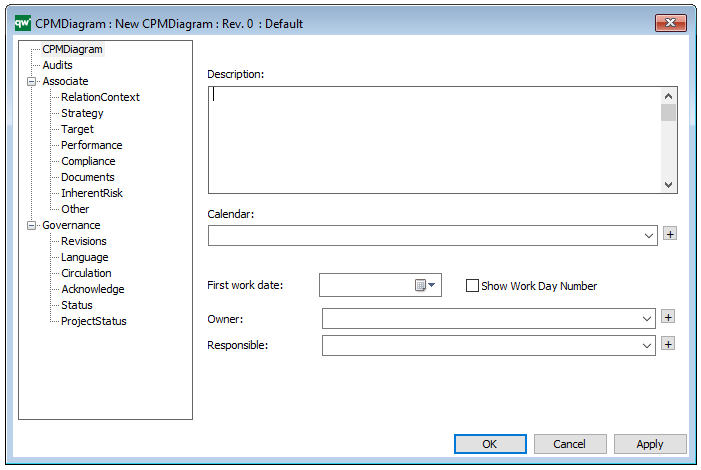
Properties and metadata: The Lifecycle Assessment Diagram template ­­­­can for example retain the following information:

  • A description of the diagram
  • Link to the owner of the diagram
  • Link to the one responsible for the diagram
  • Audits (auto generated information regarding its current state and access rights)
  • Associated documents, diagrams and other objects
  • Inherent Risk detailing risk considerations
  • Governance information detailing information about the published diagram and who has been involved in the approval of the diagram

The above picture shows the properties dialogue window for the Lifecycle Assessment Diagram template, where you can view and edit the diagram’s properties in QualiWare Lifecycle Manager.

For more information: You can learn more about Lifecycle Assessment on the US Sustainable Facilities Tool website or turn to ISO standard 14040.

Infrastructure Diagram

Purpose: The purpose of the Infrastructure Diagram template is to document the physical infrastructure of the enterprise, which includes but is not limited to databases, wires, firewalls, computers etc.

Core concerns: The Infrastructure Diagram enables you to model your organizations infrastructure including: Computer Categories, Computers, Firewalls, Printers, Networks, Connection Points, Peripherals, Locations, Information Systems, System Components, Databases, Network Connections, Object Dependencies, Technology Domains, Technology Capabilities and Technology Components.

The models below exemplify how you would construct this type of diagram:

InfraStructureDiagram_1

InfraStructureDiagram_2

Relation to other templates: The Infrastructure Diagram template should not be used to document logical architecture, as the connections available in an Infrastructure Diagram are predominately geared towards documenting physical information about IT infrastructure. The Infrastructure Diagram can through its components be linked to other architectural diagrams such as the Application Architecture Diagram, and the data they contain. This way, if a firewall is breached, you would be able to very quickly identify what data has been vulnerable.

Properties and metadata: The Infrastructure Diagram can for example retain the following information:

  • A description of the diagram
  • Link to the owner of the diagram
  • Link to the one responsible for the diagram
  • Audits (auto generated information regarding its current state and access rights)
  • Associated documents, diagrams and other objects
  • Inherent Risk detailing risk considerations
  • Governance information detailing information about the published diagram and who has been involved in the approval of the diagram


The above picture shows the properties dialogue window for the Infrastructure Diagram, where you can view and edit the diagram’s properties in QualiWare Lifecycle Manager.

Generic Query

Purpose: The Purpose of the Generic Query template is to provide datasets for QualiWare System templates.

Core concerns: The Generic Query template is an auxiliary template. The Generic Query can be created using a Query Design template which enables you to easily structure the query for creating reports. When creating a Report for a diagram, the Generic Query created using the Query Design should be used as a Data Set in the Report Definition.

A Generic Query can also be generated using its Property Dialog, where you can link to Data Source and filter the data selection using a wizard – see example of the property dialog below:

The Generic Query can, for example, take the form of data sheets:

GenericQuery_2

The Generic Query template can also execute a command using the Advanced Query tab:

Relation to other templates: Generic Queries are automatically created when creating a Query Design. Generic Queries are used in the following templates: HTML Template Definitions, HTML Embedded content, HTML Publisher and HTML Content tab.

Properties and Metadata: The Generic Query can for example rentain the following information:

  • A description
  • Audits (auto generated information regarding its current state and access rights)
  • Query Filter, including a wizard for filter options
  • Attribute Definition
  • Advanced Query
  • Matrix Behavior

The above picture shows the properties dialogue window for the Generic Query where you can view and edit the diagram’s properties in QualiWare Lifecycle Manager.


Environmental Impact Diagram

Purpose: The purpose of the Environmental Impact Diagram template is to document the environmental aspects and impacts for an Activity or Business Process.

Core concerns: The Environmental Impact Diagram enables you to model Business Functions, Activities, Business Objects, Environmental Aspects (Environmental Aspect, Environmental Impact, Health and safety impact) and Business Scopes. These elements can then be connected by Impact Quantities.

Below, you can see an example of an Environmental Impact Diagram, detailing the Environmental aspects and Health and safety impact:

EnvironmentalImpactDiagram_1

The diagram shows all identified aspects and modes of impact for one or more specific processes.

Relation to other templates: The Environmental Impact Diagram is related to the Lifecycle Assessment diagram as well as templates containing Activities, Business Functions, Lines of Business, and Logistical Flows. As such, it is related to, for example, Business Process Diagrams, Workflow Diagrams, Business Diagrams, and Strategy Models.

Properties and metadata: The Environmental Impact Diagram template ­­­­can for example retain the following information:

  • A description of the diagram
  • Link to the owner
  • Link to the responsible
  • Audits (auto generated information regarding its current state and access rights)
  • Associated documents, diagrams and other objects
  • Inherent Risk detailing risk considerations
  • Governance information detailing information about the published diagram and who has been involved in the approval of the diagram

The above picture shows the properties dialogue window for the Environmental Impact Diagram, where you can view and edit the diagram’s properties in QualiWare Lifecycle Manager.

Deployment Diagram

Purpose: The purpose of the Deployment Diagram is to document the configuration of run-time processing nodes and the components they contain.

Core concerns: The Deployment Diagram template is structural UML diagram that enables you to model Packages, Components, Artifacts, Instance Specifications, Properties, Nodes, Devices, Execution Environments, Deployment Specifications, Objects, Classes, Interfaces, and Annotations. They can then be connected through Association, Dependency, Generalization, Deployment or Manifestation.

The Deployment Diagram models how the different hardware component and software components are connected. Below you can see an example of a Deployment Diagram for a booking service:

DeploymentDiagram_1

In the next example, you can see how Packages and Components would be included in a Deployment Diagram:

DeploymentDiagram_2

Relation to other templates: The Deployment Diagram is, as a component model, part of the application domain on the operational level. As such, it offers a complimentary view to those of the Application Architecture Diagram, Class Diagram, Component Diagram, Data Flow Diagram, Data Mapping Diagram, Data Replication Diagram, Sequence Diagram, State Event Diagram, Structure Chart, and Use Case Diagram.

Properties and metadata: The Deployment Diagram can for example retain the following information:

  • A description of the diagram
  • Link to the owner of the diagram
  • Link to the one responsible for the diagram
  • Links to extensions such as Stereotypes and Constraints
  • Audits (auto generated information regarding its current state and access rights)
  • Associated documents, diagrams and other objects
  • Inherent Risk detailing risk considerations
  • Governance information detailing information about the published diagram and who has been involved in the approval of the diagram

The above picture shows the properties dialogue window for the Deployment Diagram where you can view and edit the diagram’s properties in QualiWare Lifecycle Manager.


Decision Model

Purpose: The purpose of the Decision Model template is to document complex decisions by modelling decision trees that illustrates decision gates. Below you can see an example of a Decision Model:

DecisionModel_1

Core concerns: Complex decisions can be documented as decision trees. The model illustrates the Business Decision and its underlying Rule Families. The Rule Families can contain Rule Family Tables, that precisely describe the outcome of a given set of variables. Below you can see an example of a Rule Family Table:

DecisionModel_2

Relation to other templates: Where the Decision Model template illustrates the decision gates, the end to end process is described in either a Work Flow Diagram or a Business Process Diagram.

Properties and metadata: The Decision Model can for example retain the following information:

  • A description of the diagram
  • Link to the owner of the diagram
  • Link to the one responsible for the accuracy of the diagram
  • Audits (auto generated information regarding its current state and access rights)
  • Associated documents, diagrams and other objects
  • Inherent Risk detailing risk considerations
  • Governance information detailing information about the published diagram and who has been involved in the approval of the diagram
  • Project status: information about budgeted and actual man-hours spent, percentage completed and the latest milestone, result and quality control of a change process.

In the picture below you can see the Decision Model’s properties dialogue window, where the information can be viewed and edited:


Data Replication Diagram

Purpose: The purpose of the Data Replication Diagram template is to map a high-level view of the movement and replication of information between data sources.

Core concerns: The Data Replication Diagram template enables you to map Data Sources, Data Files, Data Transformations and Data Warehouses. These elements can then be connected by either a Data Extract or a Data Apply.

Graphical representation of the elements:

Below, is an example of a Data Replication Diagram for a commercial Data Warehouse:

DataReplicationDiagram_1

The model shows that the data is extracted from different data sources, transformed and applied to the Data Warehouse from which it is extracted, aggregated and either applied to sales, production or improvement.

Relation to other templates: The Data Replication Diagram offers a high-level data mapping. The Data Transformations contained in the Data Replication Diagram can be further decomposed into more detailed Data Mapping Diagrams.

Properties and metadata: The Data Replication Diagram template ­­­­can for example retain the following information:

  • A description of the diagram
  • Audits (auto generated information regarding its current state and access rights)
  • Associated documents, diagrams and other objects
  • Inherent Risk detailing risk considerations
  • Governance information detailing information about the published diagram and who has been involved in the approval it

The above picture shows the properties dialogue window for the Data Replication Diagram, where you can view and edit the diagram’s properties in QualiWare Lifecycle Manager.


Data Flow Diagram

Purpose: The purpose of the Data Flow Diagram is to document a system’s or part of a system’s data flows; the data input the system (or a process within the system) consumes and the data output the system produces.

Core concerns: The Data Flow Diagram enables you to model Processes, Data Stores, External Entities, Control Processes and Control Stores. These elements can then be connected by either Data Flows or Control Flows.

Graphical representation of the elements:

The Data Flow Diagram can show different levels of processes within a system that exchange data, and illustrate how those exchanges occur. As such, the model can document a system’s functional hierarchies.

Below, you can see an example of a Data Flow Diagram showing the Data Flows between several Data Stores, Processes and External Entities in a Bookshop:

DataFlowDiagram_2

The next example shows the Data Flow between process, Data Stores and External Entities for a Highway Repair Service:

DataFlowDiagram_1

The final example shows the Data Flows between Processes, Datastores and External Entities in an Outlook Mailbox:

dfd

Relation to other templates: The Processes in the Data Flow Diagram can be decomposed into more detailed Data Flow Diagrams to comprise the total functional model. The top level of a Data Flow Diagram is sometimes called a Context Diagram. However, in QLM we use the Data Flow Diagram template for the higher levels as well as the more detailed ones.

The Data Flow Diagram can be a decomposition of an Information System. It can offer a more detailed view of Data Flows than, for example, the Application Architecture Diagram.

An Information System could likewise be decomposed into a Business Process Diagram which offers a complimentary view less concerned with Data Stores and Data Flow, and more concerned with Activity Flow.

Properties and metadata: The Data Flow Diagram template ­­­­can for example retain the following information:

  • A description of the diagram
  • Link to the owner of the diagram
  • Link to the one responsible for diagram
  • Audits (auto generated information regarding its current state and access rights)
  • Associated documents, diagrams and other objects
  • Inherent Risk detailing risk considerations
  • Governance information detailing information about the published diagram and who has been involved in the approval of the diagram

The above picture shows the properties dialogue window for the Data Flow Diagram template, where you can view and edit the diagram’s properties in QualiWare Lifecycle Manager.

Dashboard

Purpose: The purpose of the Dashboard template is to publish selections of Business Charts targeting different stakeholders. It should be used to gather a series of relevant or connected Business Charts to provide a dashboard-like overview.

Core concerns: The Dashboard template enables you to gather Business Charts, Key Performance Indicators, Performance Indicators and General Concepts to create stakeholder specific views of analyzed data. For example, an Enterprise Architect could find a Dashboard containing Business Charts relevant to the usage and governance of the Enterprise Architecture useful.

Below, you can see examples of different Dashboards presenting an array of Business Charts:

Dashboard_1


Dashboard_2

Relation to other templates: The Dashboard template is closely connected to the Business Chart template, as the Dashboard publishes the charts the Business Chart template generates.

Properties and metadata: The Dashboard can for example retain the following information:

  • A description of the Dashboard
  • Link to the owner of the Dashboard
  • Link to the one responsible for the Dashboard
  • Audits (auto generated information regarding its current state and access rights)
  • Associated documents, diagrams and other objects
  • Inherent Risk detailing risk considerations
  • Governance information detailing information about the published diagram and who has been involved in the approval of the diagram

The above picture shows the properties dialogue window for the Dashboard template where you can view and edit the dashboard’s properties in QualiWare Lifecycle Manager.

CPM Diagram

Purpose: The Purpose of the Critical Path Method Diagram (CPM Diagram) is to reveal the critical path through a project, i.e. the list of activities that needs special attention since a delay in these activities will delay the whole project.

Core concerns: The CPM Diagram enables you to model Project Activities and connect them with Activity Paths. The Project Activities are then enriched with information about latest and earliest dates for start and finish as well as information about duration and slack for each Project Activity.

This makes it possible to calculate the probability of finishing the project within the planned timeframe, and to successively improve and detail the plan.

Below, you can see an example of a CPM Diagram about how to develop an organization to support a strategic change. It concerns the incoming and outgoing flow of employees as well as their training across several locations:


CPMDiagram_2

As you can see, the critical path is marked with red.

The following example is of a technology roadmap, where the critical path shows the three most critical project activities for on-time completion:

Other functionalities: A Calendar can be linked to the Property Dialog of the diagram showing holidays for the project.

Relation to other templates: The CPM Diagram template should be used after a project has been broken down into Project Activities. As such, it can be a decomposition of a Project Activity from a Business Canvas, Value Proposition, Work Model, Strategy Model or Innovation Canvas.

Properties and metadata: The CPM Diagram ­­­­can for example retain the following information:

  • A description of the diagram
  • Link to owner
  • Link to responsible
  • Link to calendar
  • Audits (auto generated information regarding its current state and access rights)
  • Associated documents, diagrams and other objects
  • Inherent Risk detailing risk considerations
  • Governance information detailing information about the published diagram and who has been involved in the approval of the diagram

The above picture shows the properties dialogue window for the CPM diagram where you can view and edit the diagram’s properties in QualiWare Lifecycle Manager.