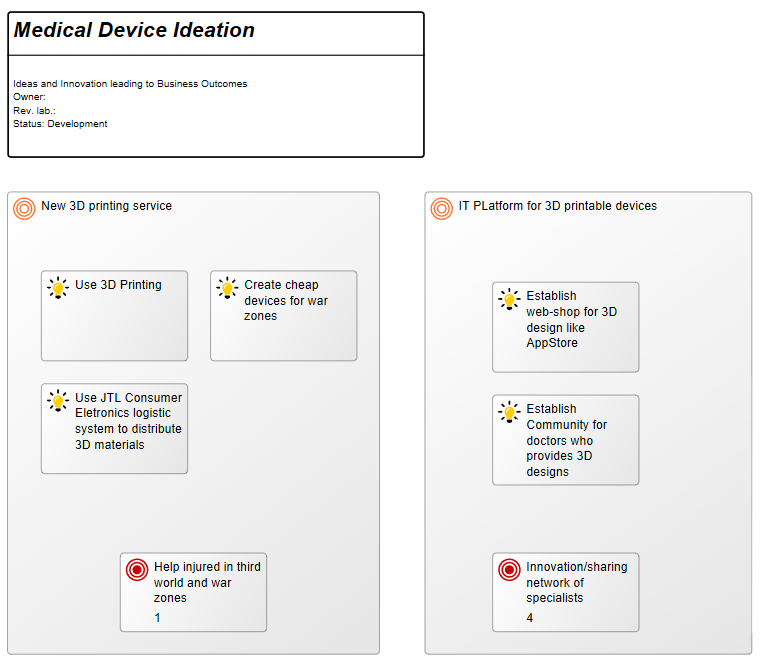
Purpose: The Purpose of the Innovation Canvas is to model ideas for Innovation detailing their goals and ideas for action.
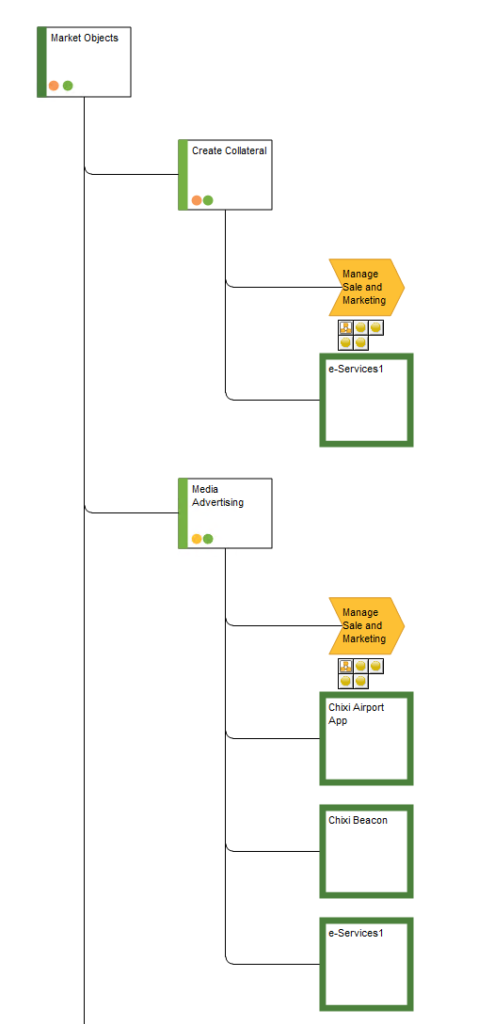
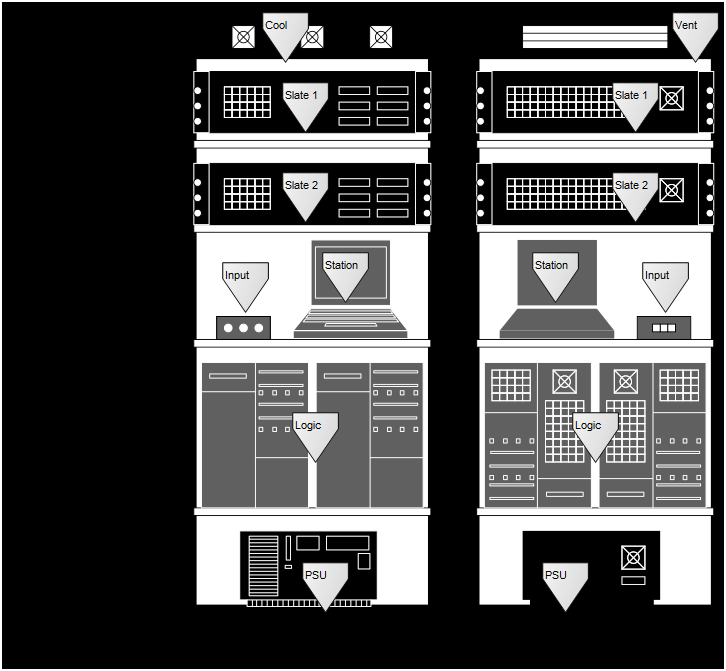
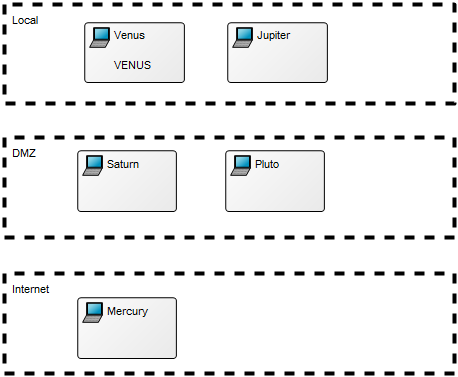
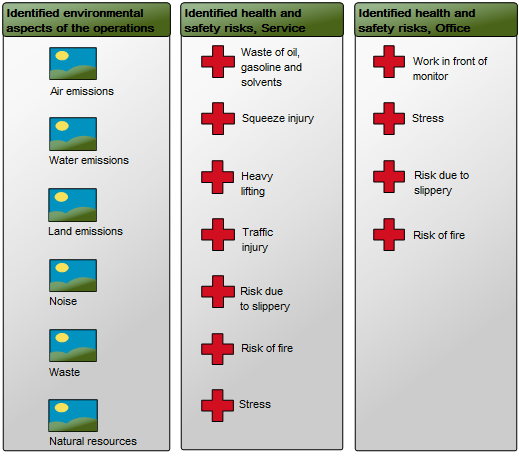
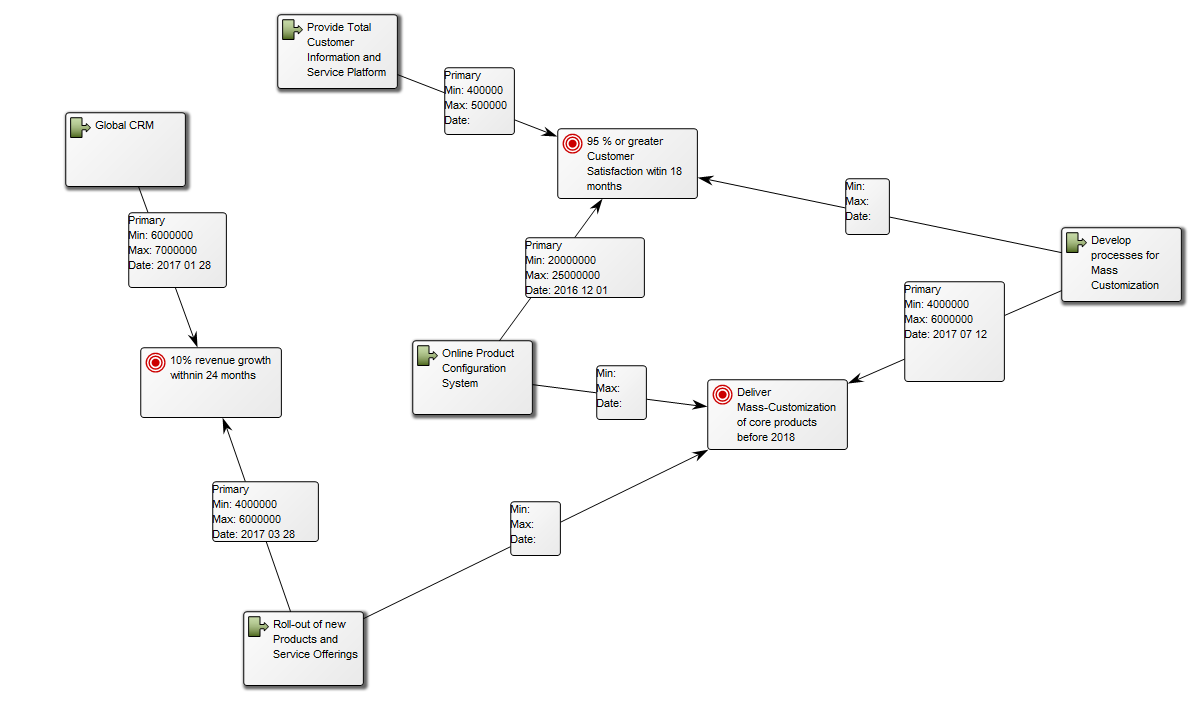
Core concerns: The Innovation Canvas allows you to model an innovation detailing the ideas that exist in relation to it. In the example below, the goals of the innovation have also been defined and attached. Goals, vision, mission and many more strategic objects are available in the default extended syntax for the diagram, enabling you to model your ideas for innovation in as much detail as you prefer.
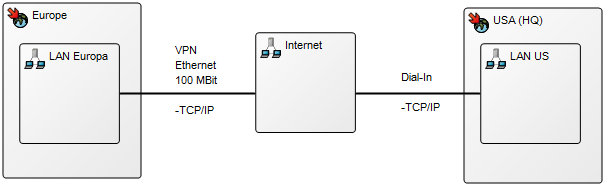
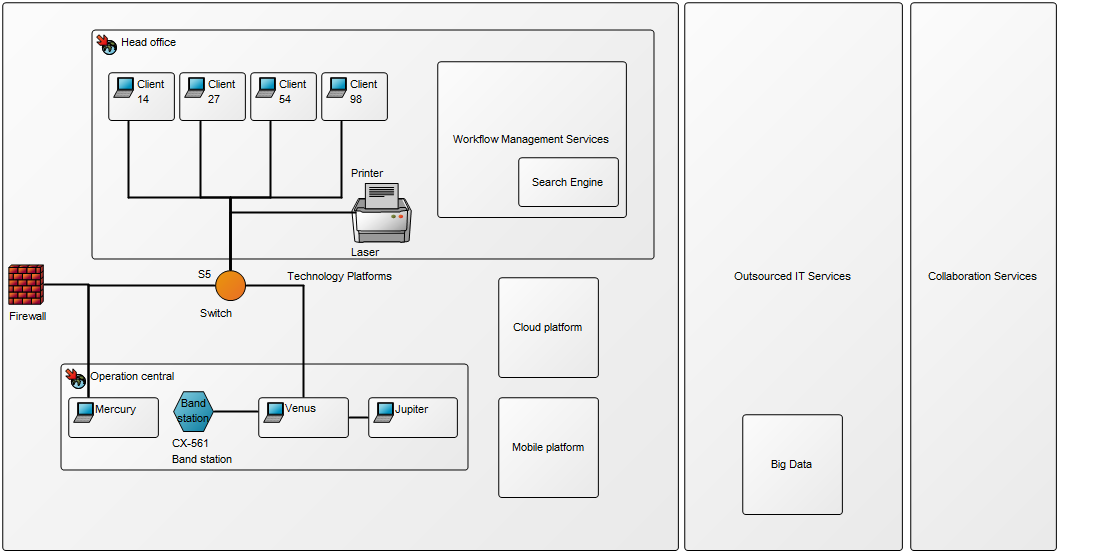
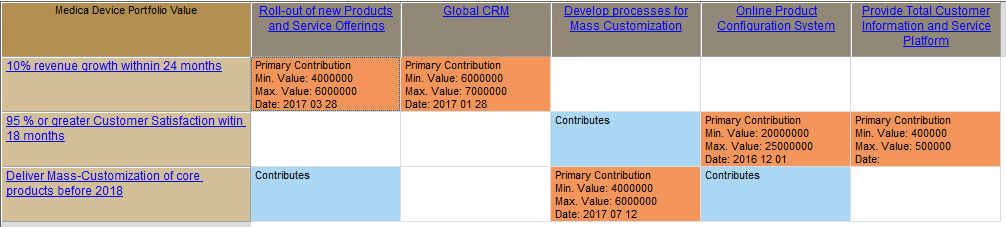
Relation to other templates: The Innovation Canvas is a strategic template and the elements modelled in it can easily be connected to other strategic templates such as a Strategy Model, Enterprise Investment Portfolio, Business Canvas or Business Capability Model.
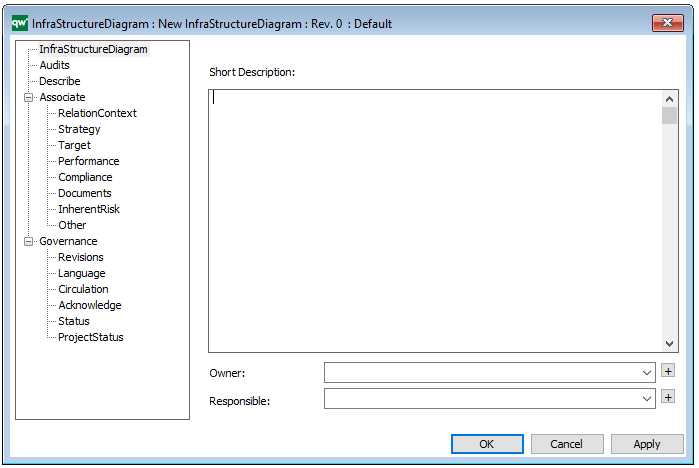
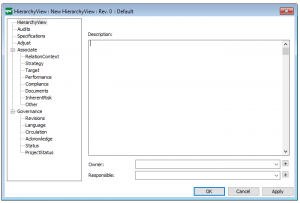
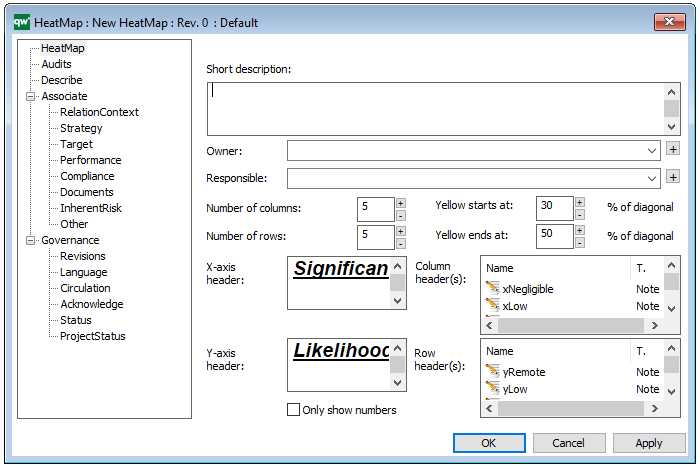
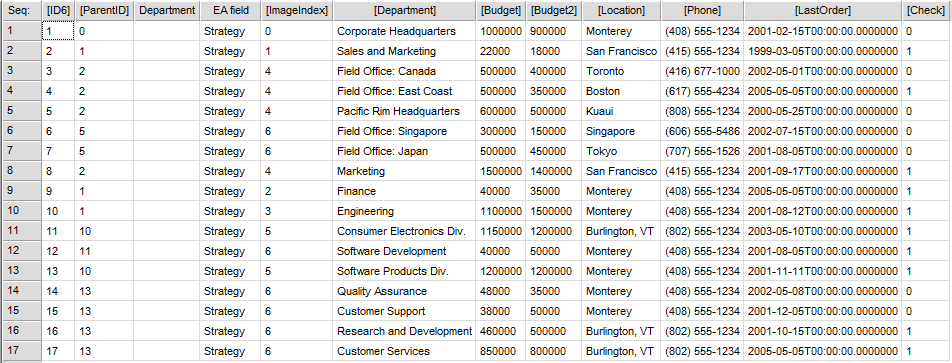
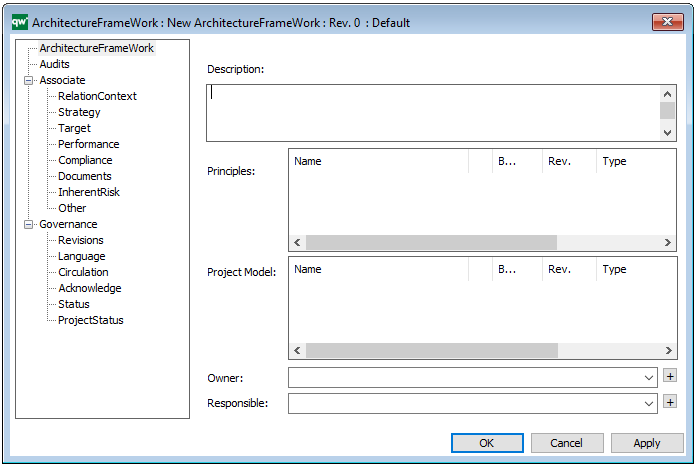
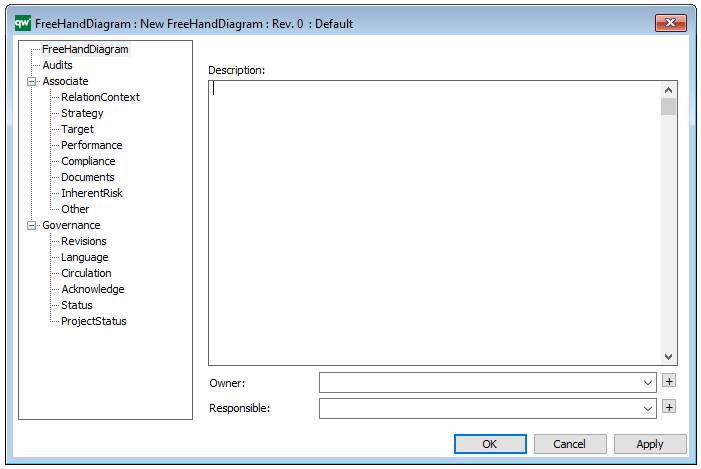
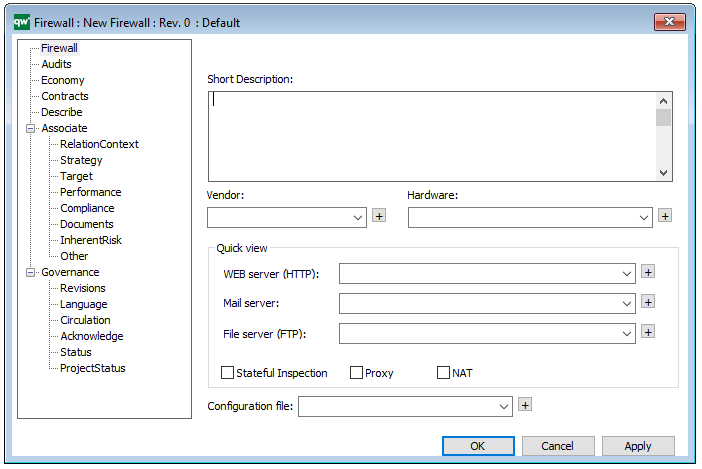
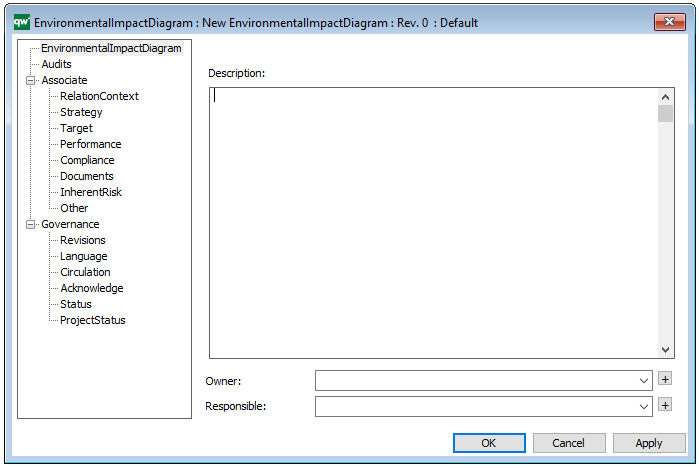
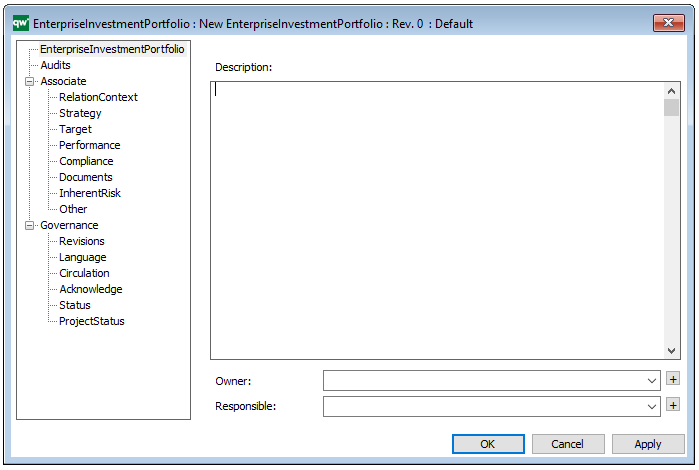
Properties and metadata: The Innovation Canvas can for example retain the following information:
- A description of the diagram
- Link to the owner of the diagram
- Link to the one responsible for the accuracy of the diagram
- Audits (auto generated information regarding its current state and access rights)
- Associated documents, diagrams and other objects
- Inherent Risk detailing risk considerations
- Governance information detailing information about the published diagram and who has been involved in the approval of the diagram
- Project status: information about budgeted and actual man-hours spent, percentage completed and the latest milestone, result and quality control of a change process.
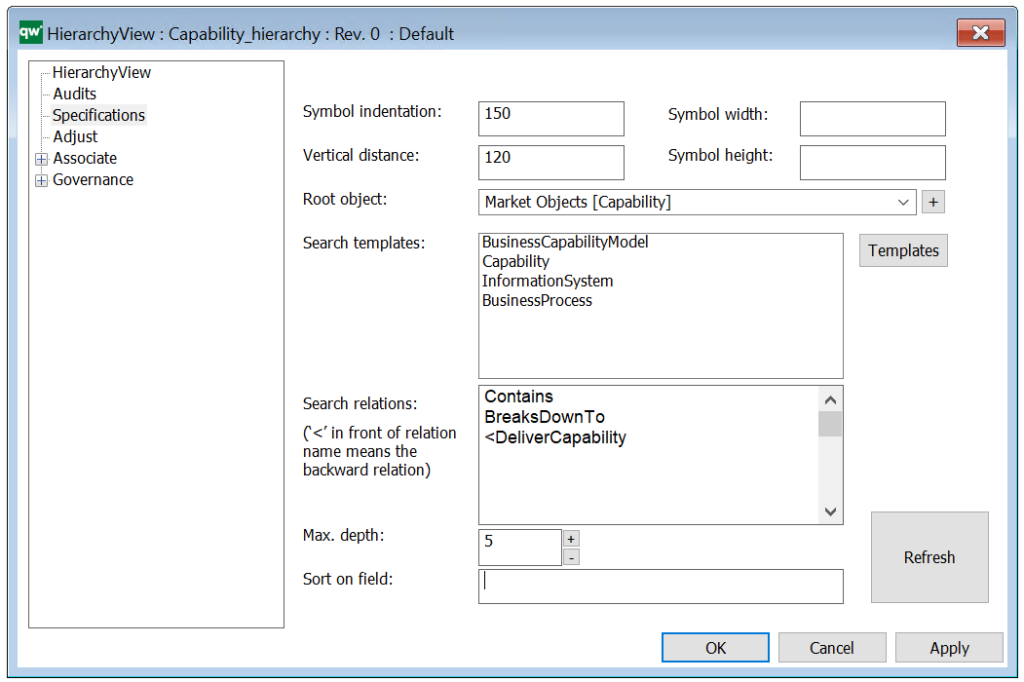
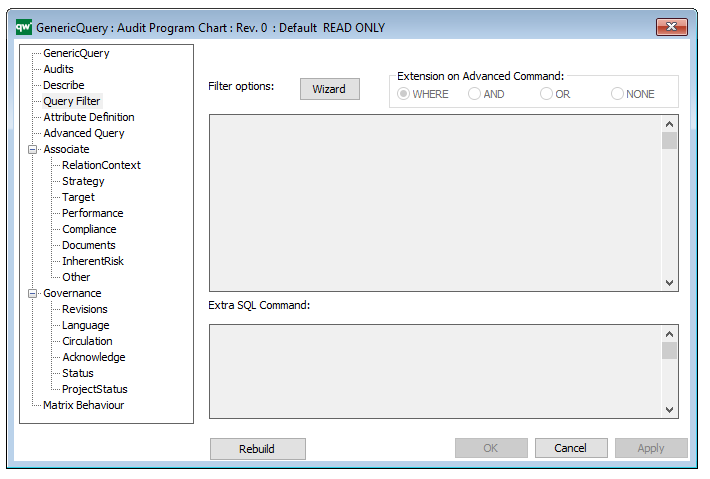
In the picture below you can see the Innovation Canvas’ properties dialogue window, where the properties can be viewed and edited: