Purpose: The purpose of the Composite Structure Diagram template is to document the internal structure of a class, Class interactions with the environment and behavior of collaborations. The Composite Structure Diagram is part of the UML version 2.5.
Core concerns: The Composite Structure Diagram enables you to model Collaborations, Collaboration Use, Properties, Classes, Interfaces and Ports. These elements can be connected by Connectors, Dependencies, Interface Realizations and Usage.
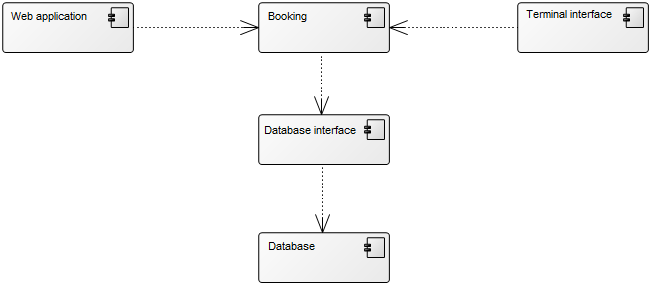
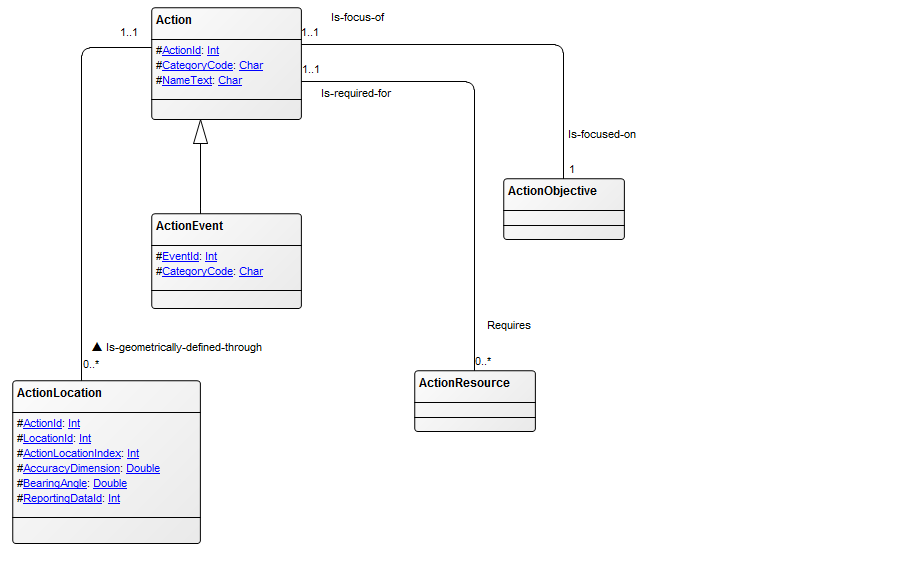
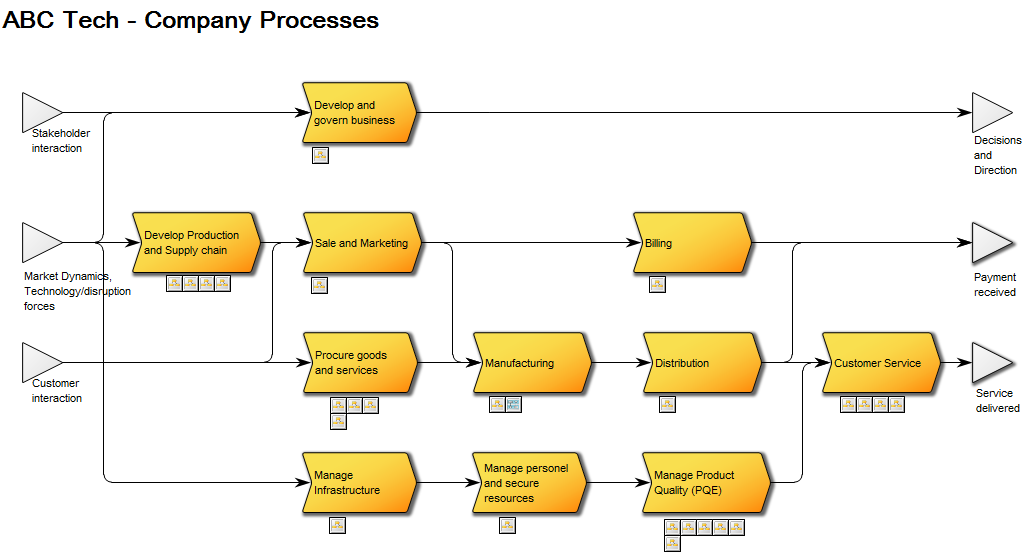
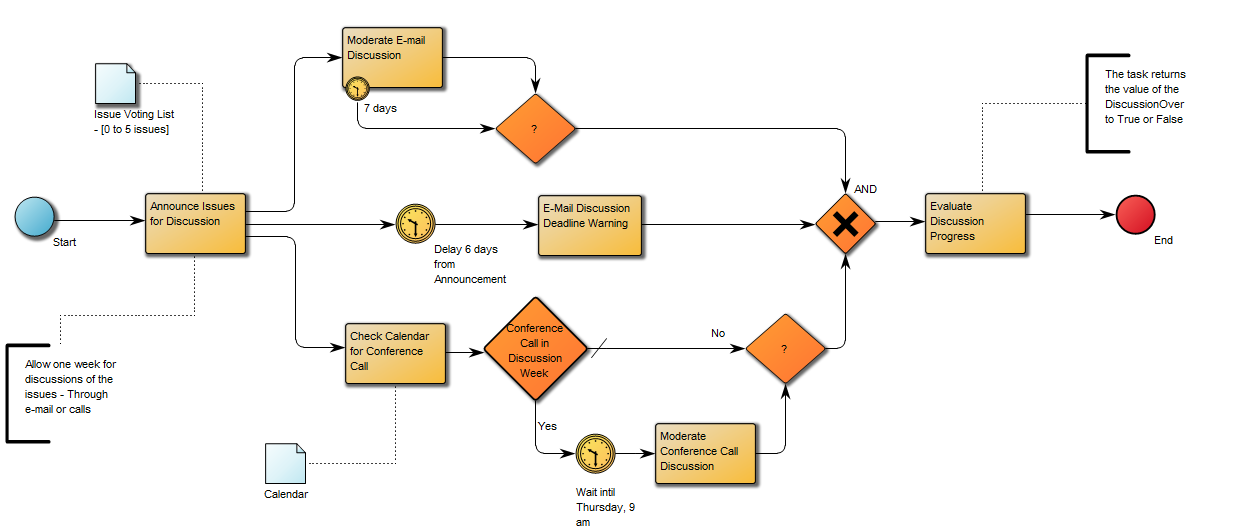
Below, you can see an example of a Composite Structure Diagram for a car safety inspection:
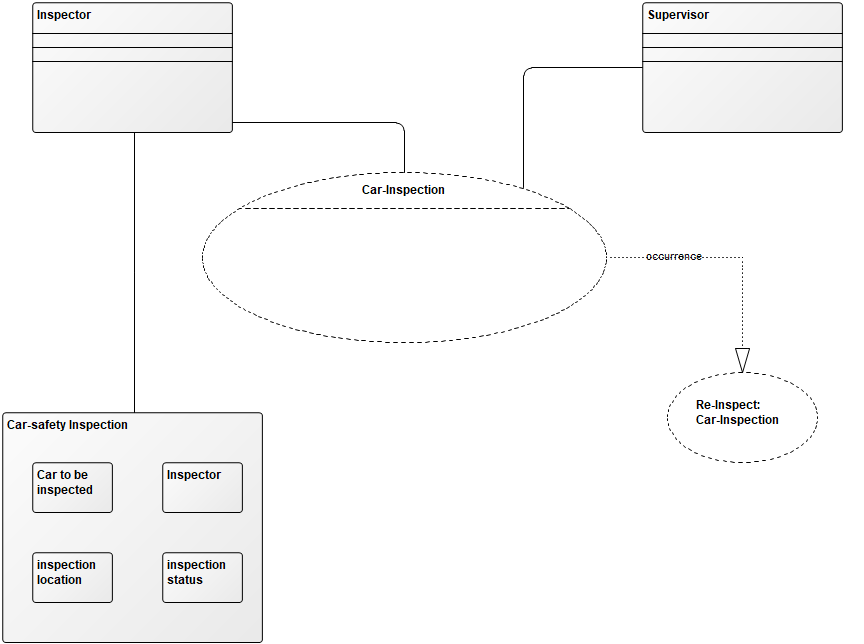
The Diagram shows internal structure of the Car-safety inspection class as well as the behavior of collaborations and the different classes’ interactions.
Relation to other templates: The Composite Structure Diagram is part of the UML templates QualiWare supports along with the Activity Diagram, Communication Diagram, Deployment Diagram, Class Diagram, State Diagram, Package Diagram, Component Diagram, Sequence Diagram, Use case diagram and Timing Diagram.
The Composite Structure Diagram can be defined as the components content along with the Component Diagrams, Class Diagrams, Classes, and Interfaces. The Component Object is a representation of a physical part from the system specification.
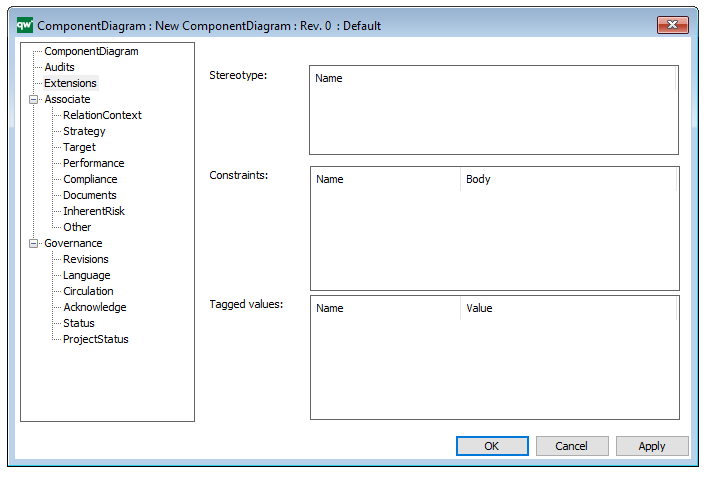
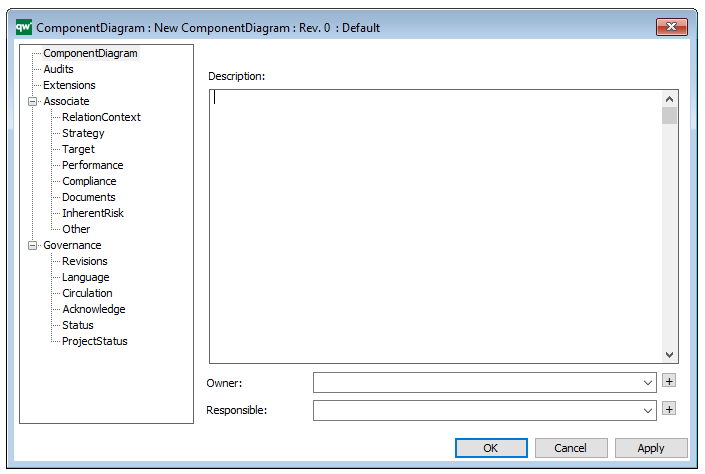
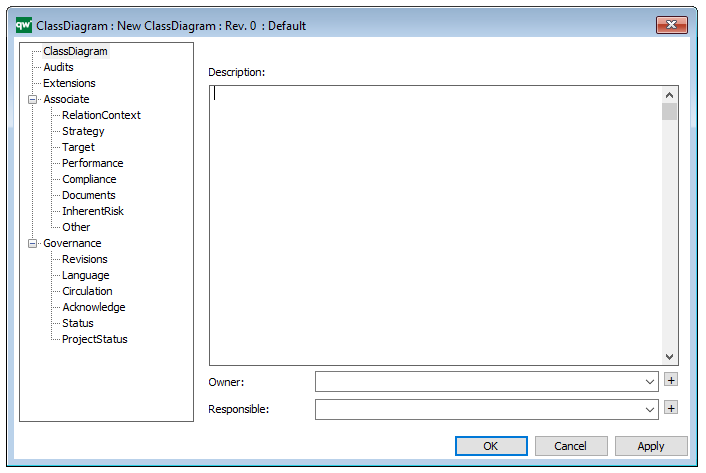
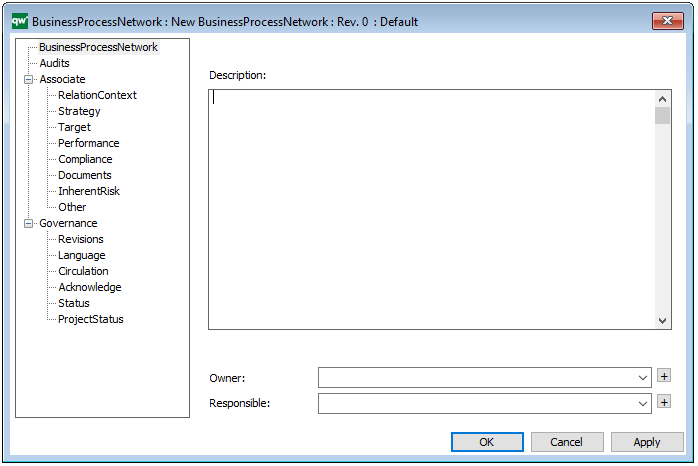
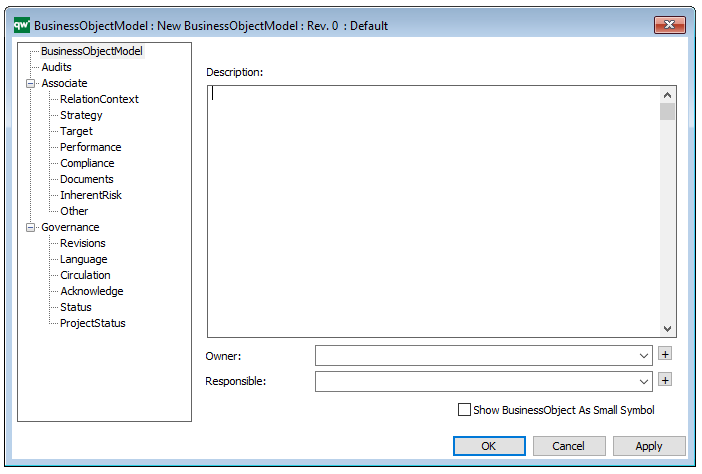
Properties and metadata: The Composite Structure Diagram can for example retain the following information:
- A description of the diagram
- Link to the owner of the diagram
- Link to the one responsible for the diagram
- Extensions (Stereotypes, constraints and tagged values)
- Audits (auto generated information regarding its current state and access rights)
- Associated documents, diagrams and other objects
- Inherent Risk detailing risk considerations
- Governance information detailing information about the published diagram and who has been involved in the approval of the diagram
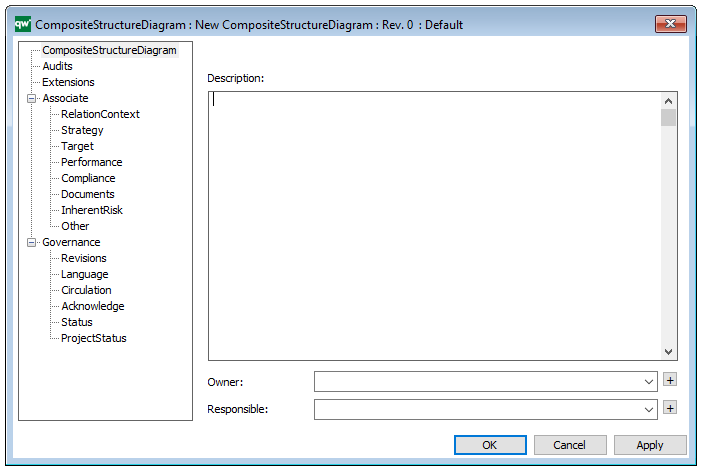
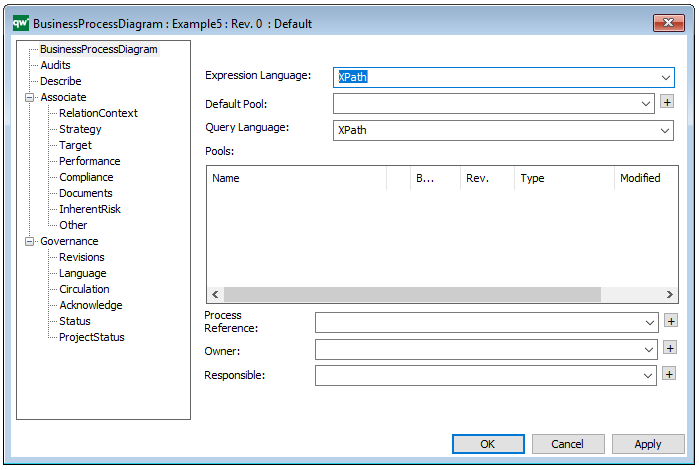
The above picture shows the properties dialogue window for the Composite Structure Diagram where you can view and edit the diagram’s properties in QualiWare Lifecycle Manager.
For more information: about the UML, please visit the Object Management Group’s Website, where you can find the complete specification.