Purpose: The purpose of a Business Diagram is to show the functional structure and relationships of the whole or part of an organization.
Core concerns: The Business Diagram template enables you to model Business Functions, Information Systems, Inventory, Business Scope, Lines of Business, Information Flow and Logistical Flow. The diagram’s syntax can be extended to also include strategic elements such as Goals, Objectives, Stakeholders and Performance Indicators.
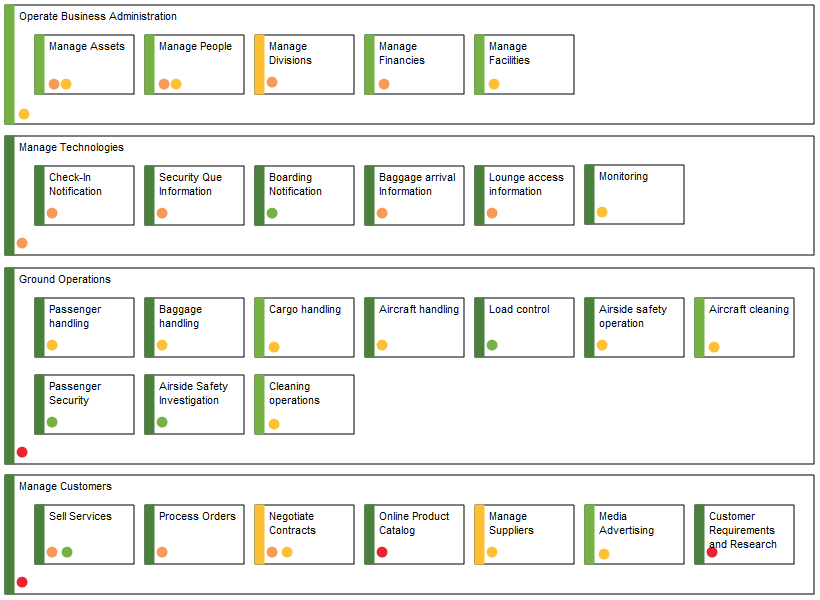
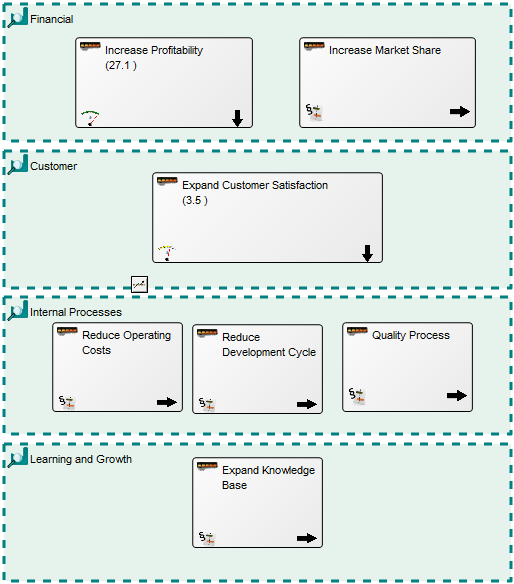
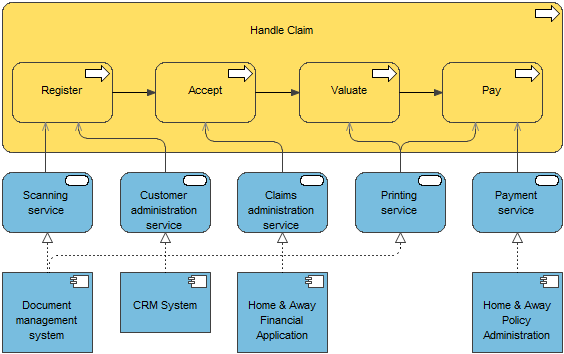
The Business Diagram should be broken down into several levels of recurring Business Diagram templates. In the model below, you can see an example of a high-level Business Diagram showing Business Functions and their Information Flows and Logistical Flows – describing the flow of products and services – in this case for a car rental service.
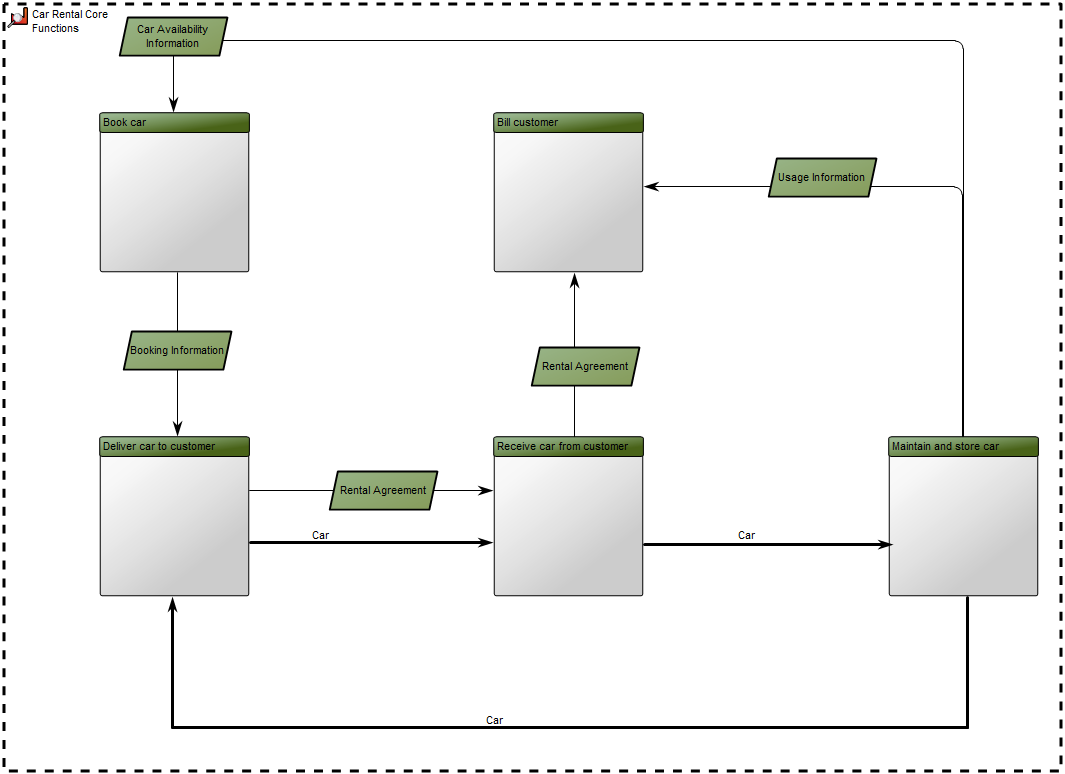
The Business Functions are placed with the operational functions in the bottom together with the Logistical Flow and with management control at the top of the Business Diagram.
On lower levels (decompositions) of Business Diagrams, Information Systems are placed close to the Business Functions that are responsible for or own the Information Systems.
Relation to other templates: The Business Diagram can be used as an addition to a Business Process Network and Strategy Models, giving a practical view of how the organizations functions fit together, illuminating interdependencies.
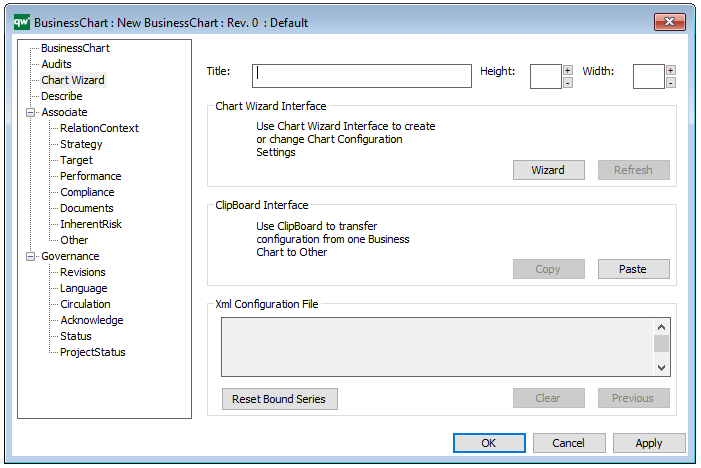
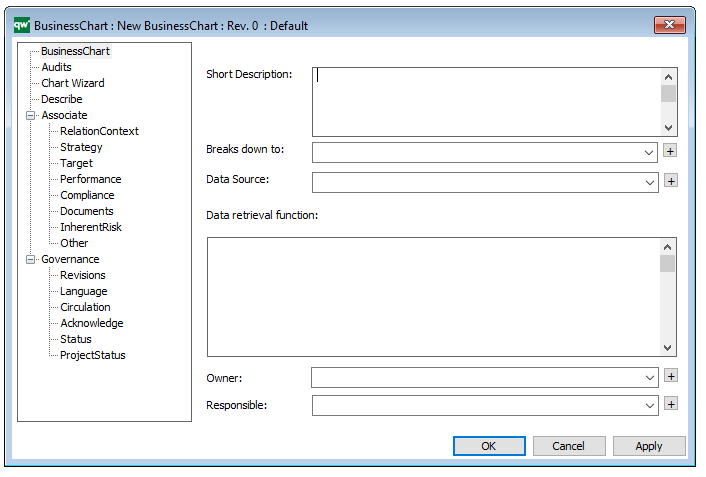
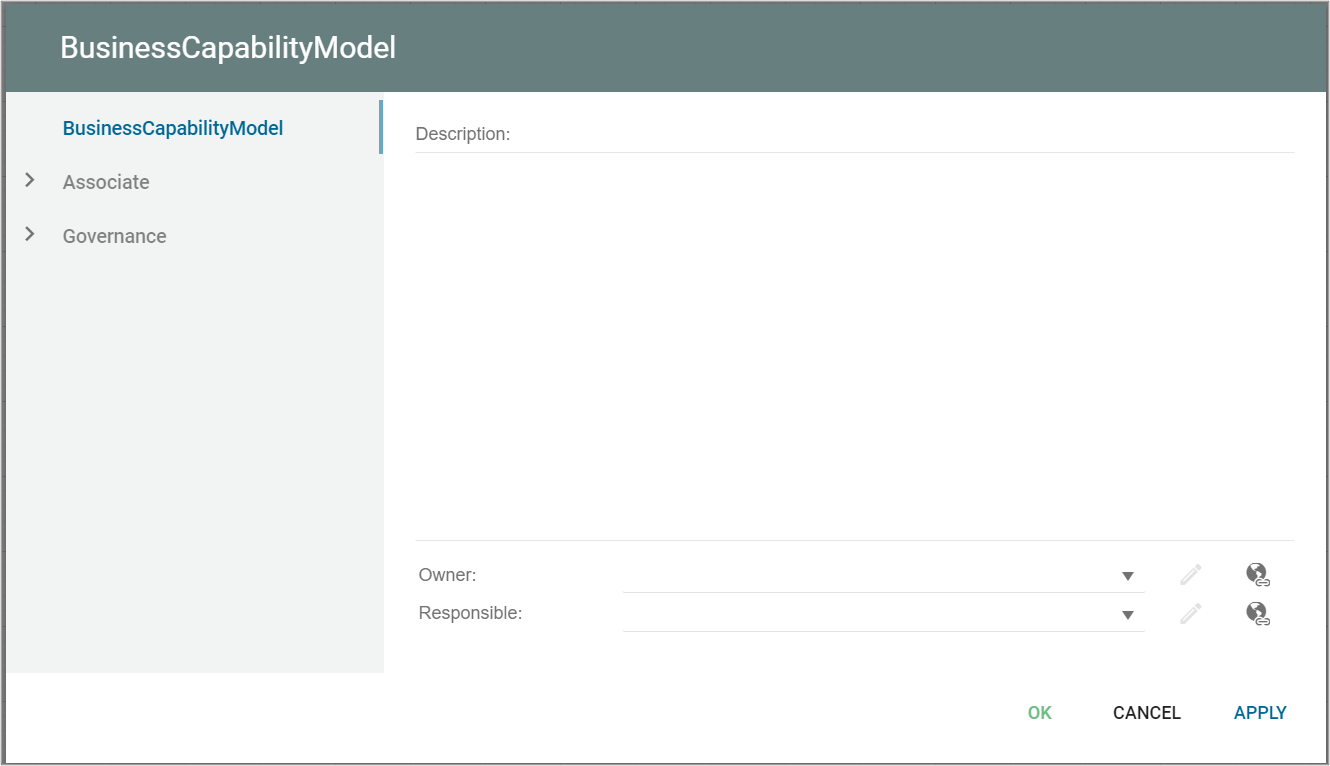
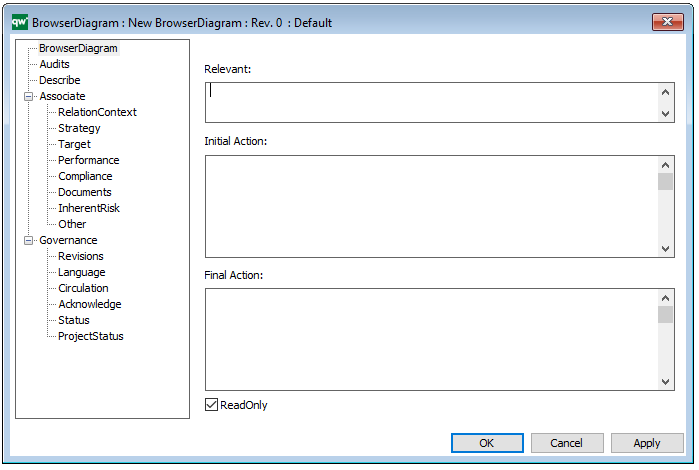
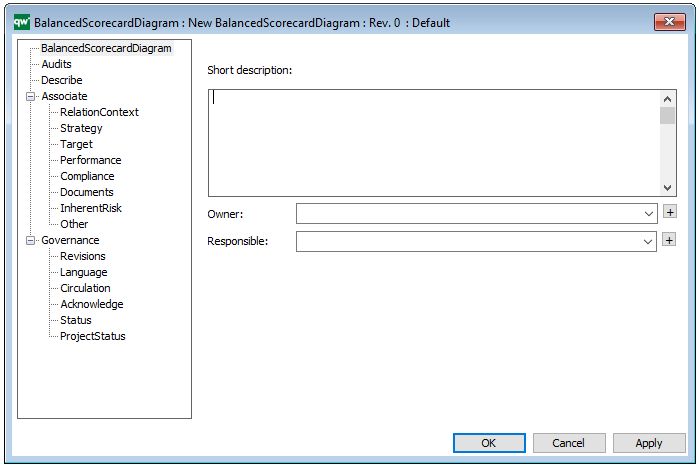
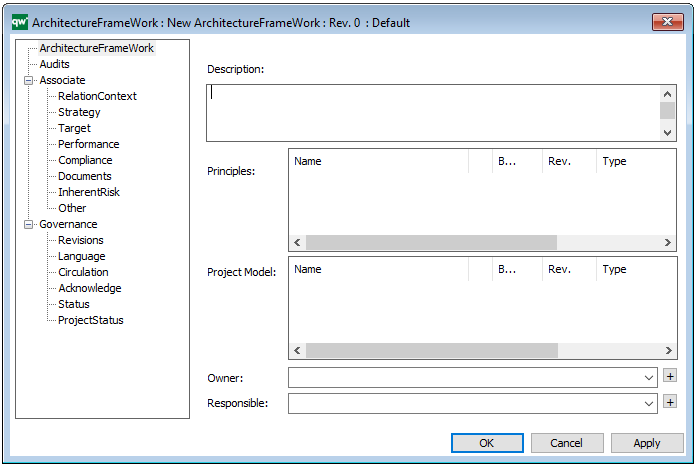
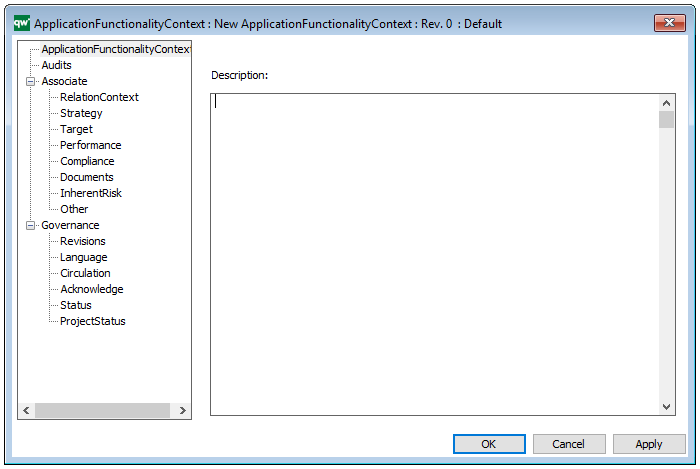
Properties and metadata: The Business Diagram can for example retain the following information:
- A description of the diagram
- Link to the owner of the Diagram
- Link to the one responsible for the Diagram
- Indication of the diagram portrays an as-is situation or a to-be situation
- The Perspective can be defined as either: Holistic, Sub-functional, Process, or IT Focused.
- Audits (auto generated information regarding its current state and access rights)
- Associated documents, diagrams and other objects
- Inherent Risk detailing risk considerations
- Governance information detailing information about the published diagram and who has been involved in the approval of the diagram
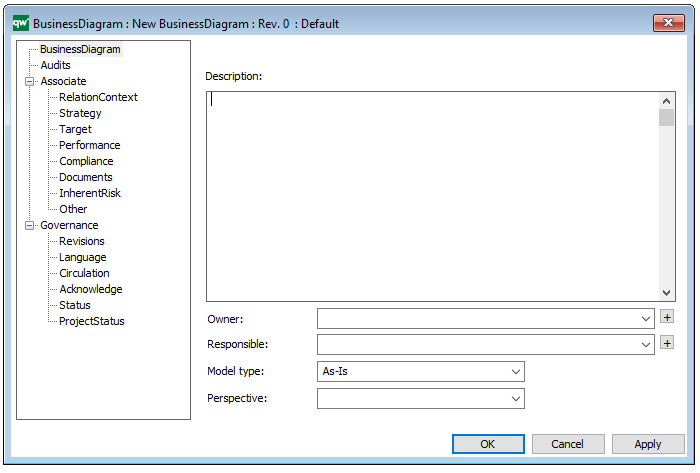
The above picture shows the properties dialogue window for the Business Diagram where you can view and edit the diagram’s properties in QualiWare Lifecycle Manager.