Enterprise Investment Portfolio

Purpose: The purpose of the Enterprise Investment Portfolio template is to model enterprise goals and investments.

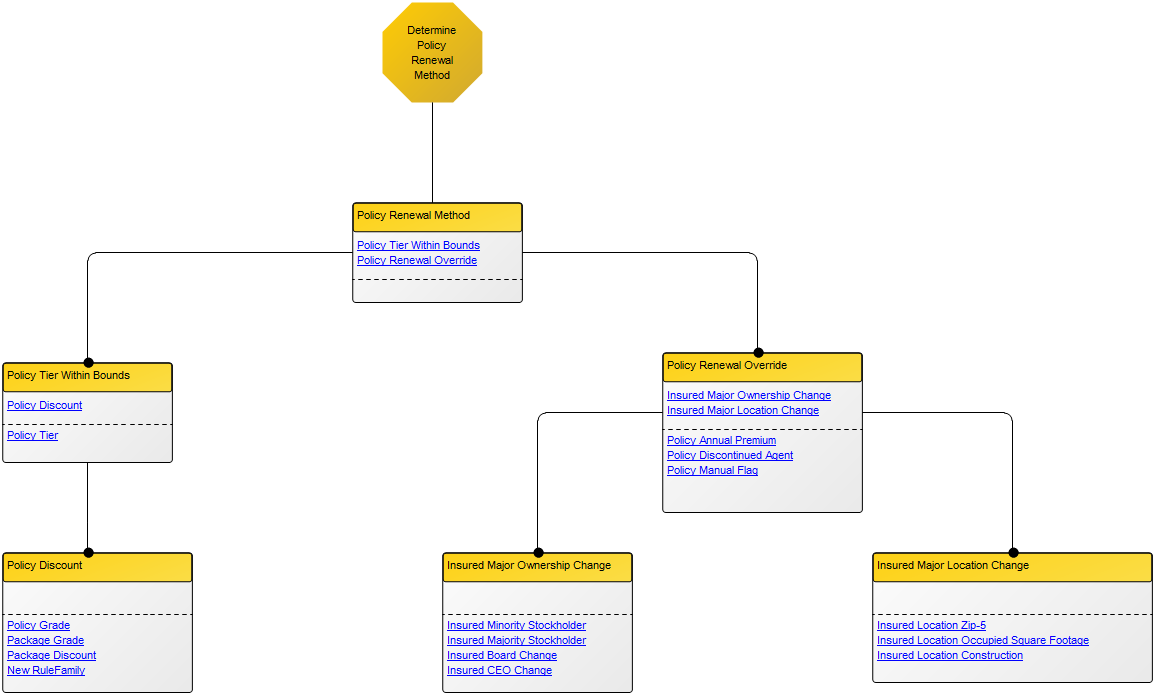
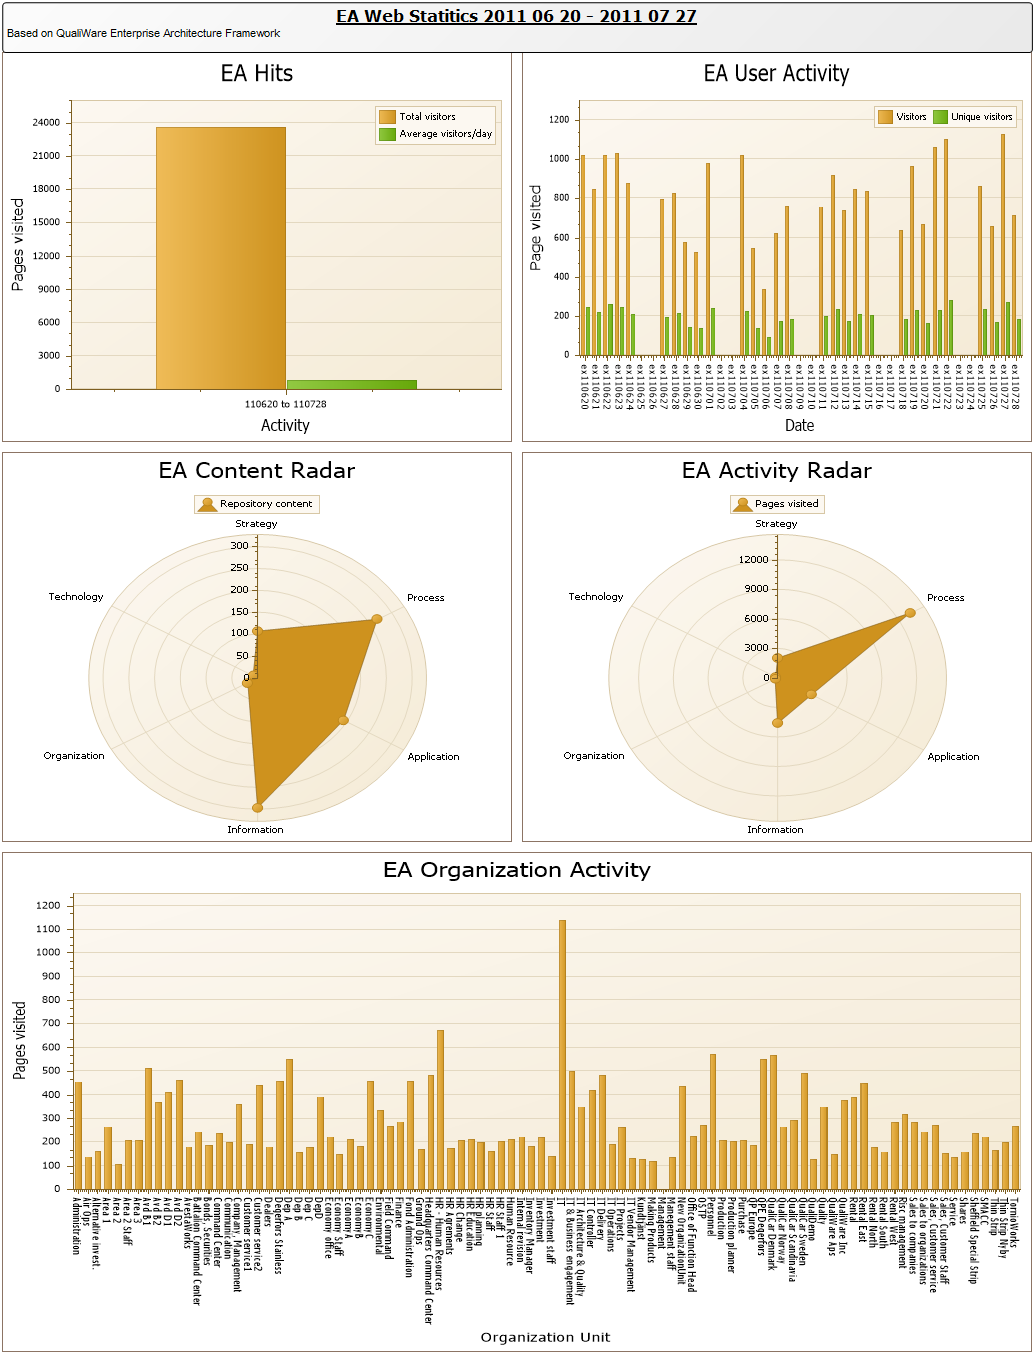
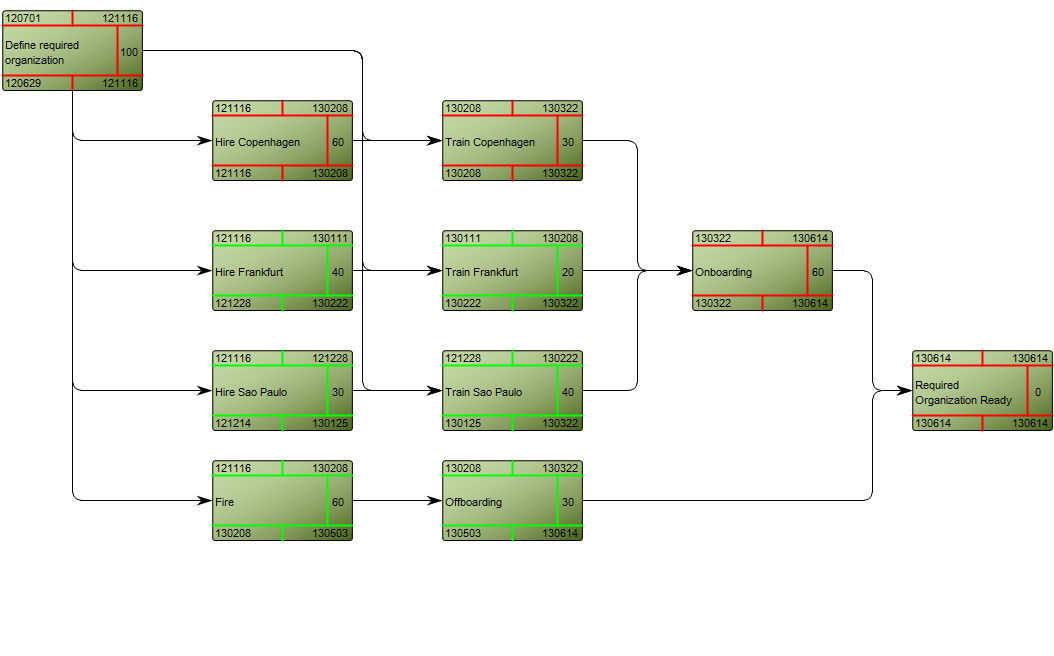
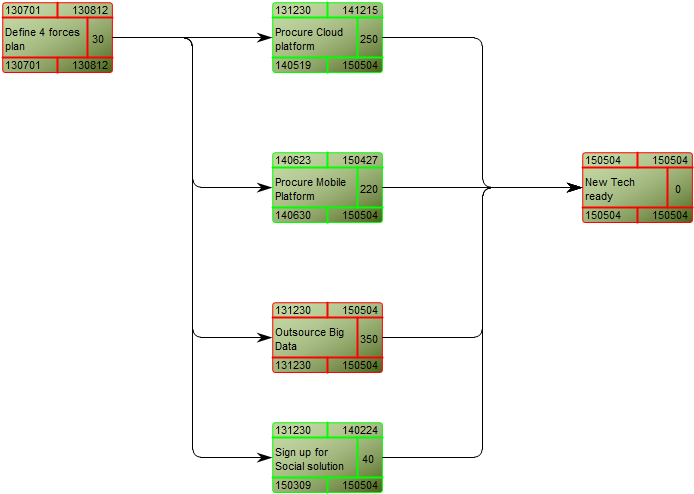
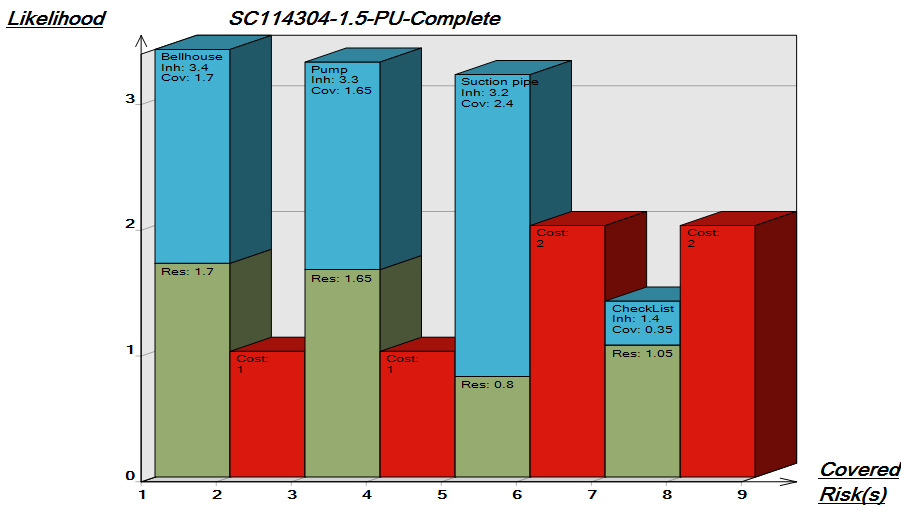
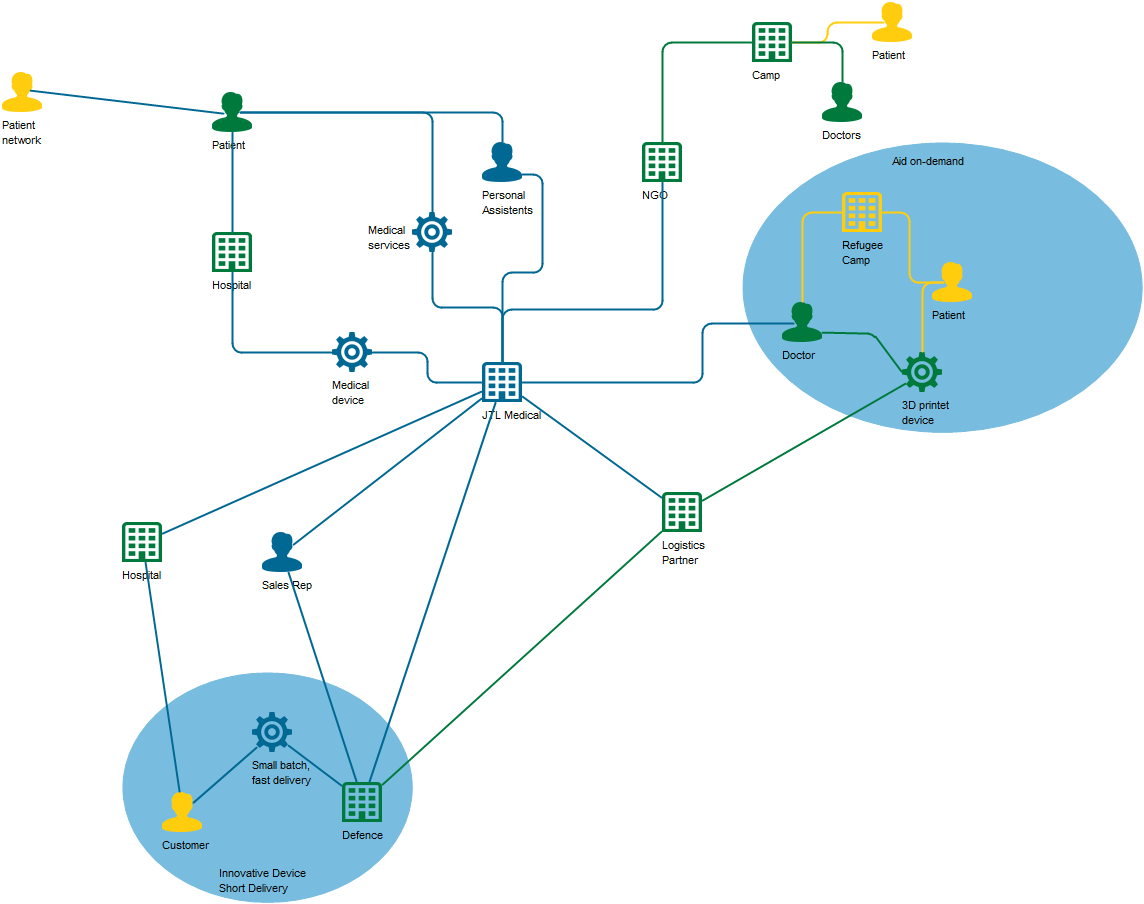
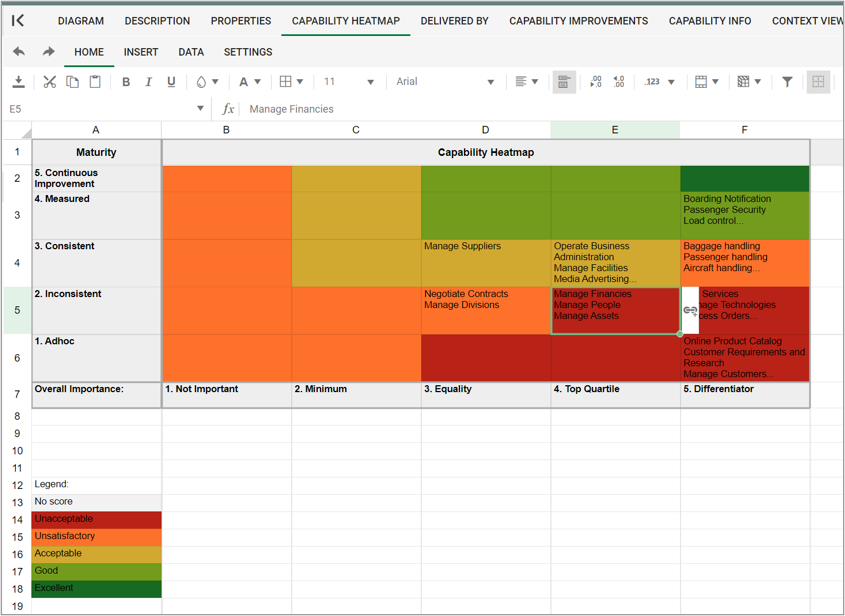
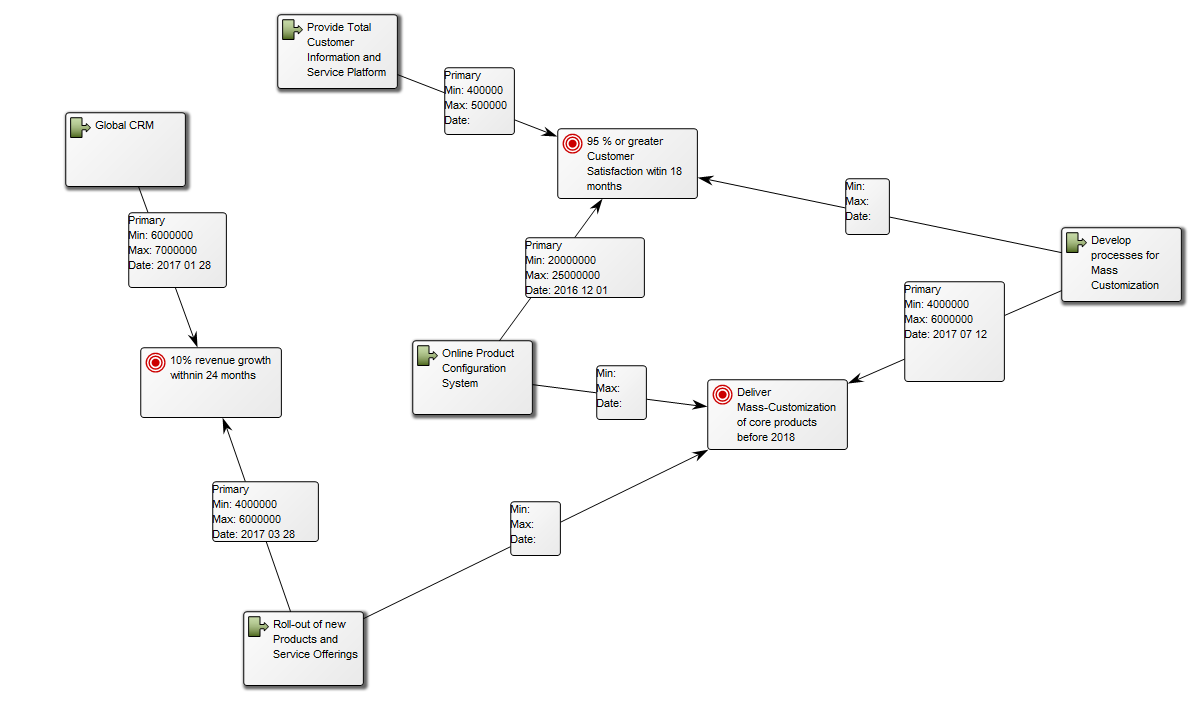
Core concerns: The Enterprise Investment Portfolio template enables you to model Goals, Projects, and Initiatives. The projects and initiatives can be connected to enterprise goals them through Project Contributions, that show the viable minimum and optimistic maximum of the value contribution. Below, you can see an example of an Enterprise Investment Portfolio, where the way goals are realized is visualized:


EnterpriseInvestmentPortfolio_1

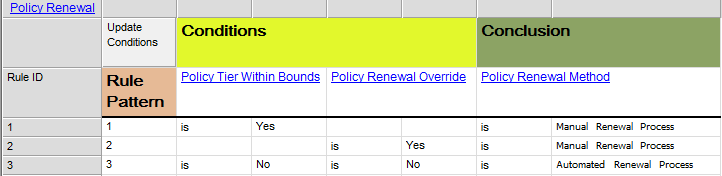
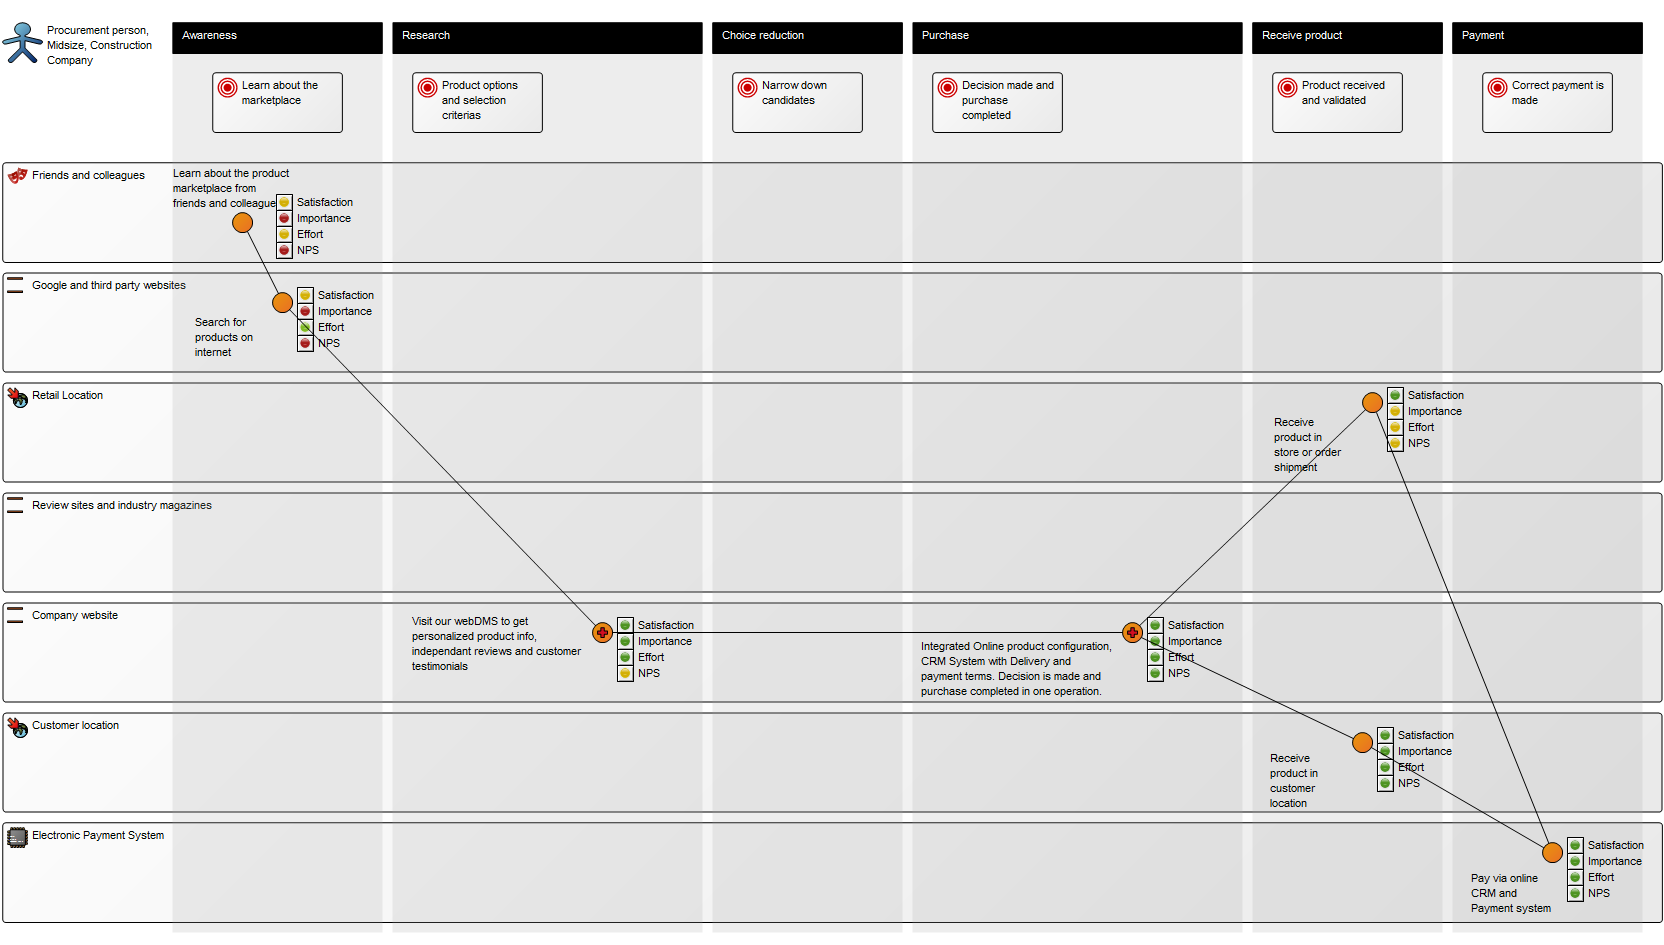
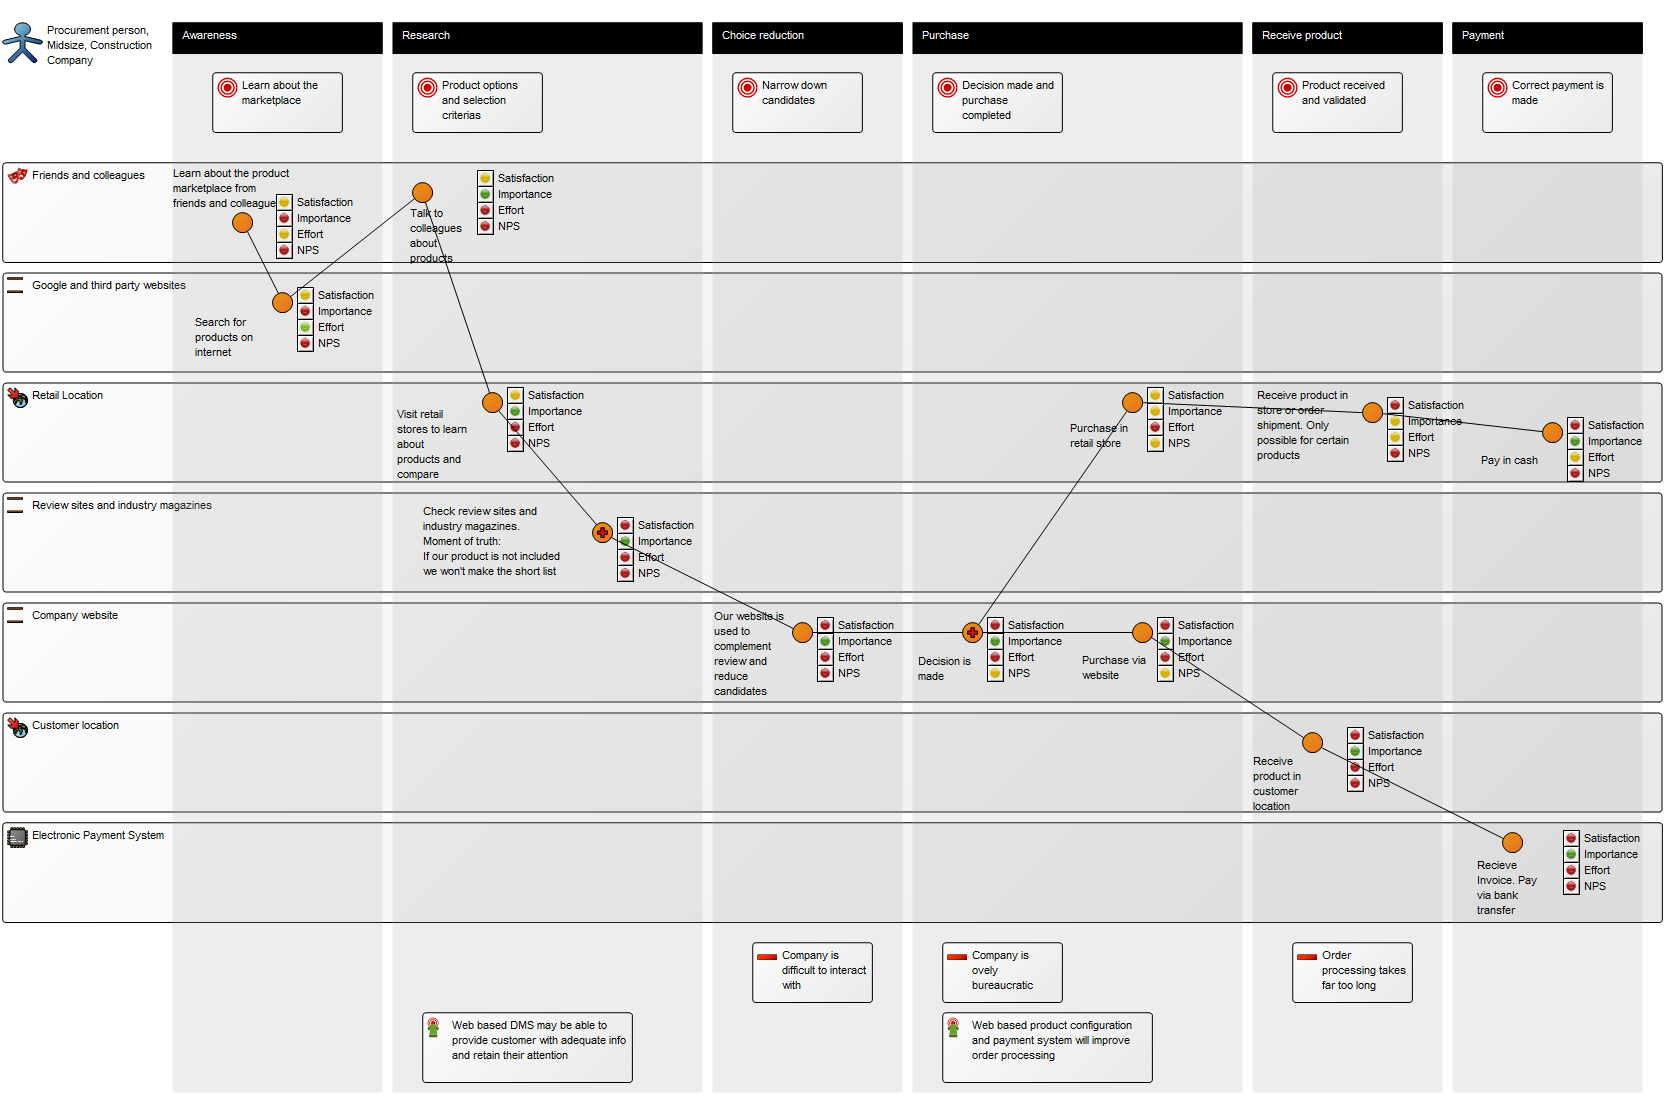
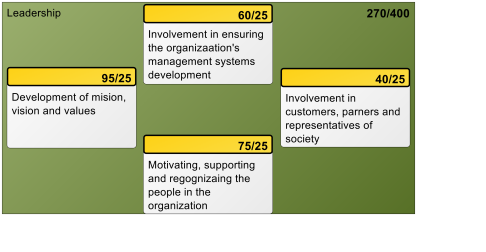
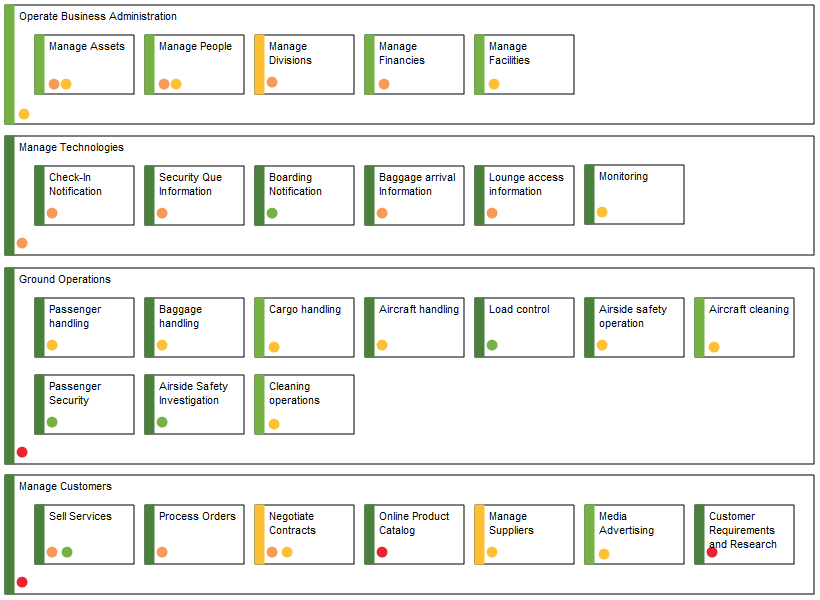
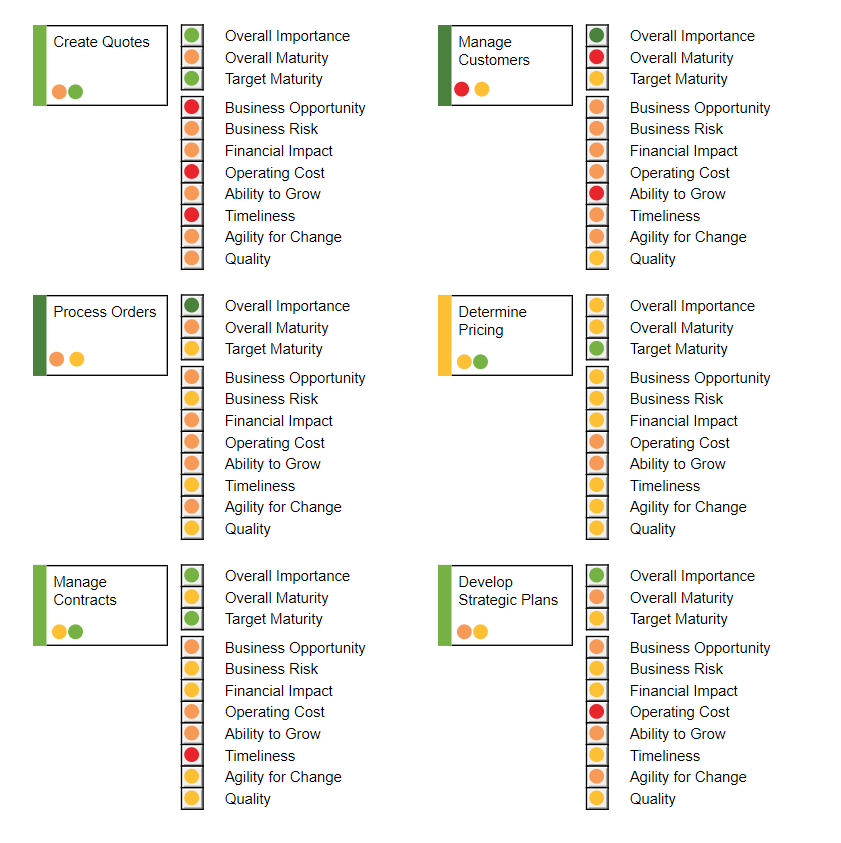
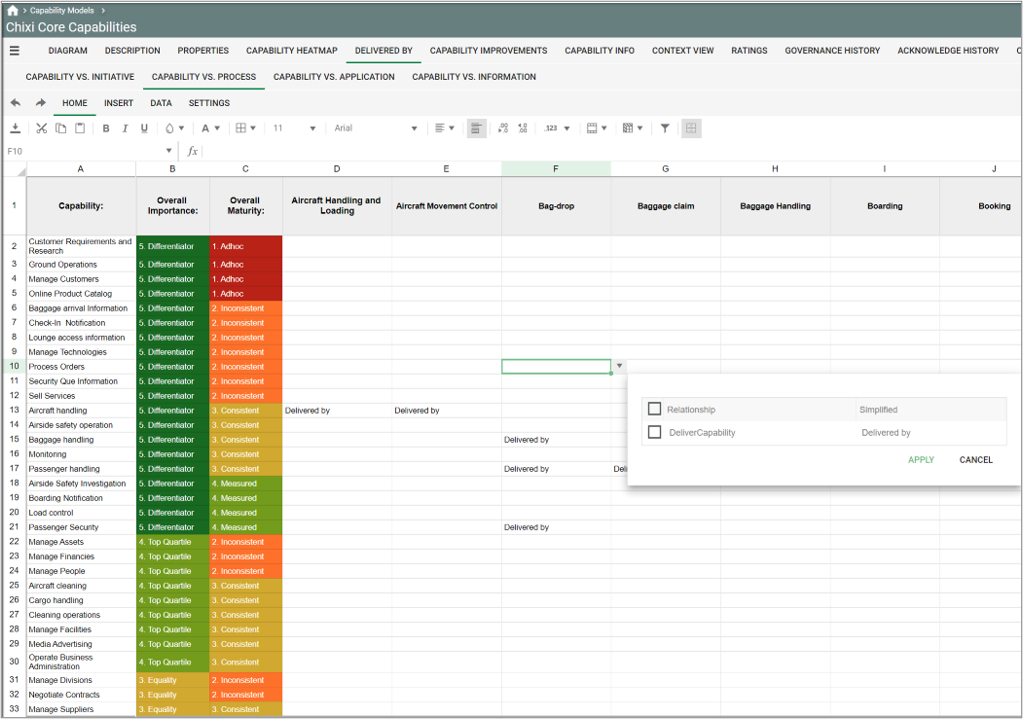
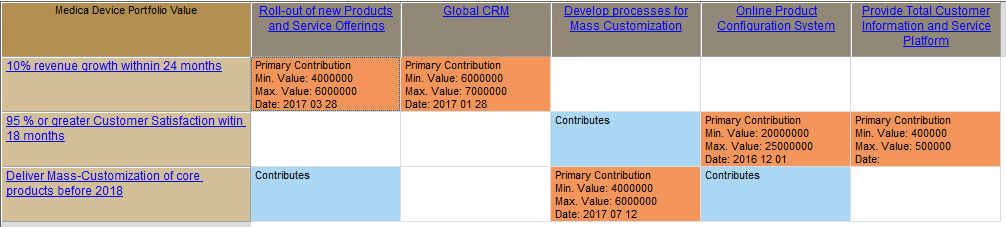
Other Functionalities: By using the Enterprise Investment Actions tab, you can create, for example, a Portfolio Value matrix, which offers another way to view the same data:

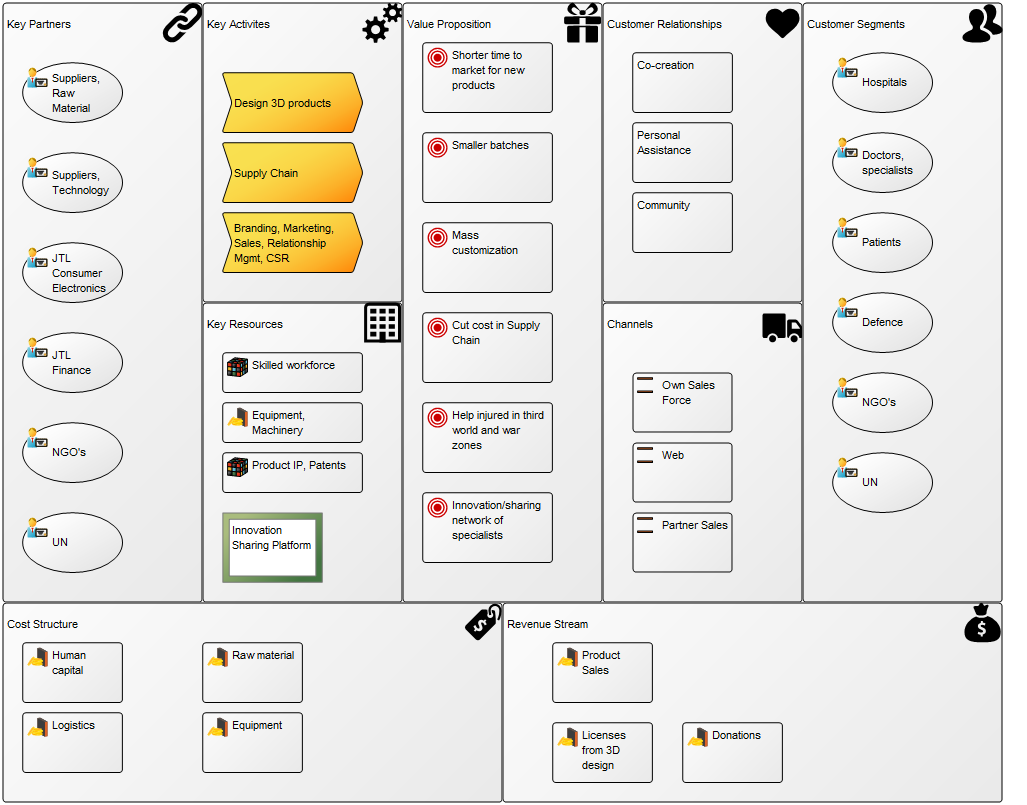
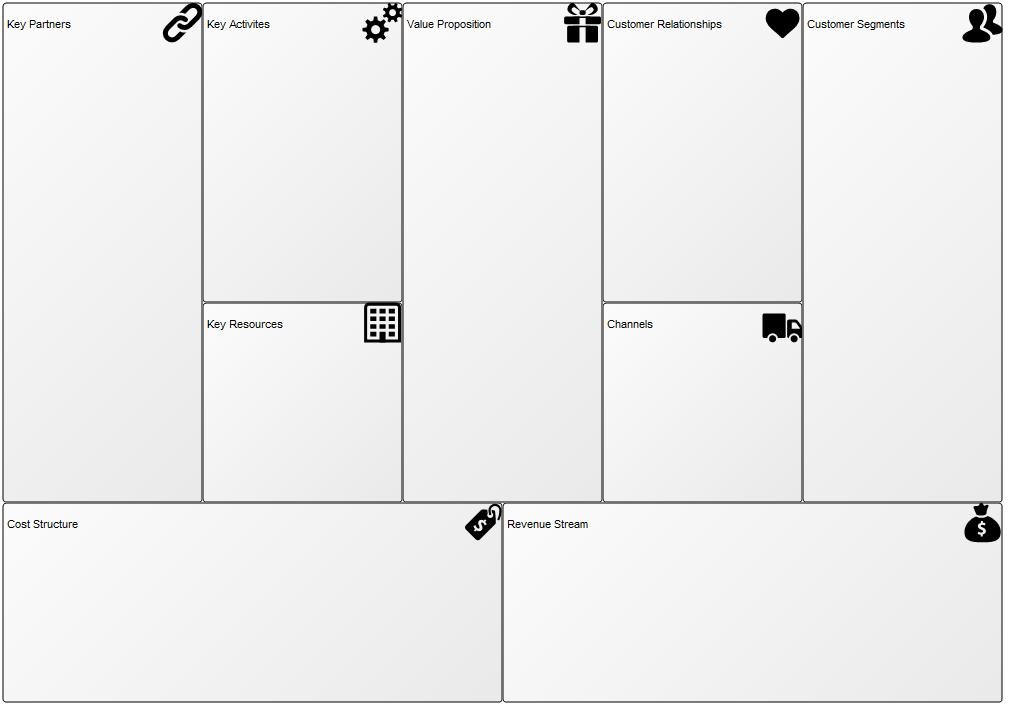
Relation to other templates: The Enterprise Investment Portfolio is a strategic template and is as such related to the enterprise’s Strategy Model, Strategic Roadmap, Business Canvas and Innovation Canvas. The projects contained in the initiatives can also be further described in the Work Model template.

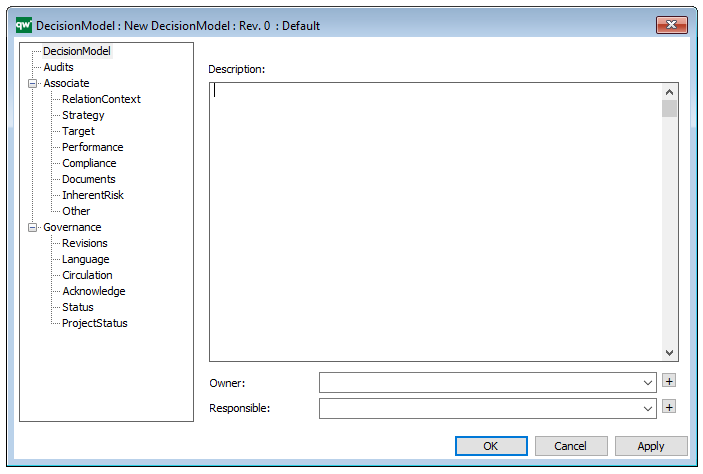
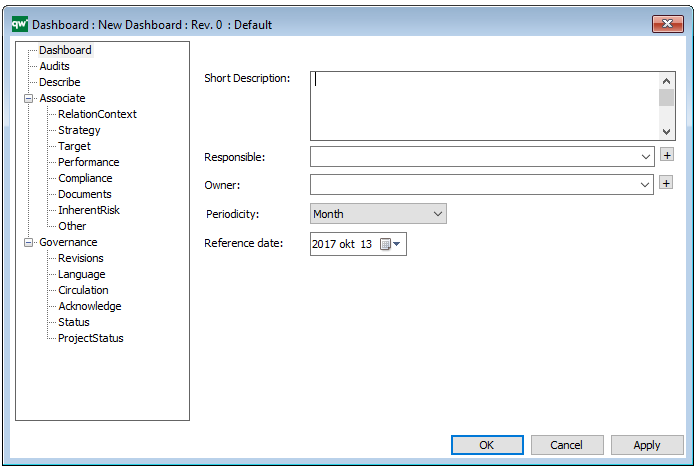
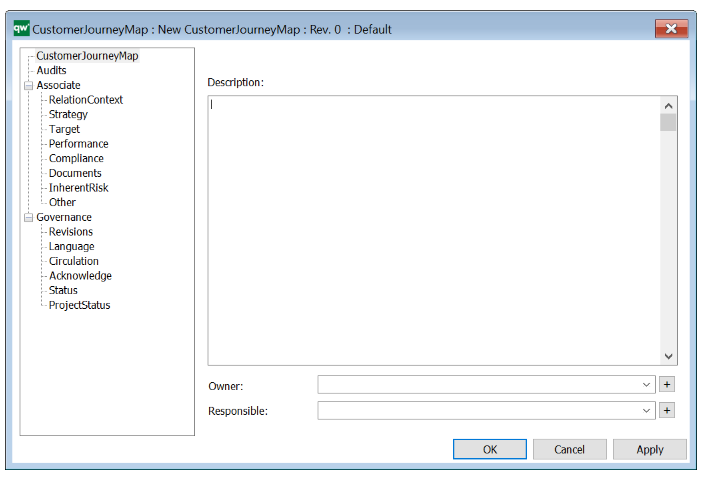
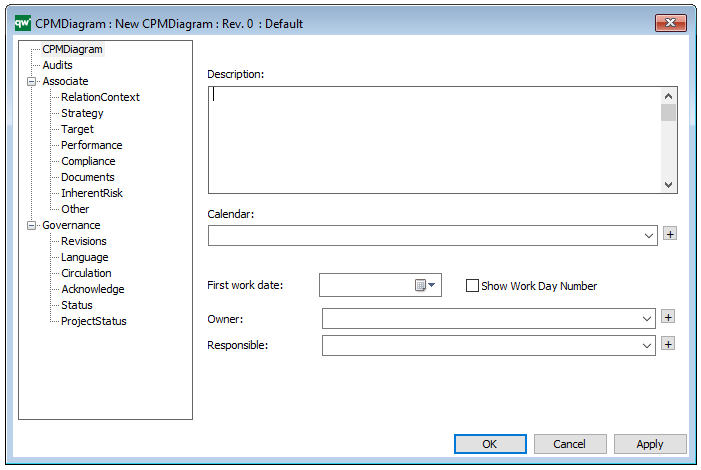
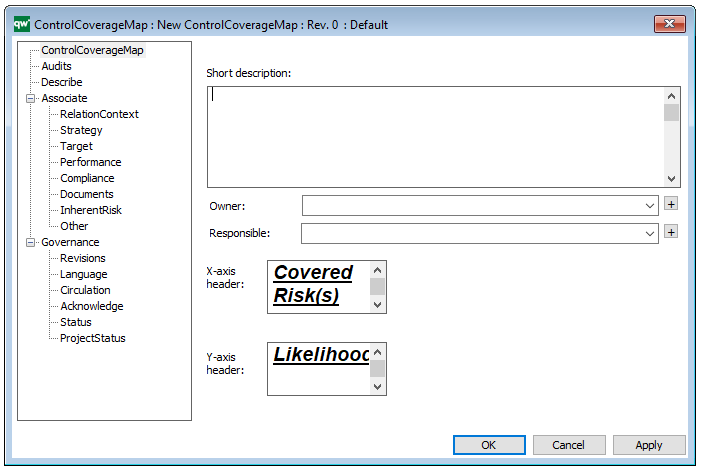
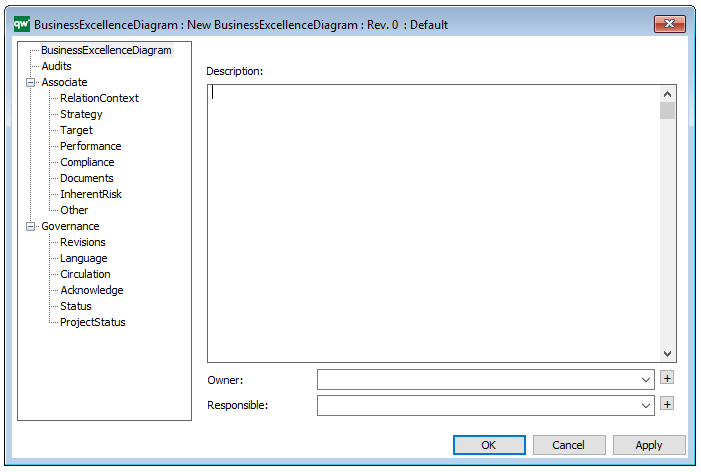
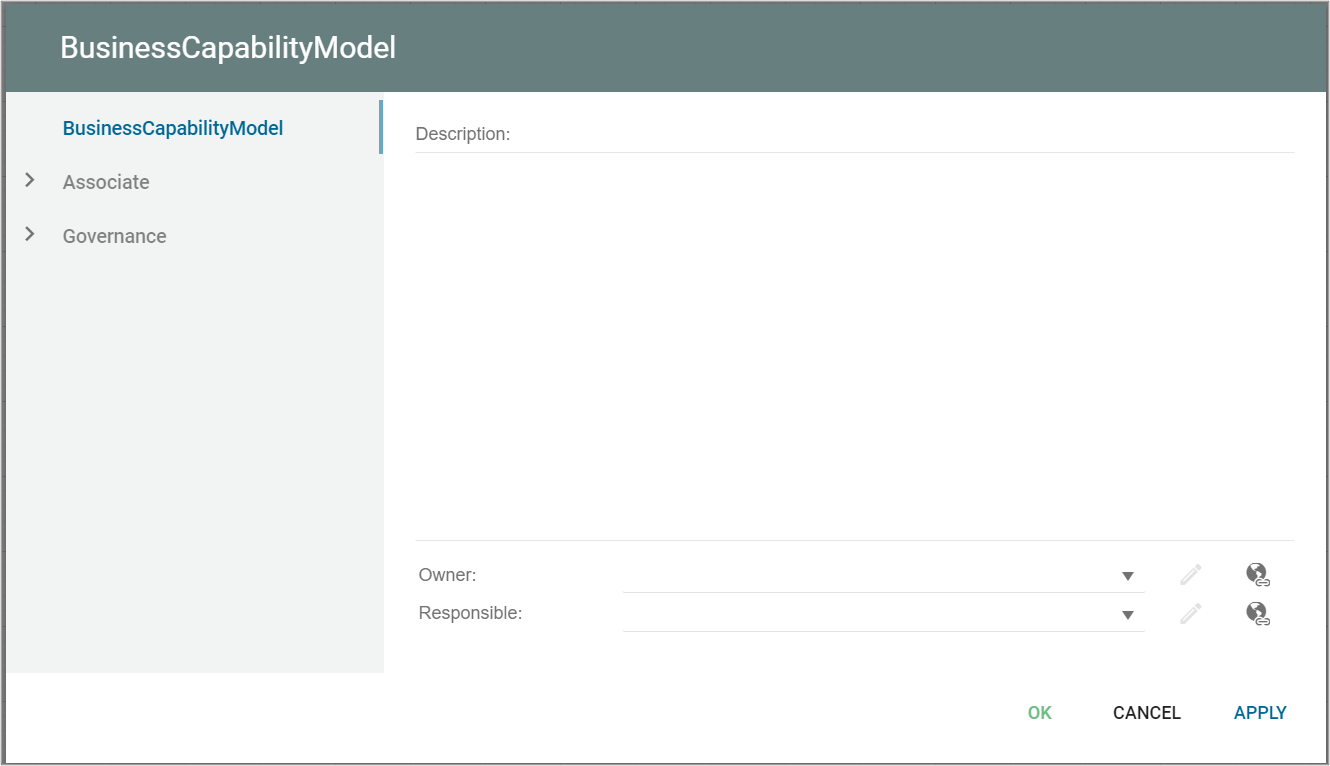
Properties and metadata: The Enterprise Investment Portfolio template can for example retain the following information:

  • A description of the diagram
  • Link to the owner of the diagram
  • Link to the one responsible for the diagram
  • Audits (auto generated information regarding its current state and access rights)
  • Associated documents, diagrams and other objects
  • Inherent Risk detailing risk considerations
  • Governance information detailing information about the published diagram and who has been involved in the approval of the diagram

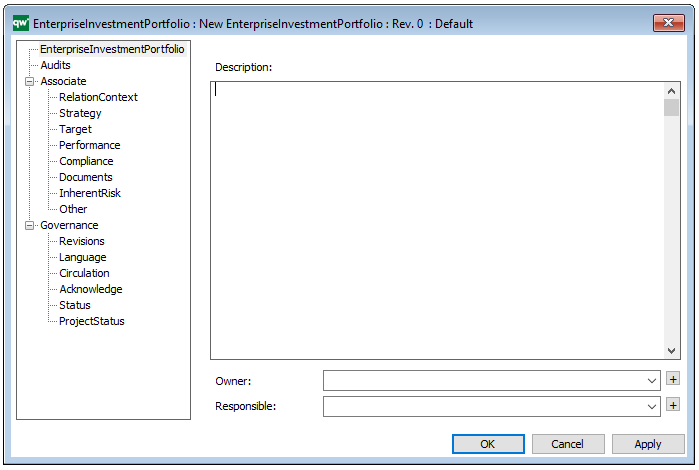
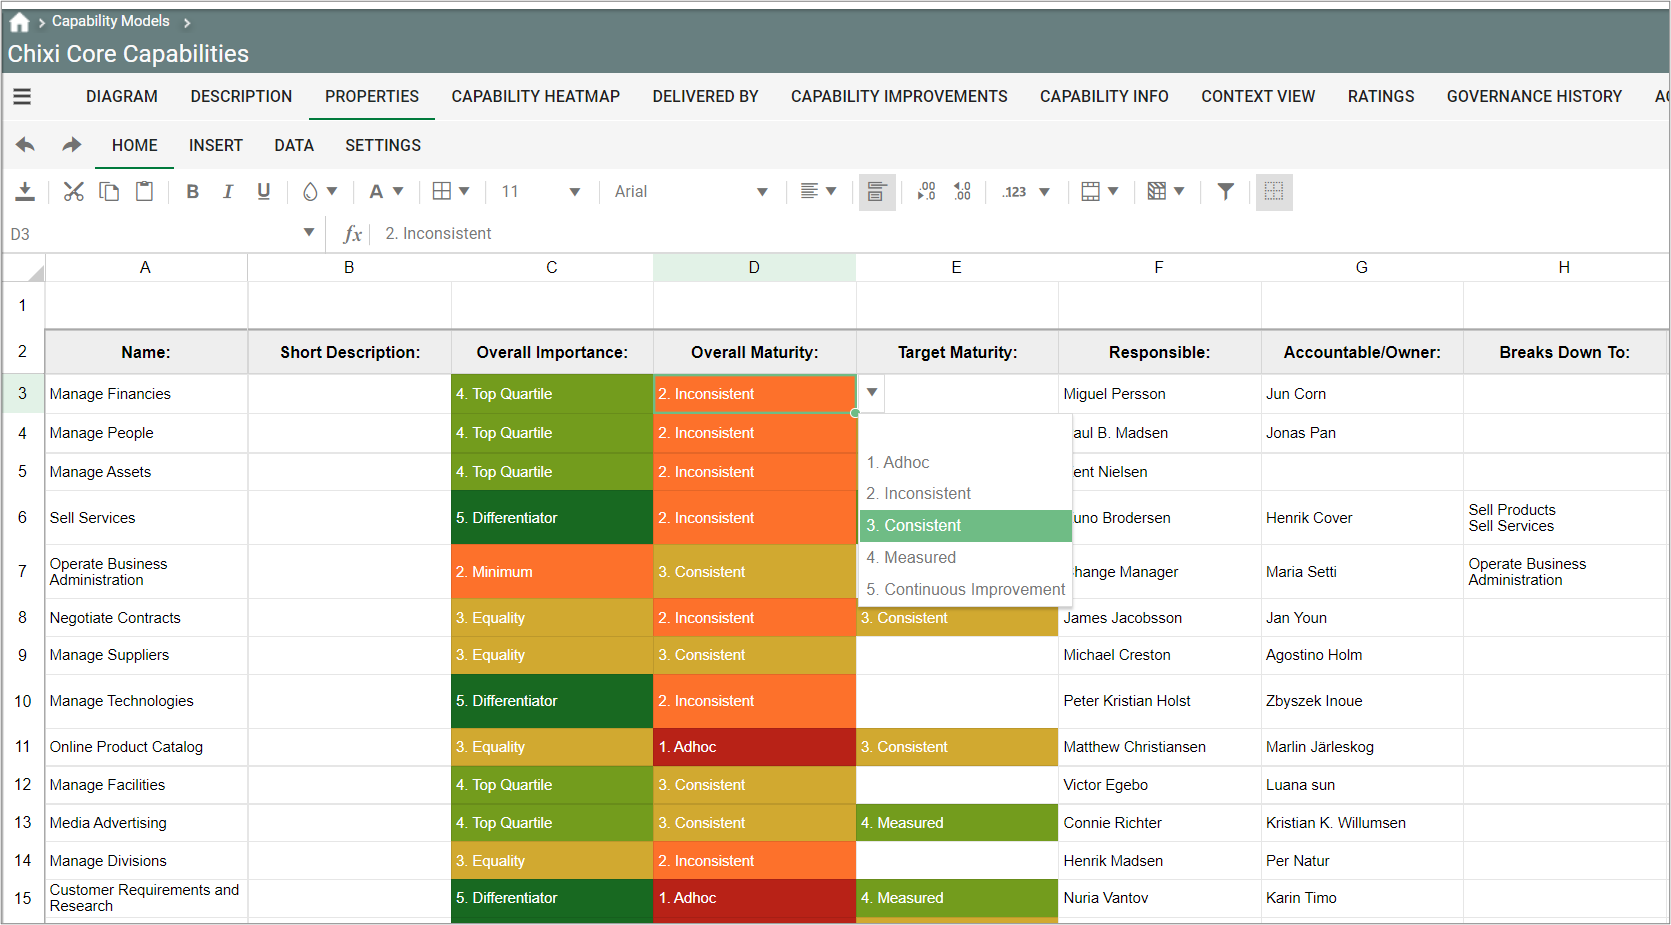
The above picture shows the properties dialogue window for the Enterprise Investment Portfolio template, where you can view and edit the diagram’s Properties in QualiWare Lifecycle Manager.

For more information: This model type is used in the Enterprise Investment Methodology developed by Chris Potts and QualiWare. To learn more about Enterprise Investment, you can about it here:Enterprise Investment.

Decision Model

Purpose: The purpose of the Decision Model template is to document complex decisions by modelling decision trees that illustrates decision gates. Below you can see an example of a Decision Model:

DecisionModel_1

Core concerns: Complex decisions can be documented as decision trees. The model illustrates the Business Decision and its underlying Rule Families. The Rule Families can contain Rule Family Tables, that precisely describe the outcome of a given set of variables. Below you can see an example of a Rule Family Table:

DecisionModel_2

Relation to other templates: Where the Decision Model template illustrates the decision gates, the end to end process is described in either a Work Flow Diagram or a Business Process Diagram.

Properties and metadata: The Decision Model can for example retain the following information:

  • A description of the diagram
  • Link to the owner of the diagram
  • Link to the one responsible for the accuracy of the diagram
  • Audits (auto generated information regarding its current state and access rights)
  • Associated documents, diagrams and other objects
  • Inherent Risk detailing risk considerations
  • Governance information detailing information about the published diagram and who has been involved in the approval of the diagram
  • Project status: information about budgeted and actual man-hours spent, percentage completed and the latest milestone, result and quality control of a change process.

In the picture below you can see the Decision Model’s properties dialogue window, where the information can be viewed and edited:


Dashboard

Purpose: The purpose of the Dashboard template is to publish selections of Business Charts targeting different stakeholders. It should be used to gather a series of relevant or connected Business Charts to provide a dashboard-like overview.

Core concerns: The Dashboard template enables you to gather Business Charts, Key Performance Indicators, Performance Indicators and General Concepts to create stakeholder specific views of analyzed data. For example, an Enterprise Architect could find a Dashboard containing Business Charts relevant to the usage and governance of the Enterprise Architecture useful.

Below, you can see examples of different Dashboards presenting an array of Business Charts:

Dashboard_1


Dashboard_2

Relation to other templates: The Dashboard template is closely connected to the Business Chart template, as the Dashboard publishes the charts the Business Chart template generates.

Properties and metadata: The Dashboard can for example retain the following information:

  • A description of the Dashboard
  • Link to the owner of the Dashboard
  • Link to the one responsible for the Dashboard
  • Audits (auto generated information regarding its current state and access rights)
  • Associated documents, diagrams and other objects
  • Inherent Risk detailing risk considerations
  • Governance information detailing information about the published diagram and who has been involved in the approval of the diagram

The above picture shows the properties dialogue window for the Dashboard template where you can view and edit the dashboard’s properties in QualiWare Lifecycle Manager.

Customer Journey Map

Purpose: The Purpose of the Customer Journey Map template is to document the customer’s journey from awareness to the end of their interaction with an organization, covering possible touch points from the customer’s perspective.

Core Concerns: The Customer Journey Map template allows you to model connections between different Personas, Customer Journey Phases, Touch Points, Goals, Roles, Locations, Channels, Technology and the aspects from a SWOT analysis.

You can choose to model both a current state and a desired future state of the customer journey and use the documentation for process improvement. Below is an example of a current state model and a future state model:

Current state model:

CustomerJourneyMap_2

Desired future model:

CustomerJourneyMap_1

Other functionalities: The customer’s touchpoints can be elaborated upon with four scores for Customer Satisfaction, Customer Importance, Customer Effort and Net Promoter Score. Particularly vital touchpoints can be designated as a Moment of Truth.

Relation to other templates: The Customer Journey Map can be used as a groundwork for a strategic change, which for example can be modelled in a Work Model, a Business Capability Model and/or a Strategy Model.

Properties and metadata: The Customer Journey Map can for example retain the following information:

  • A description of the diagram
  • Link to the owner of the diagram
  • Link to the one responsible for the accuracy of the diagram
  • Audits (auto generated information regarding its current state and access rights)
  • Associated documents, diagrams and other objects
  • Inherent Risk detailing risk considerations
  • Governance information detailing information about the published diagram and who has been involved in the approval of the diagram
  • Project status: information about budgeted and actual man-hours spent, percentage completed and the latest milestone, result and quality control of a change process.

The above picture shows the properties dialogue window for the Customer Journey Map, where you can view and edit the diagram’s properties.

For more information: on Customer Journey Mapping, please view our webinar Experience Mapping – Customer Obsession for IT and Digital Professionals with Milan Guenther and Katharina Weber.


CPM Diagram

Purpose: The Purpose of the Critical Path Method Diagram (CPM Diagram) is to reveal the critical path through a project, i.e. the list of activities that needs special attention since a delay in these activities will delay the whole project.

Core concerns: The CPM Diagram enables you to model Project Activities and connect them with Activity Paths. The Project Activities are then enriched with information about latest and earliest dates for start and finish as well as information about duration and slack for each Project Activity.

This makes it possible to calculate the probability of finishing the project within the planned timeframe, and to successively improve and detail the plan.

Below, you can see an example of a CPM Diagram about how to develop an organization to support a strategic change. It concerns the incoming and outgoing flow of employees as well as their training across several locations:


CPMDiagram_2

As you can see, the critical path is marked with red.

The following example is of a technology roadmap, where the critical path shows the three most critical project activities for on-time completion:

Other functionalities: A Calendar can be linked to the Property Dialog of the diagram showing holidays for the project.

Relation to other templates: The CPM Diagram template should be used after a project has been broken down into Project Activities. As such, it can be a decomposition of a Project Activity from a Business Canvas, Value Proposition, Work Model, Strategy Model or Innovation Canvas.

Properties and metadata: The CPM Diagram ­­­­can for example retain the following information:

  • A description of the diagram
  • Link to owner
  • Link to responsible
  • Link to calendar
  • Audits (auto generated information regarding its current state and access rights)
  • Associated documents, diagrams and other objects
  • Inherent Risk detailing risk considerations
  • Governance information detailing information about the published diagram and who has been involved in the approval of the diagram

The above picture shows the properties dialogue window for the CPM diagram where you can view and edit the diagram’s properties in QualiWare Lifecycle Manager.

Control Coverage Map

Purpose: The purpose of the Control Coverage Map is to provide an overview of uncovered risks, residual risks and potential cost of the risk occurring.

Core concerns: The Control Coverage Map concerns itself with Financial Risk Management and is created using the Actions tabs in QLM. It can be created based on the information in a Risk Heatmap or by using information from a diagram which contains risks that also have control actions.

Below, you can see an example of a Control Coverage map for four risks related to a Bellhouse, a Pump, a Suction pipe and using Check lists:

ControlCoverageMap

The Blue column represents the likelihood of the risk before the control action, the green column represents the likelihood of the risk after the implementation of a control action. The red columns represent the estimated cost if the risk is realized.

Relation to other templates: The Control Coverage Map presents graphical views of information from other diagrams the same as the Heatmap, Business Charts and the Graphical Matrix. It can be used by any diagram containing Activities with attached risks that have control activities.

Properties and metadata: The Control Coverage Map ­­­­can for example retain the following information:

  • A description
  • Link to the owner
  • Link to the one responsible
  • Graphical specification for the headers of the X-axis and Y-axis
  • Audits (auto generated information regarding its current state and access rights)
  • Associated documents, diagrams and other objects
  • Inherent Risk detailing risk considerations
  • Governance information detailing information about the published diagram and who has been involved in the approval of the Control Coverage Map

The above picture shows the properties dialogue window for the Control Coverage Map template where you can view and edit the template’s properties in QualiWare Lifecycle Manager.

Business Excellence Diagram

Purpose: The purpose of the Business Excellence Diagram template is to describe a measuring tool based on The European Foundation for Quality Management Excellence Model (EFQM).

Core concerns: The Business Excellence Diagram enables you to model Business Scopes, Criterion and Sub Criterion. These aspects can then be connected by Criterion Influencers.

Below, you can see an example of a Business Excellence Diagram for the Leadership of an organization. The diagram is structured according to the EFQM and shows the overall scores for the leaderships performance:

Other areas covered in the EFQM are Policy & Strategy, People, Partnerships & Resources, Processes, Customer Results, People Results, Society Results and Key Performance Indicators.

Relation to other templates: The Business Excellence Diagram is a strategic template that is complimentary to the Business Capability Model, Stakeholder Model, Business Canvas, and Strategy Model

Properties and metadata: The Business Excellence Diagram ­­­­can for example retain the following information:

  • A description of the diagram
  • Link to the owner of the diagram
  • Link to the one responsible for the diagram
  • Audits (auto generated information regarding its current state and access rights)
  • Associated documents, diagrams and other objects
  • Inherent Risk detailing risk considerations
  • Governance information detailing information about the published diagram and who has been involved in the approval of the diagram

The above picture shows the properties dialogue window for the Business Excellence Diagram template, where you can view and edit the diagram’s properties in QualiWare Lifecycle Manager.

For more information: To learn more about the EFQM, please visit their website, where you can also find an overview of the EFQM Excellence Model.

Business Ecosystem

Purpose: The purpose of the Business Ecosystem template is to enable an organization to understand itself from an outside-out perspective by modelling the environment in which the organization is embedded.

Core concerns: The Business Ecosystem supplies five elements to model with: Business, People, Things, Business Interaction and Business Moment. The Business Ecosystem template should primarily be used for modeling entities outside the enterprise to identify new business opportunities in the form of Business Moments.

BusinessEcoSystem

Above you can see a model of a Business Ecosystem. The blue areas are Business Moments, where the interactions between People, Businesses and Things create business opportunities for your enterprise.

Relation to other templates: The Business Ecosystem model is based on the Enterprise Design theories and is as such in the same family as the Customer journey map.

The Business Ecosystem is a strategic model and can be used to document a strategic possibility or track along with for example Business Capability Models, Strategy Models, and Work Models.

Properties and metadata: The Business Ecosystem can for example retain the following information:

  • A description of the diagram
  • Link to the owner of the application architecture
  • Link to the one responsible for the application architecture
  • Audits (auto generated information regarding its current state and access rights)
  • Associated documents, diagrams and other objects
  • Inherent Risk detailing risk considerations
  • Governance information detailing information about the published diagram and who has been involved in the approval of the diagram
  • Project status: information about budgeted and actual man-hours spent, percentage completed and the latest milestone, result and quality control of a change process.

For more information: If you want to learn more about Enterprise Design, we have a four-part webinar by Milan Guenther available for viewing. You can also visit Milan’s website, where you can learn more about the Enterprise Design framework.

Business Capability Model

Business Capability model with new symbol design

Purpose: The purpose of the Business Capability Model template is to provide an overview of the of the state and health of an enterprise in the form of its Capabilities.

Core concerns: The Business Capability Model is a simple template that by default only allows for the modelling of Capabilities with the possibility to add notes if needed. The metadata of the Capabilities – such as status and importance can then be graphically displayed in the business capabilities to create a useful overview.

The stripe on the left side to represent Business Importance and two dots representing Business Maturity and Target Maturity. The new design scales better and provides management with a single view of important strategic capabilities with a plan for improvements. Also it allows the business architect to highlight a set of capabilities by coloring the symbol’s background – a widely used technique.

Business Capability model with new symbol design

In the picture above you can see an example of a Business Capability Model. Here the Business Capabilities are grouped in different areas and the status and importance of them are shown by their green, yellow or red colorings.

In this Business Capability Model (shown above), more attributes are shown at the right-hand side of the Capability. This way you can get a more detailed view of the state of your enterprises Capabilities.

Other functionalities: Using the Analysis tool, the information from the Business Capability Model template can generate maturity- and score heat maps, hierarchies, score views, capability contexts, gap analyses, dashboards, and what-if-, impact- and investment analyses.

Relation to other templates: The Business Capability Model is a strategic template and is as such complimentary to for example the Strategy Model and Work Model. It can be used to illustrate a change process going from one set of capabilities to another. A Capability can link to the Business Processes that uses it as well as the resources it employs. This way it can also be analyzed which Business Processes would be affected by the improvement or worsen of a given Capability.

It is easy to update and analyse the capability models via the standard views on the web:

  • The capabilities in a Business Capability Model can easily be scored and presented in filterable and editable lists via the spreadsheet functionality in e.g. the Properties view

  • The capabilities can be presented in a Capability heatmap

  • From the Delivered by view you can analyze and update relations between capabilities and initiatives, processes, applications and information-objects.

Properties and metadata: The Business Capability Model can for example retain the following information:

  • A description of the diagram
  • Link to the owner of the diagram
  • Link to the one responsible for the accuracy of the diagram
  • Associated documents, diagrams and other objects
  • Inherent Risk detailing risk considerations
  • Governance information detailing information about the published diagram and who has been involved in the approval of the diagram
  • Project status: information about budgeted and actual man-hours spent, percentage completed and the latest milestone, result and quality control of a change process.

The above picture shows the properties dialogue window for the Business Capability Model where you can edit the diagram’s properties.

Note that the Capabilities’ metadata that are exhibited in the Business Capability Model is not further described here as they belong to the Capability object and not the Business Capability Model template.

Business Canvas

Purpose: The Business Canvas, is a strategic management and entrepreneurial template. It allows you to describe, design, challenge, invent, and pivot your business model.

Core Concerns: The core elements of the business canvas are framework cells that define a strategic or organizational entities and, if needed, connections between them. The Business Model can be structured any way you wish. The most well know structure of a business model is Alexander Osterwalder’s Business Model Canvas.

BusinessCanvas_1

The above picture shows a blank Business Model Canvas where each area is represented by a framework cell.

The strategic or organizational entities can then be enriched with an extended portfolio of strategic symbols such as vision, mission, goals, stakeholders, information systems and business processes.

Full content list of the extended portfolio:

  • Vision
  • Mission
  • Business Object
  • Market
  • Competitive Advantage
  • Technology
  • Competence
  • Capability
  • Performance Indicator
  • Business Function
  • Business Process
  • Organization Unit
  • Stakeholder
  • Information System
  • External Entity
  • Location
  • Channel
  • Goal
  • Opportunity
  • Threat
  • Trend
  • Material Asset
  • Intellectual Capital Asset
  • Business Rule
  • Key Performance Indicator


The picture below shows a Business Model Canvas that is filled out with symbols from the extended portfolio.

BusinessCanvas_2

Relation to other templates: The Business Canvas can link to multiple related templates detailing the businesses capabilities, business processes, strategy and more.

Properties and metadata: The Business Canvas Diagram can for example retain the following information:

  • A description of the diagram
  • Link to the owner of the application architecture
  • Link to the one responsible for the application architecture
  • Audits (auto generated information regarding its current state and access rights)
  • Associated documents, diagrams and other objects
  • Inherent Risk detailing risk considerations
  • Governance information detailing information about the published diagram and who has been involved in the approval of the diagram