New Desktop Feature
- New user interface: Dashboard-UI implemented for Desktop
- Personalized Desktops
- New desktops for CSRD, DORA, Asset Management, Capability Management, Composable Business, Business Transformation and others
- NAF support, UAF support. improvements to ArchiMate XML
- Configurable structures of relevant subset of repository explorer
- New “Pin-to-My-desktop” feature
New Features
Enhancements in front-end
- New menu UI
- Attribute preview in Visualizer, Rep.Expl, Webmodeler
- Inline editing of object properties e.g. directly from preview
- Spreadsheet support for propertysheets translation, revisions and XYZ-link matrices
- Smart “Add row” and “Add Column” in spreadsheet
- New visualizations: Framed, Column, Combo, Hierarchy
- TreeList support for standard GovernanceWorkflows e.g. Promote, Approve, Revision
- Web-dialogs become non-model, movable and minimizable. Multi object editing in web-dialogs
Enhancements in Web-Modeler
- New UI in Web-modeler
- QWM: New Diagram Types
- Favorite/full/Value-only support in properties
- Governance support in Web-modeler
- Right-click to set options on symbols and connections in the Web-Modeler
- “Context”-event introduced in BPMN diagram
- Support for accordions and sub-symbol-selection in web-modeler
- Improved performance for Save-Load in QWM
New AI Features
- Support for AI Chatbot
- Support for Response ontologies and AI-based generation of objects with non-graphical relations. New predefined KnowledgeScopes
- AI supported PowerPoint presentation generator
- Support for AI usage analysis (EU directive)
New APP
Additional enhancements
New user interface: Dashboard-UI implemented for Desktop
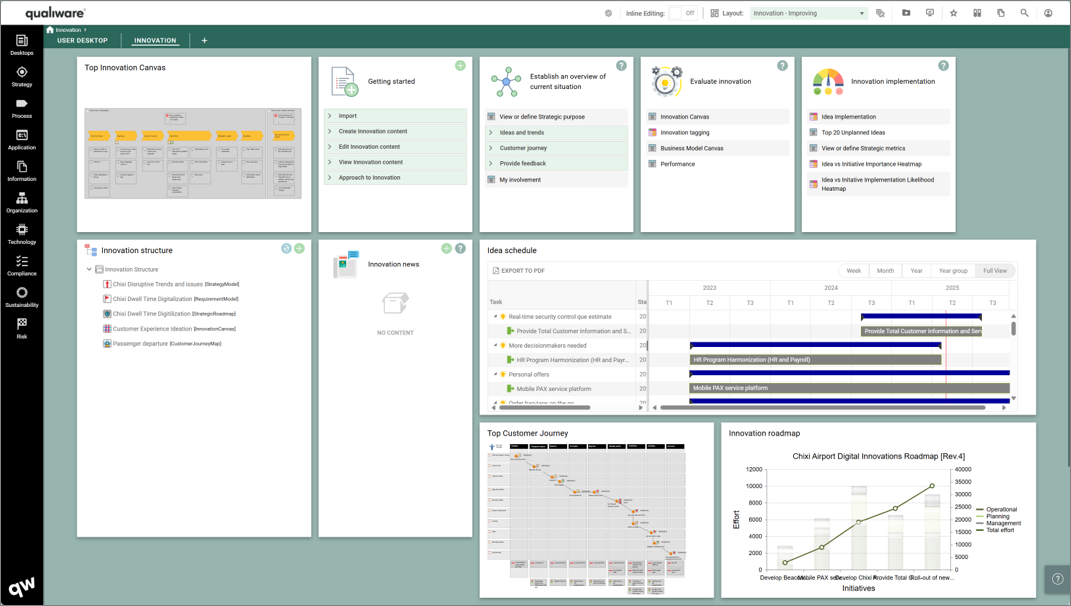
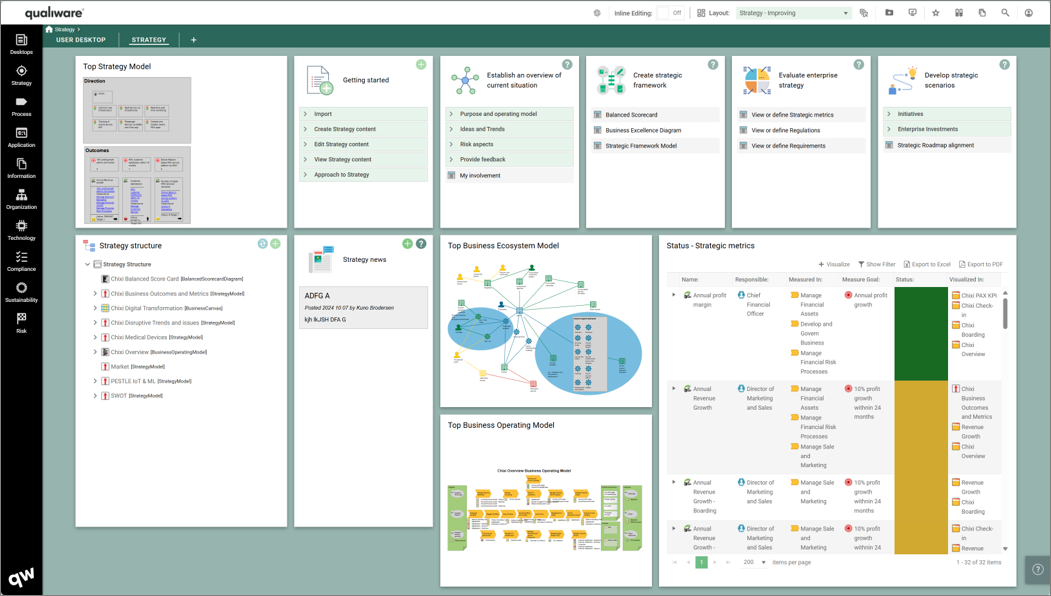
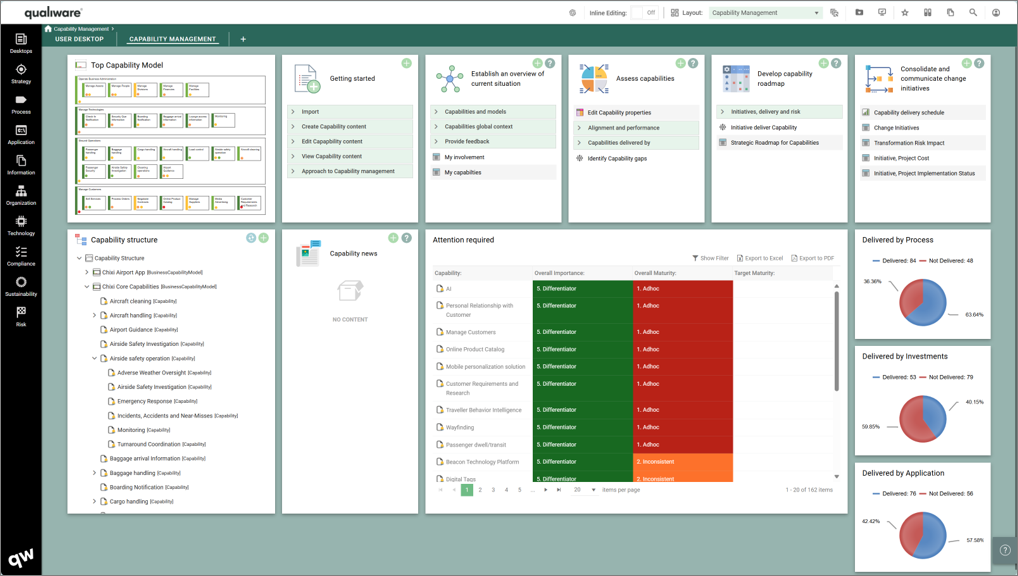
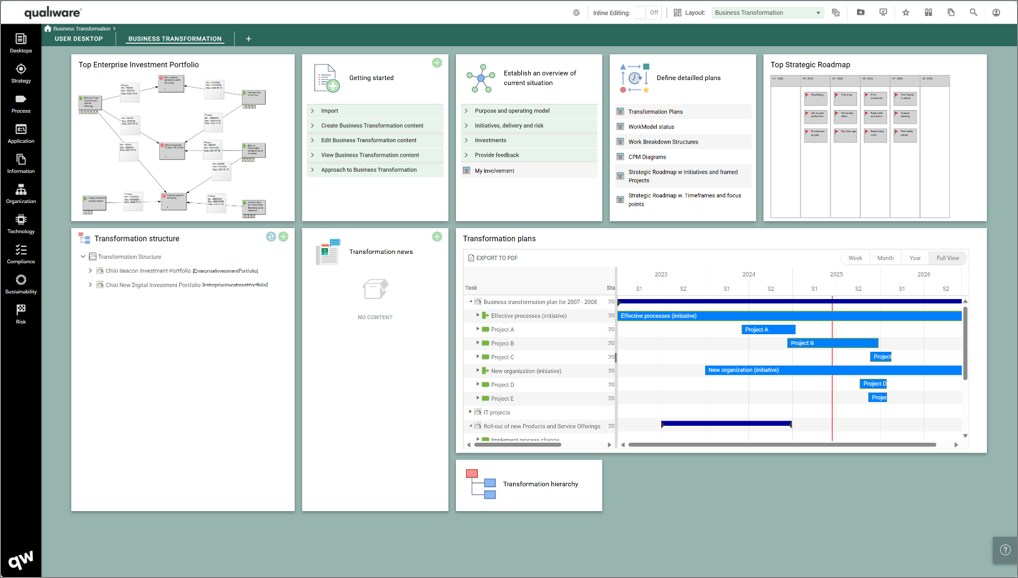
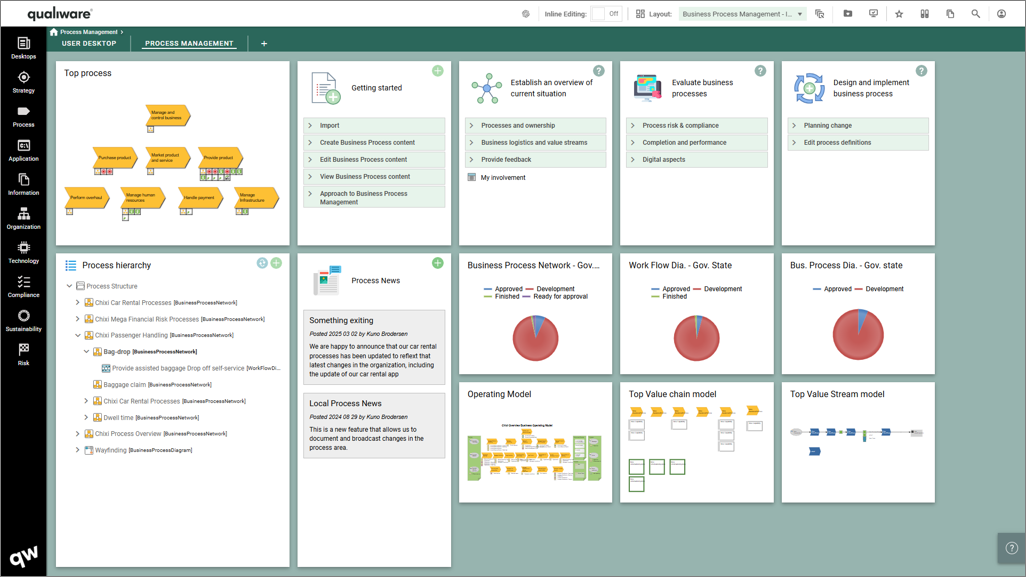
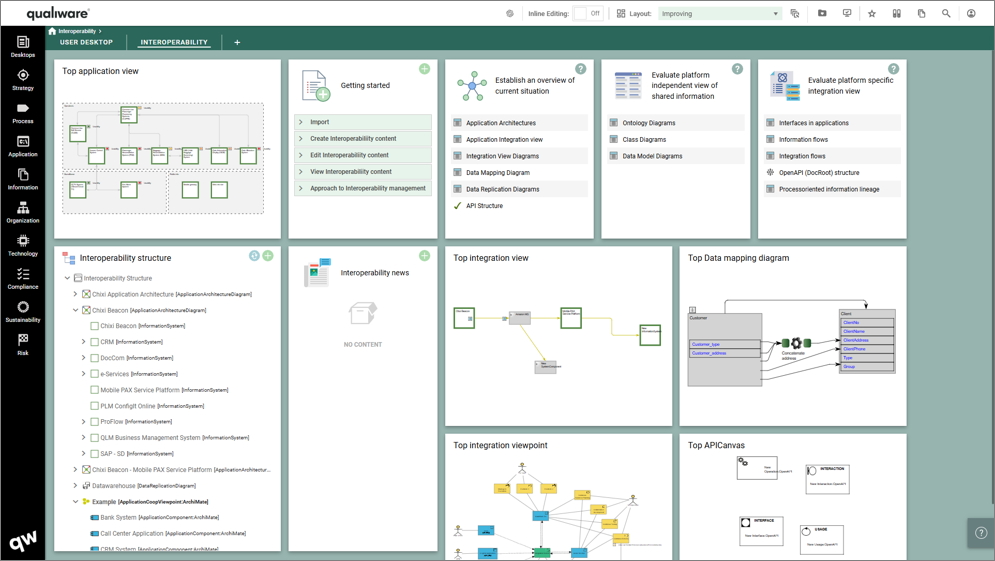
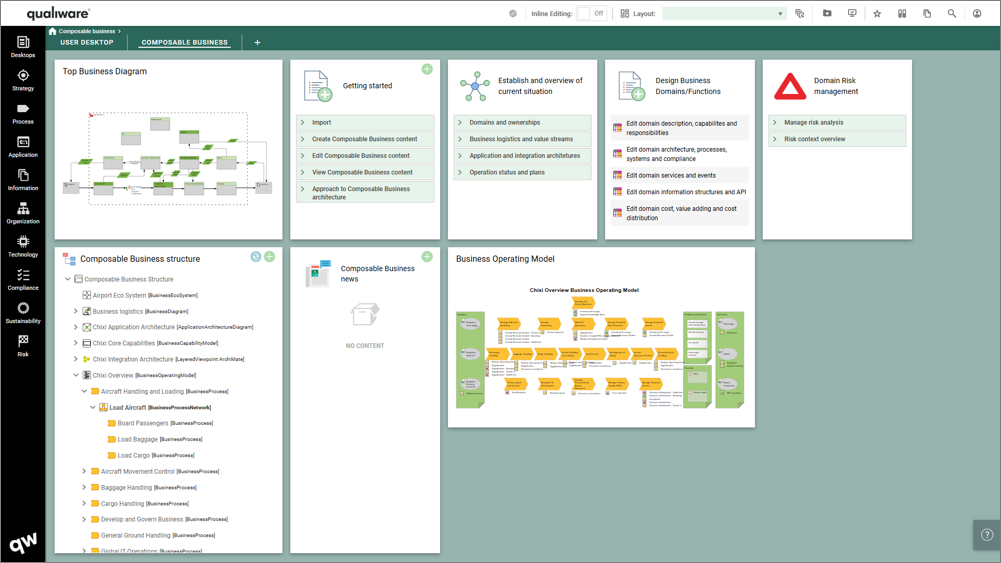
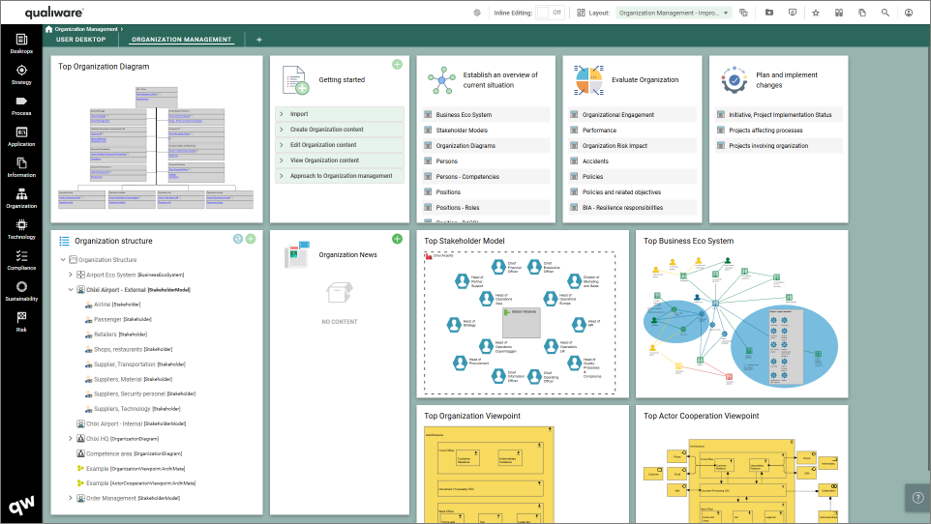
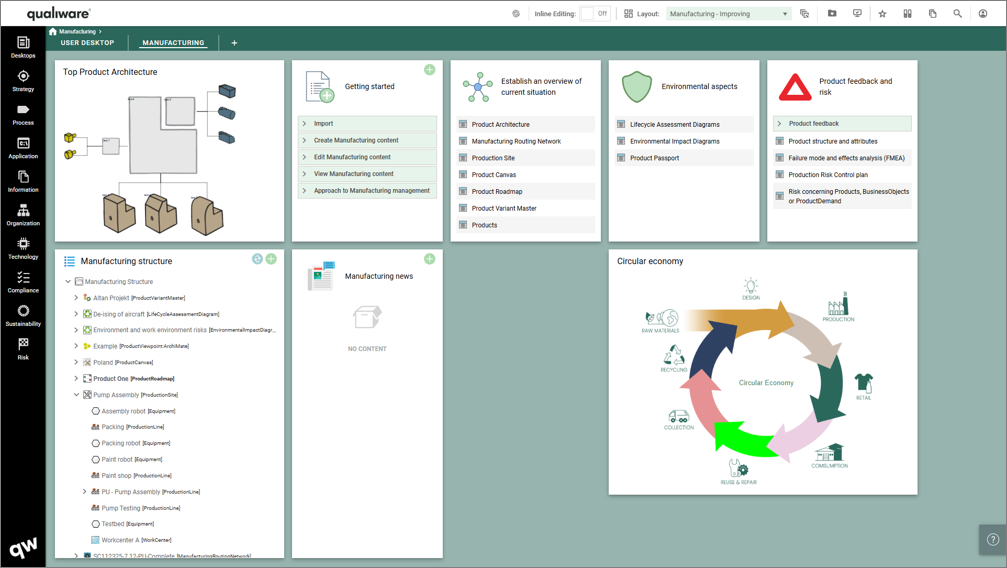
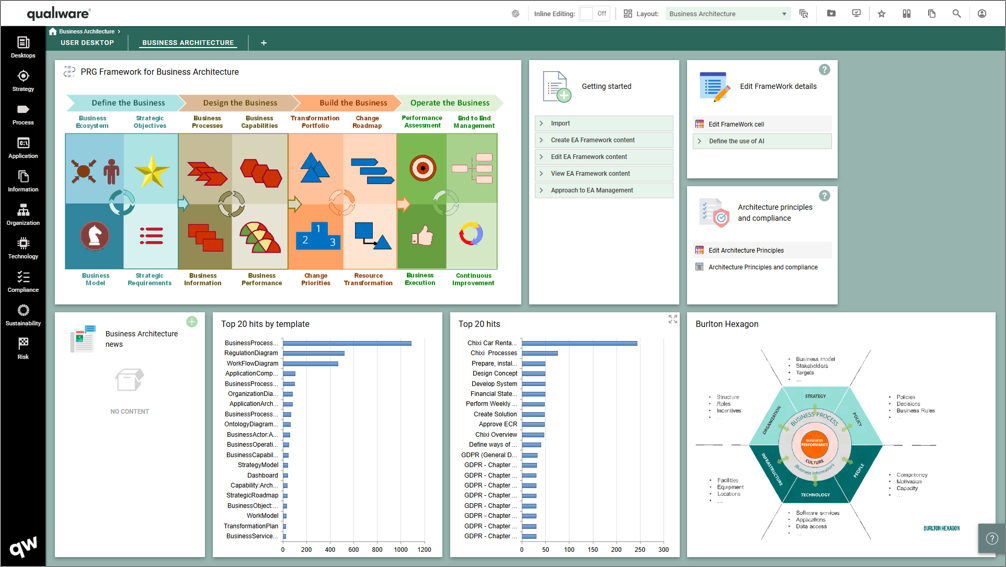
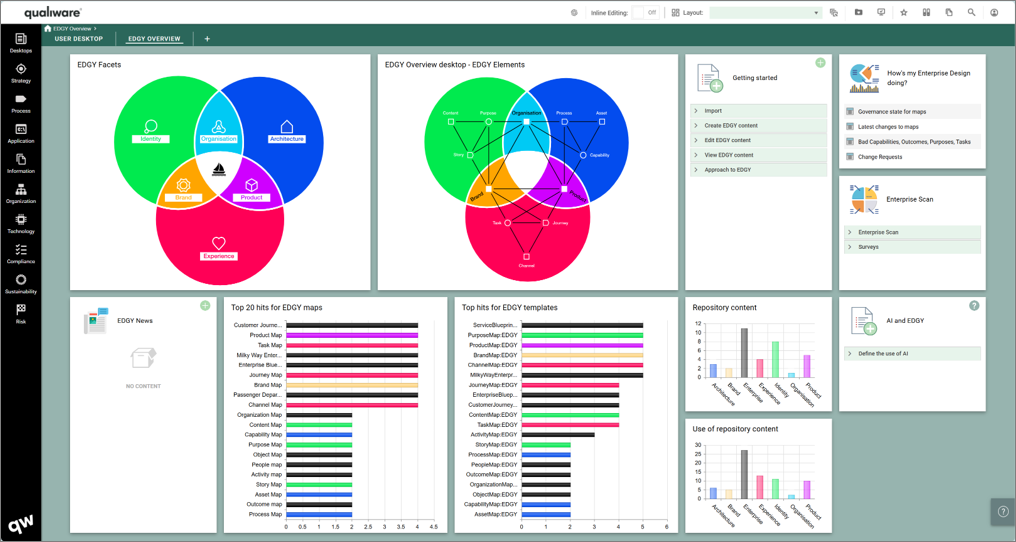
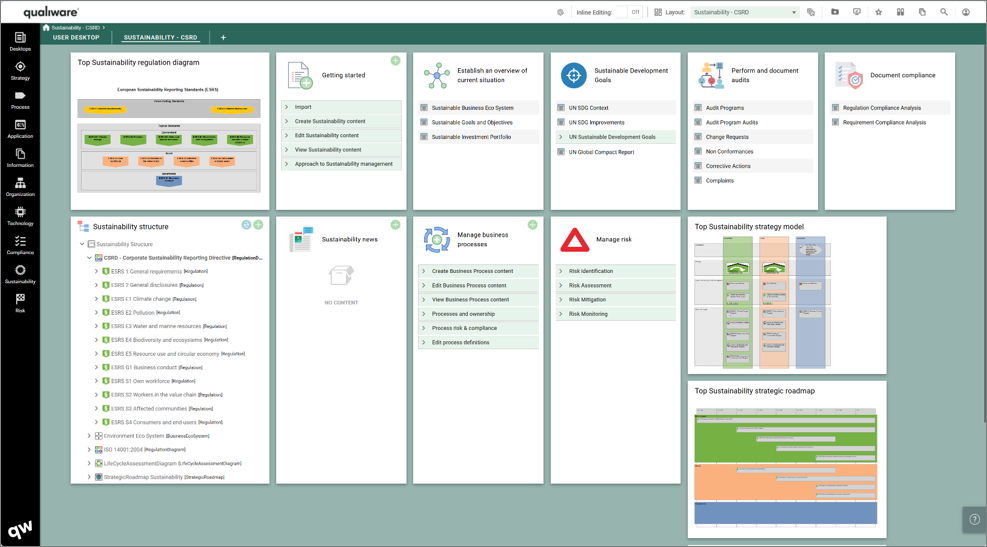
QualiWare 10.10 introduces a whole set of purpose-based Desktops, each focusing on a dedicated subset of an architectural aspect, architectural framework or one or more areas within governance, risk or compliance.
The new set of desktops captures all relevant parts for your task at hand in each of the dedicated desktops, being it capability, application or process management, or documenting compliance for an ISO-standard or the new CSRD, NIS2, DORA, GDPR or other regulations.
As a user you will typically only use one or a few of the desktops, and it is possible to select among available desktops and add or remove them as tabs to your workspace.

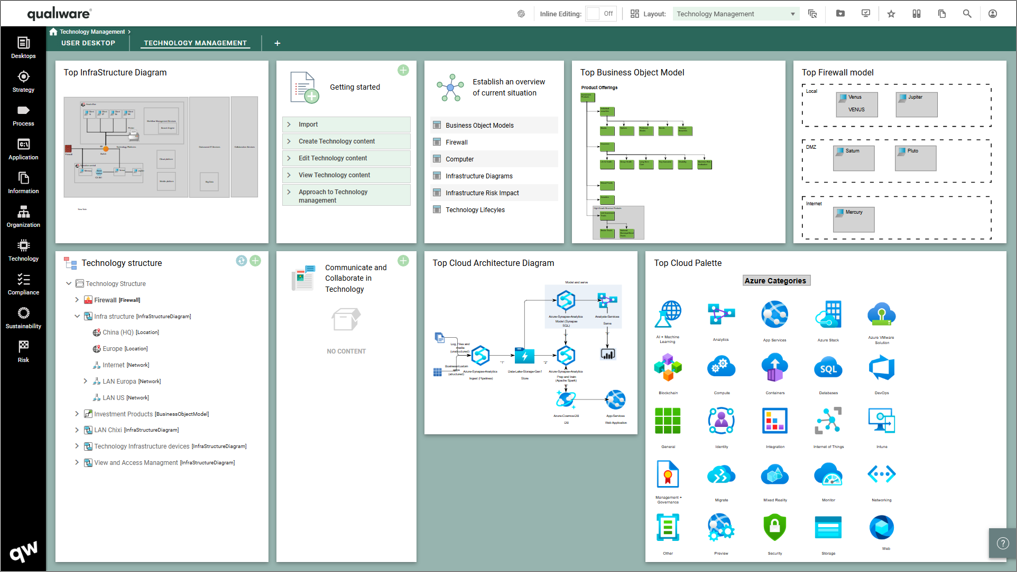
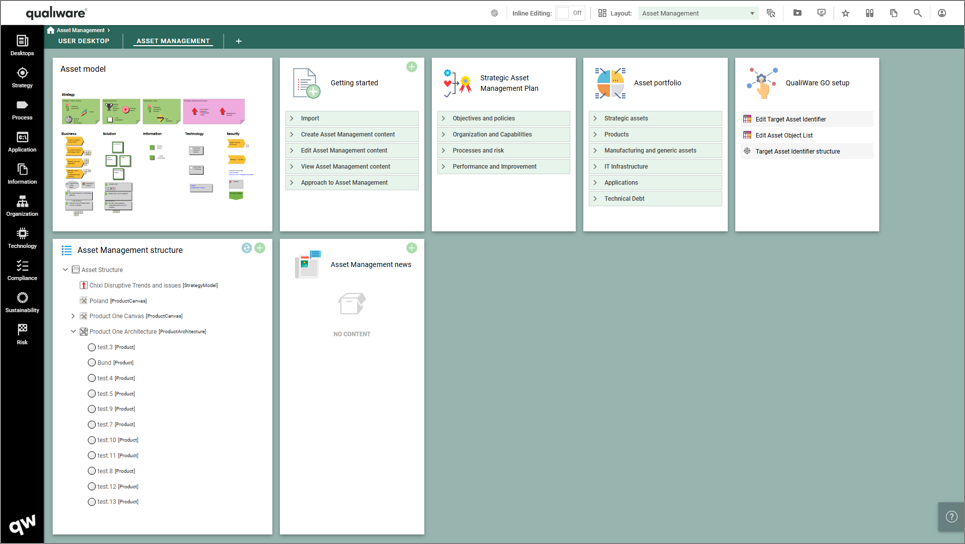
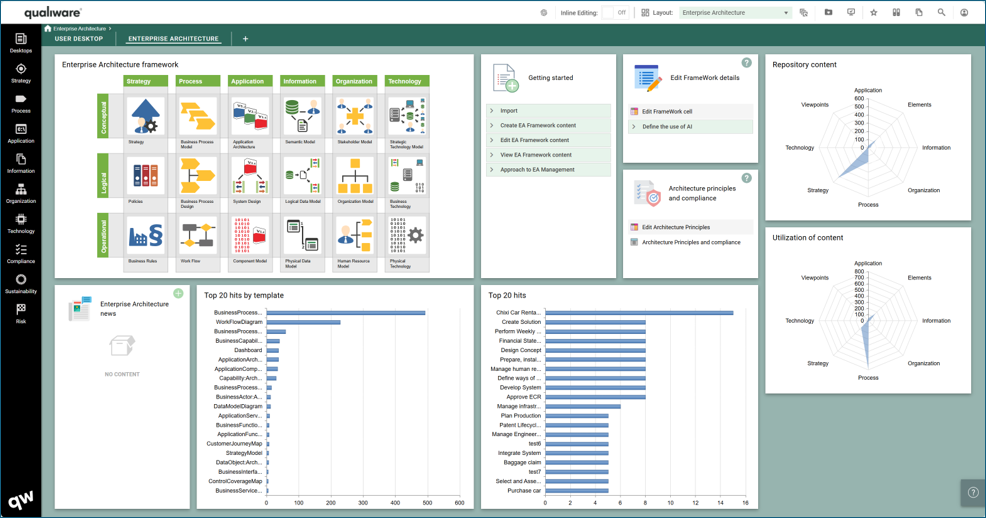
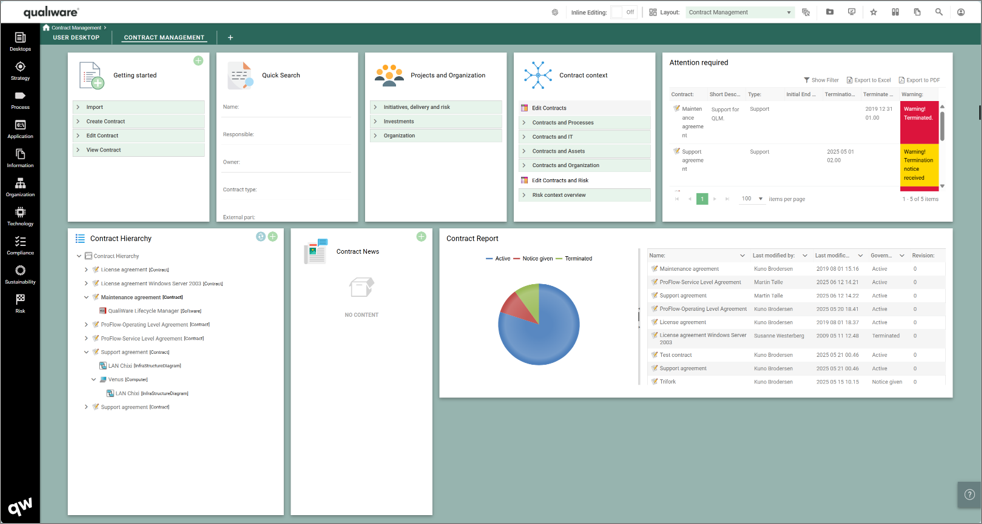
All desktops are structured around the same high-level layout, allowing the users to get fast and easy access to the content and features they are looking for.

- Top Diagram for the content in the desktop
- Purpose based tiles, which support the whole journey within a specific domain from:
-
- getting started
- exploring the current situation
- analyze/improve the content
-
- Hierarchy view, collection of most relevant content within the desktop focus
- News section, a “local” desktop news feed, where users can collaborate and share relevant news
- Metrics and additional diagrams, showing KPIs, charts, and additional content
Read more about the new Desktops here.
User Specific and Personalized Desktops
Every user has a Personal Desktop as a starting point.
A user can pin any diagram or content from other desktops to the personal desktop, hence creating a personal desktop with the relevant content from the repository.
As with any other desktop, all tiles can be hidden, re-sized and re-organized by drag and drop.
A user can save/remove the “Personal layout”, and at any time the standard layout can be reloaded.
Once a “Personal layout” is created it will be shown as default for the Desktop, and the user can “Load Standard Layout” if needed.


You can see more about personalizing desktops here.
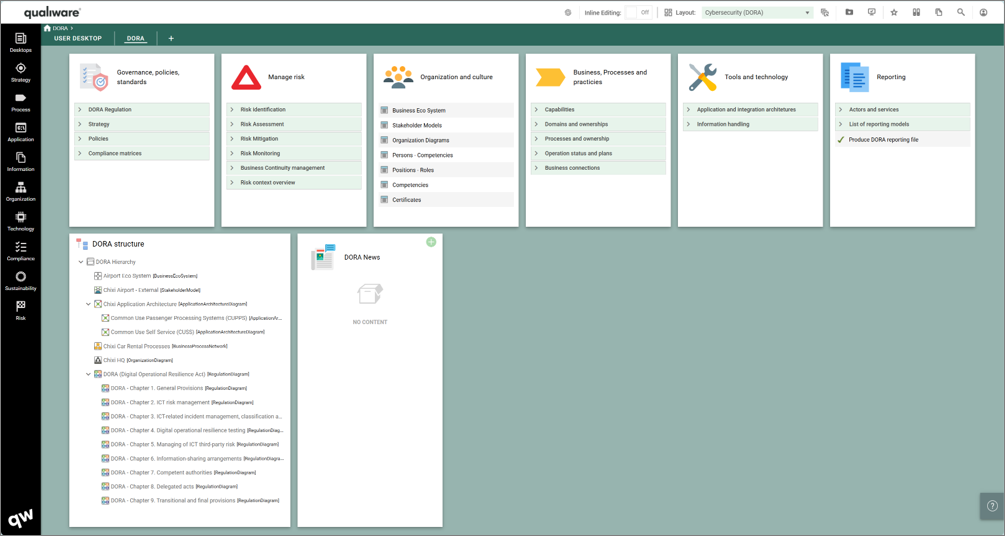
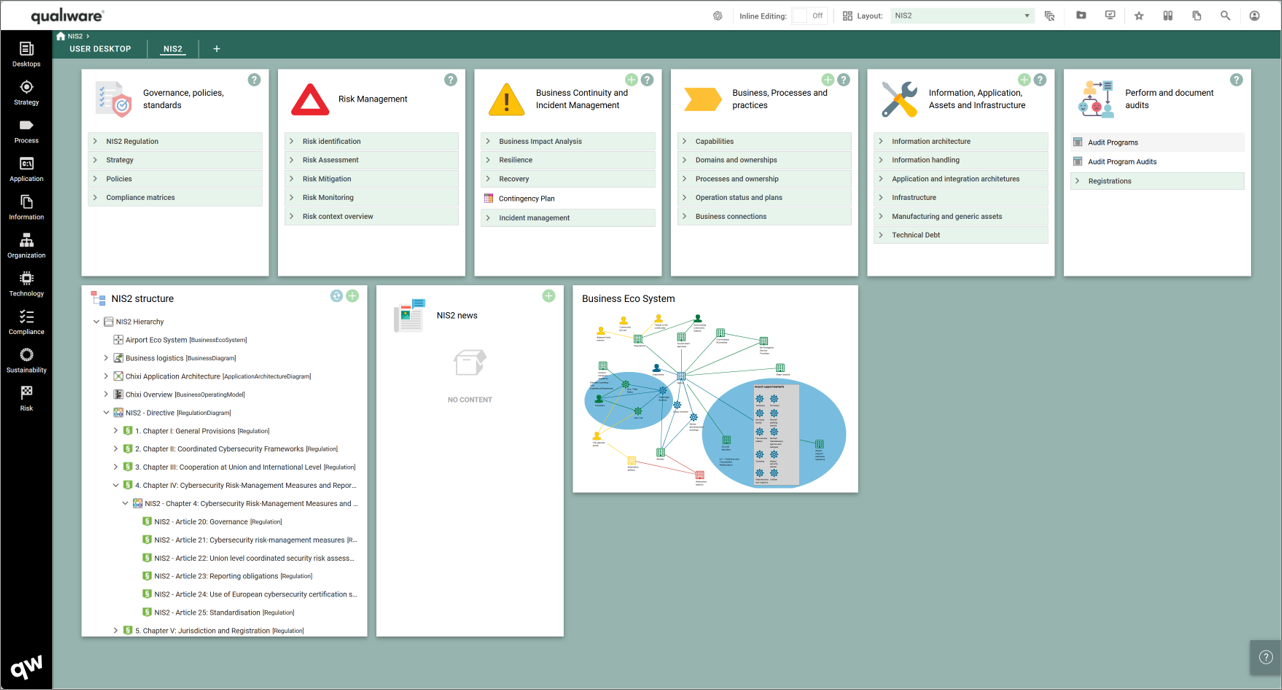
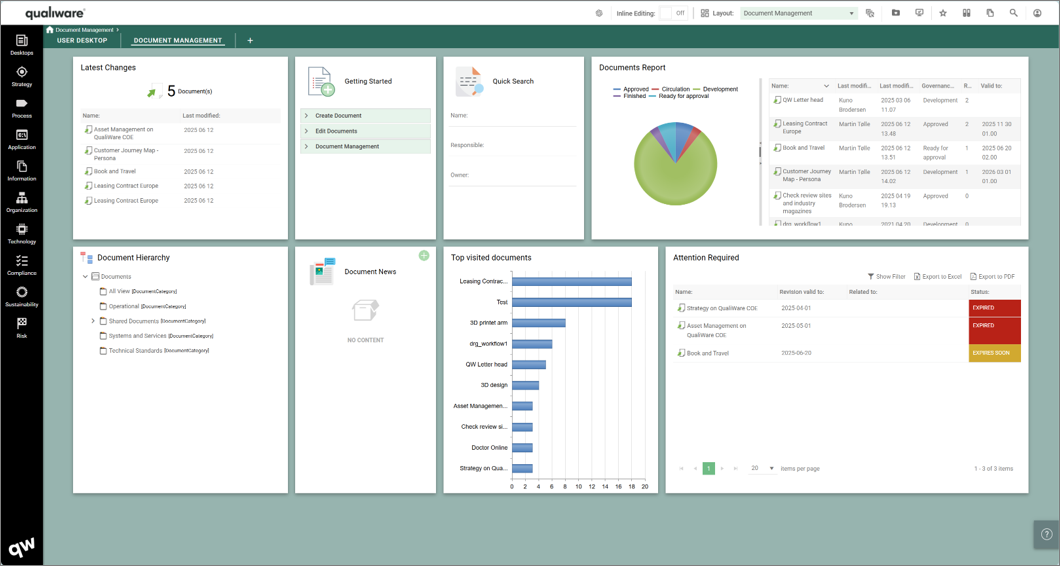
New desktops for CSRD, DORA, NIS2, Document Management, Capability Management, Business Transformation and more
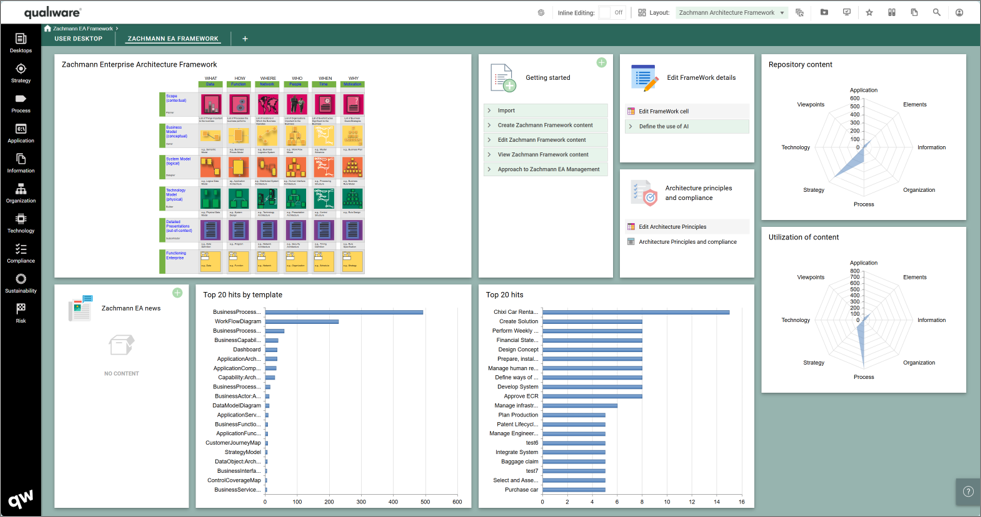
As part of the new purpose driven Desktops 10.10 brings customized Desktops for a comprehensive set of pre-configured focus areas.
Each new desktop is purpose-built to support specific tasks—whether it’s capability, application, or process management, or documenting compliance with ISO standards or regulations such as CSRD, NIS2, DORA, and GDPR.
The tool contains a comprehensive set of standard desktops, each focusing on an architectural aspect, architectural framework or one or more areas within governance, risk or compliance.

- Business Aspects:
- Desktops focusing on the full journey within an architectural or business domain, e.g. capability, application, process or manufacturing
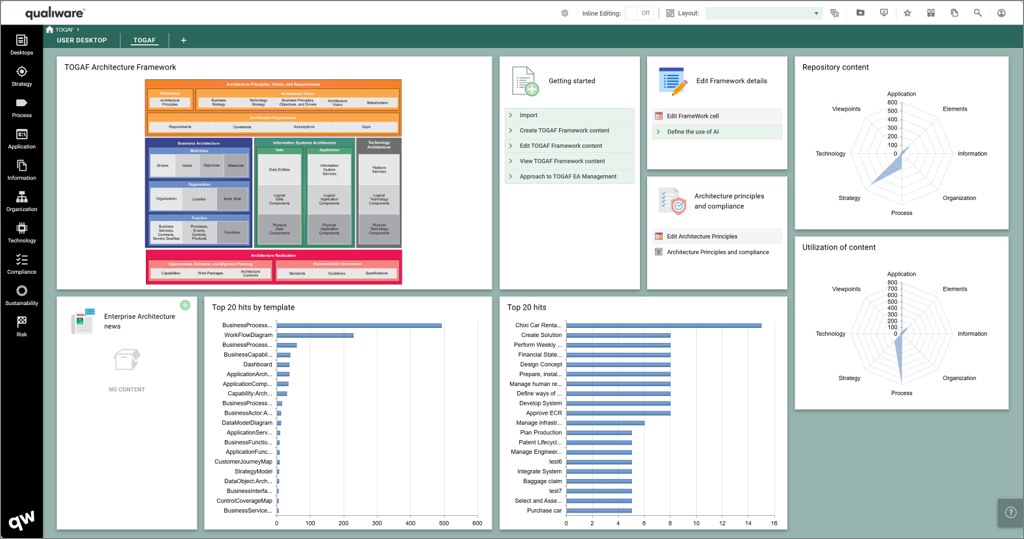
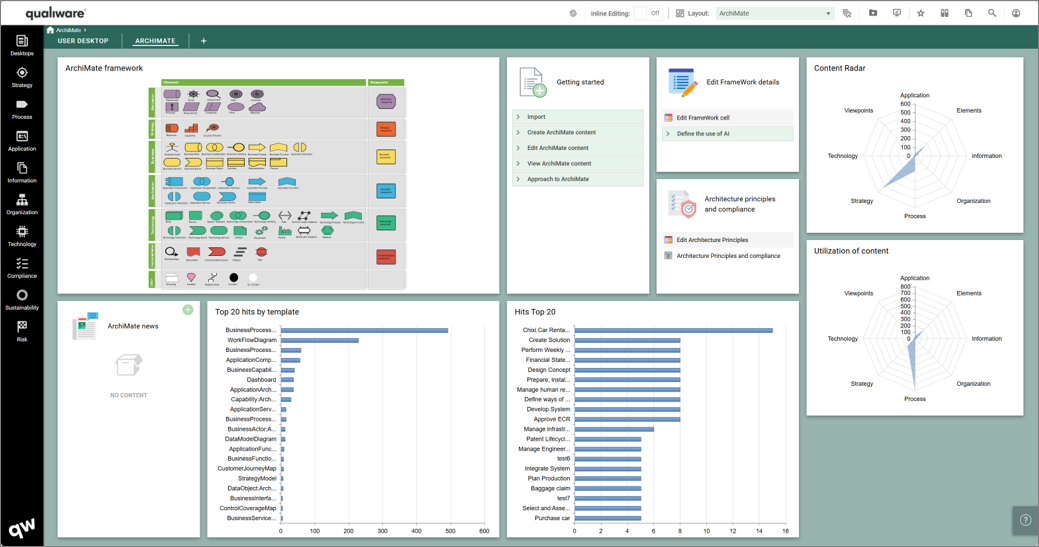
- Architectural Frameworks:
- Desktops focusing on an Architectural Framework, and how it is applied and used within the organization
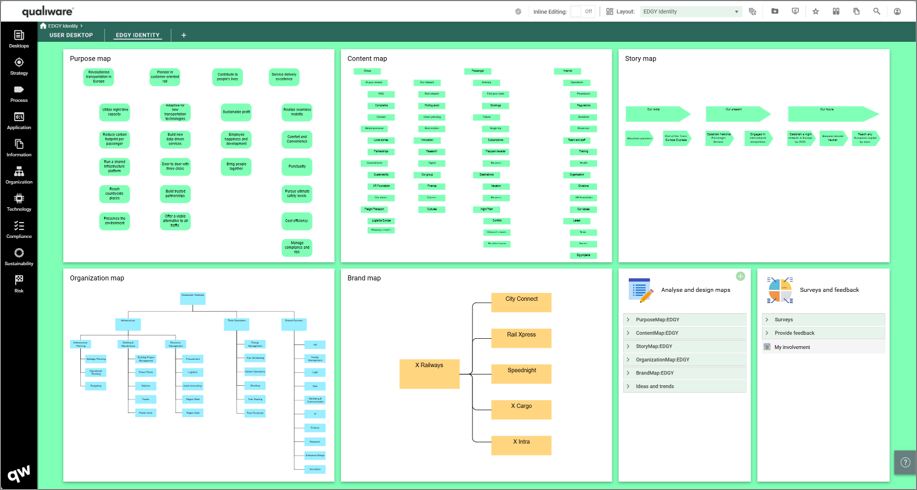
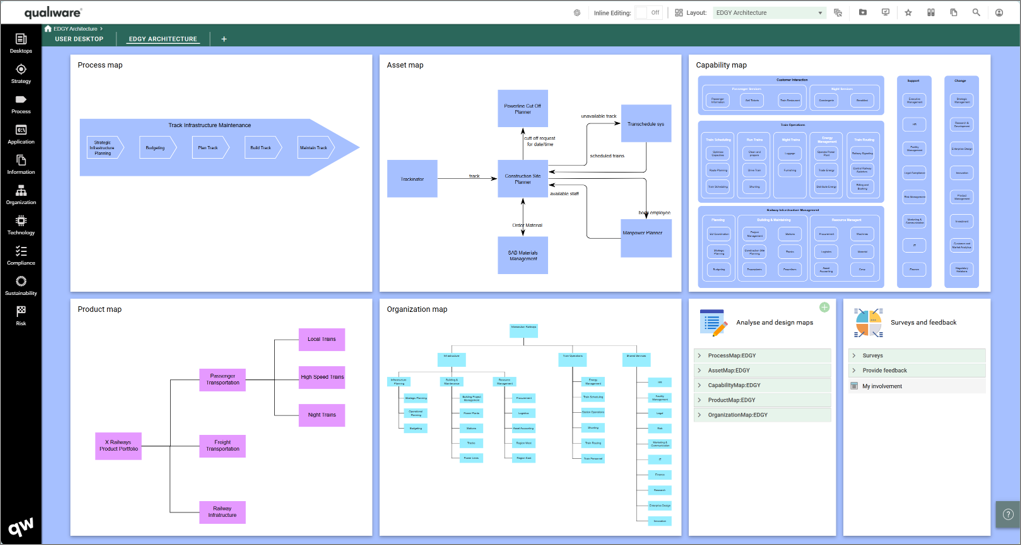
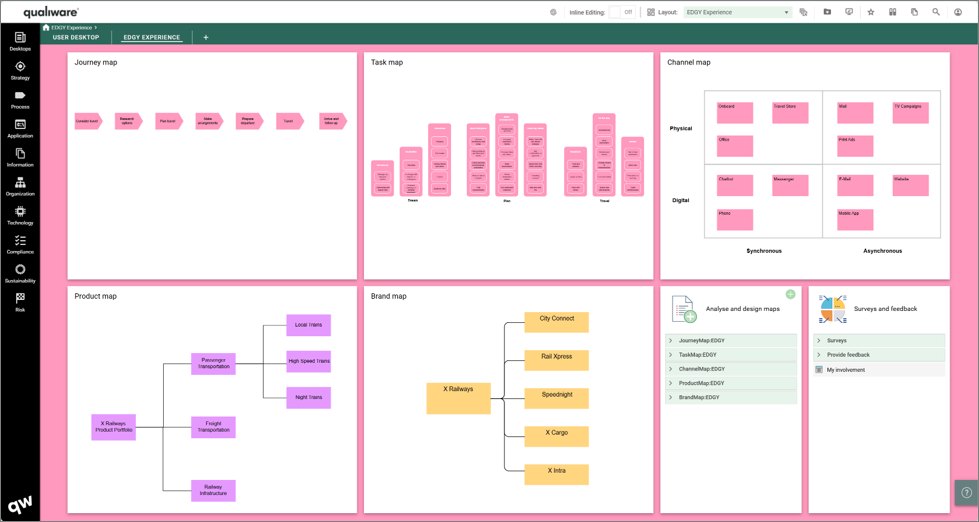
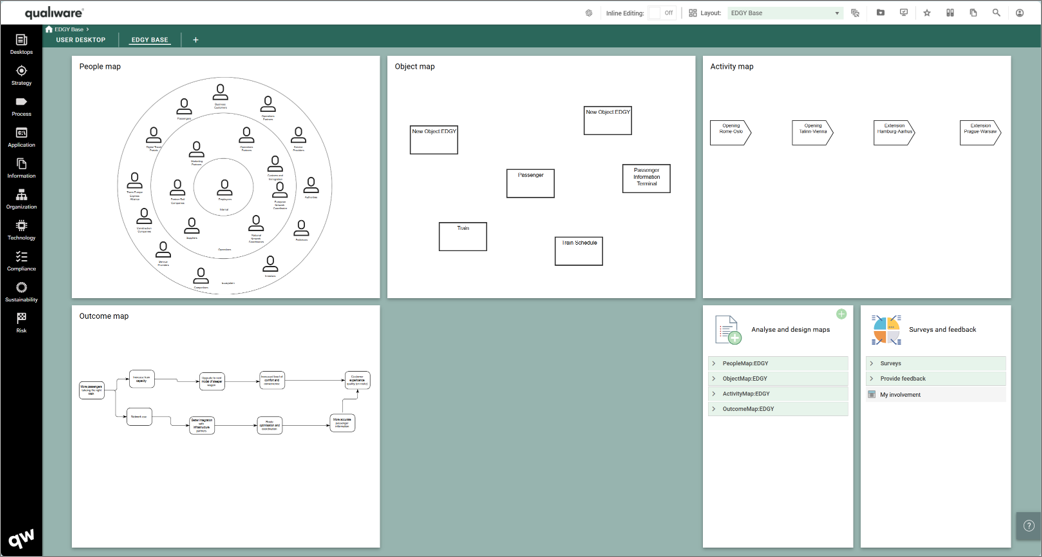
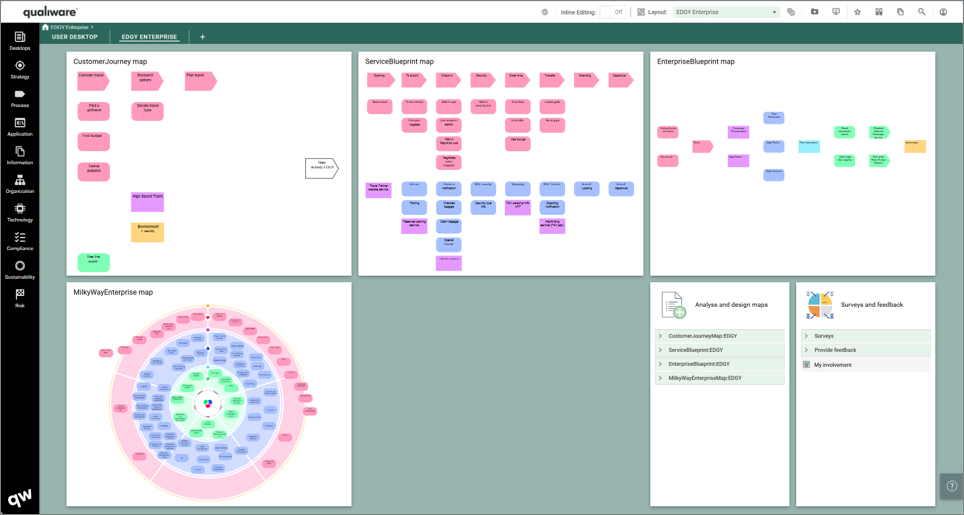
- Enterprise Design
- A set of Desktops tailored to the EDGY Framework and its different facets
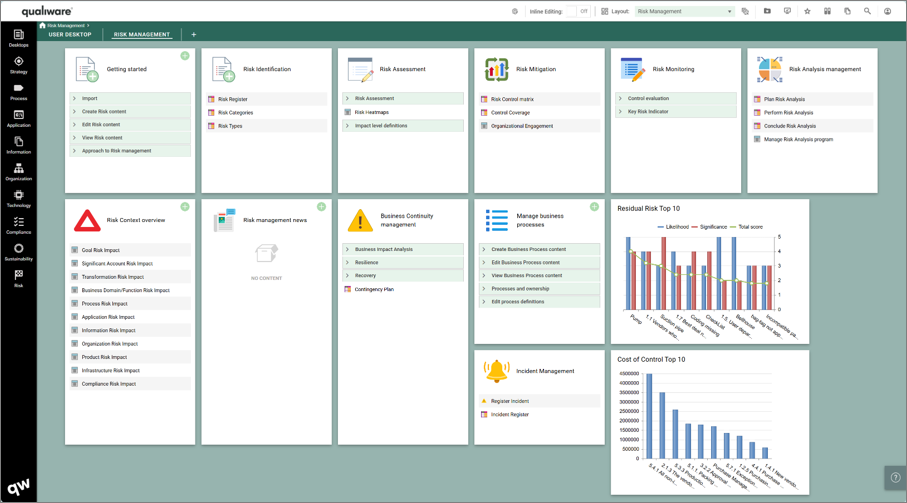
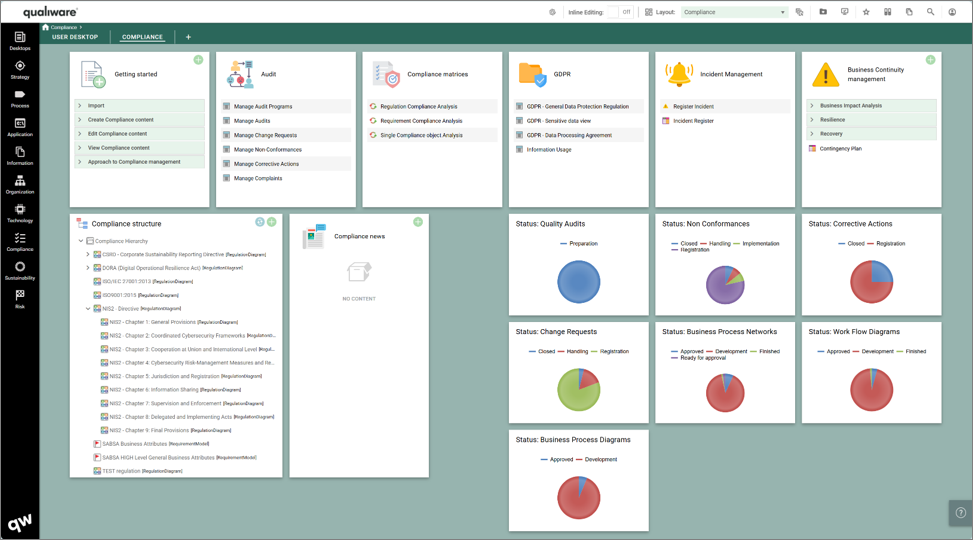
- Governance, Risk and Compliance
- Comprehensive risk and compliance Desktops as well as a set of Desktops each dedicated to a specific regulation (CSRD, DORA, NIS2)

Explore the list of standard desktops here.
NAF support, UAF support, Improvements to ArchiMate XML interface
In version 10.10 QualiWare now supports both NATO Architecture Framework (NAF) and Unified Architecture Framework (UAF).
There is a new dedicated desktop supporting the two framework, see more about the desktop here.

Configurable structure of relevant subset of repository explorer
Ensure that the users get quickly access to the most relevant part of your repository.
The new Desktops include new tiles that contain a Hierarchy / Structure view where it is possible to collect most relevant diagrams and content related to the Desktop.
The hierarchy view is browsable, the user can unfold the hierarchy to explore the structure and navigate directly to a specific diagram.
This feature has been part of QualiWare for some time, and is known from the Diagram-Dashboards for e.g. Processes and Applications (see more here).
What is new, however, is that you easily can add/modify the models that should be part of the structure view. The structure updates automatically, and hierarchy are updated as part of the governance flow when new diagrams are added via the “breakdown to” or “visualized by” relations.

Through these tiles the user can get a relevant subset of the repository explorer showing the diagram types related to the specific use case and Desktop.
These are fully configurable – Diagrams can be removed or added as needed.
Pin to My Desktop
It is possible to pick and choose relevant parts from the different desktops and “pin” them to your user specific desktop, which will work as your default desktop.
In addition to pinning tiles from the different desktop it is also possible to “Pin” specific diagrams, using the icon in the toolbar.

The “Pin to My Desktop” button is available in the toolbar, in the dashboard view for a diagram.

Once the content is pinned to your desktop, you can personalize your desktop by rearranging, re-sizing and hiding tiles.
Smart Importer for importing .csv-files
Introducing QualiWares Smart Importer
- Enrich your repository fast: With the Smart Importer you can enrich your repository fast by importing external data from CVS-files
- Intelligent Mapping the relevant properties in the Metamodel: The Smart Importer uses AI to help users with mapping external data, e.g., in a CSV file to the appropriate metamodel and relevant properties
- Guides you through the steps: Guides you through the steps from resolving conflicts to existing data, and/or select with properties and elements should be created/updated.
The new Smart Importer will guide you through each step—from selecting the file, mapping the data to be imported, to handling conflicts and choosing which objects and data to include or exclude. You can also decide whether new objects should be created and/or existing ones updated.

Read more about the Smart Importer here
Survey
It is now possible to create simple surveys in QualiWare and send them to your repository users to collect data.
This could be a predefined EDGY EnterpriseScan or another type of questionnaire.


Read more about the new survey feature here.
Support for Power BI
It is now possible to embed your Power BI reports to a desktop/dashboard tile and thereby include it in the collaboration platform.


Read more about using Power BI in QualiWare here.
New menu UI
Version 10.10 introduces a new UI to the MegaMenu.

Icons and menu text at the first menu level have been updated and reorganized to minimize the amount of space it occupies on the screen.
As the user navigates through the menu to level two and three the menu changes into a dropdown menu.
Attribute preview in Visualizer, Repository Explorer and in the Webmodeler
To improve the efficiency of QualiWare and improve the user experience it is now possible to preview and edit attributes directly in the property window when using the web-modeler or in a visualization.

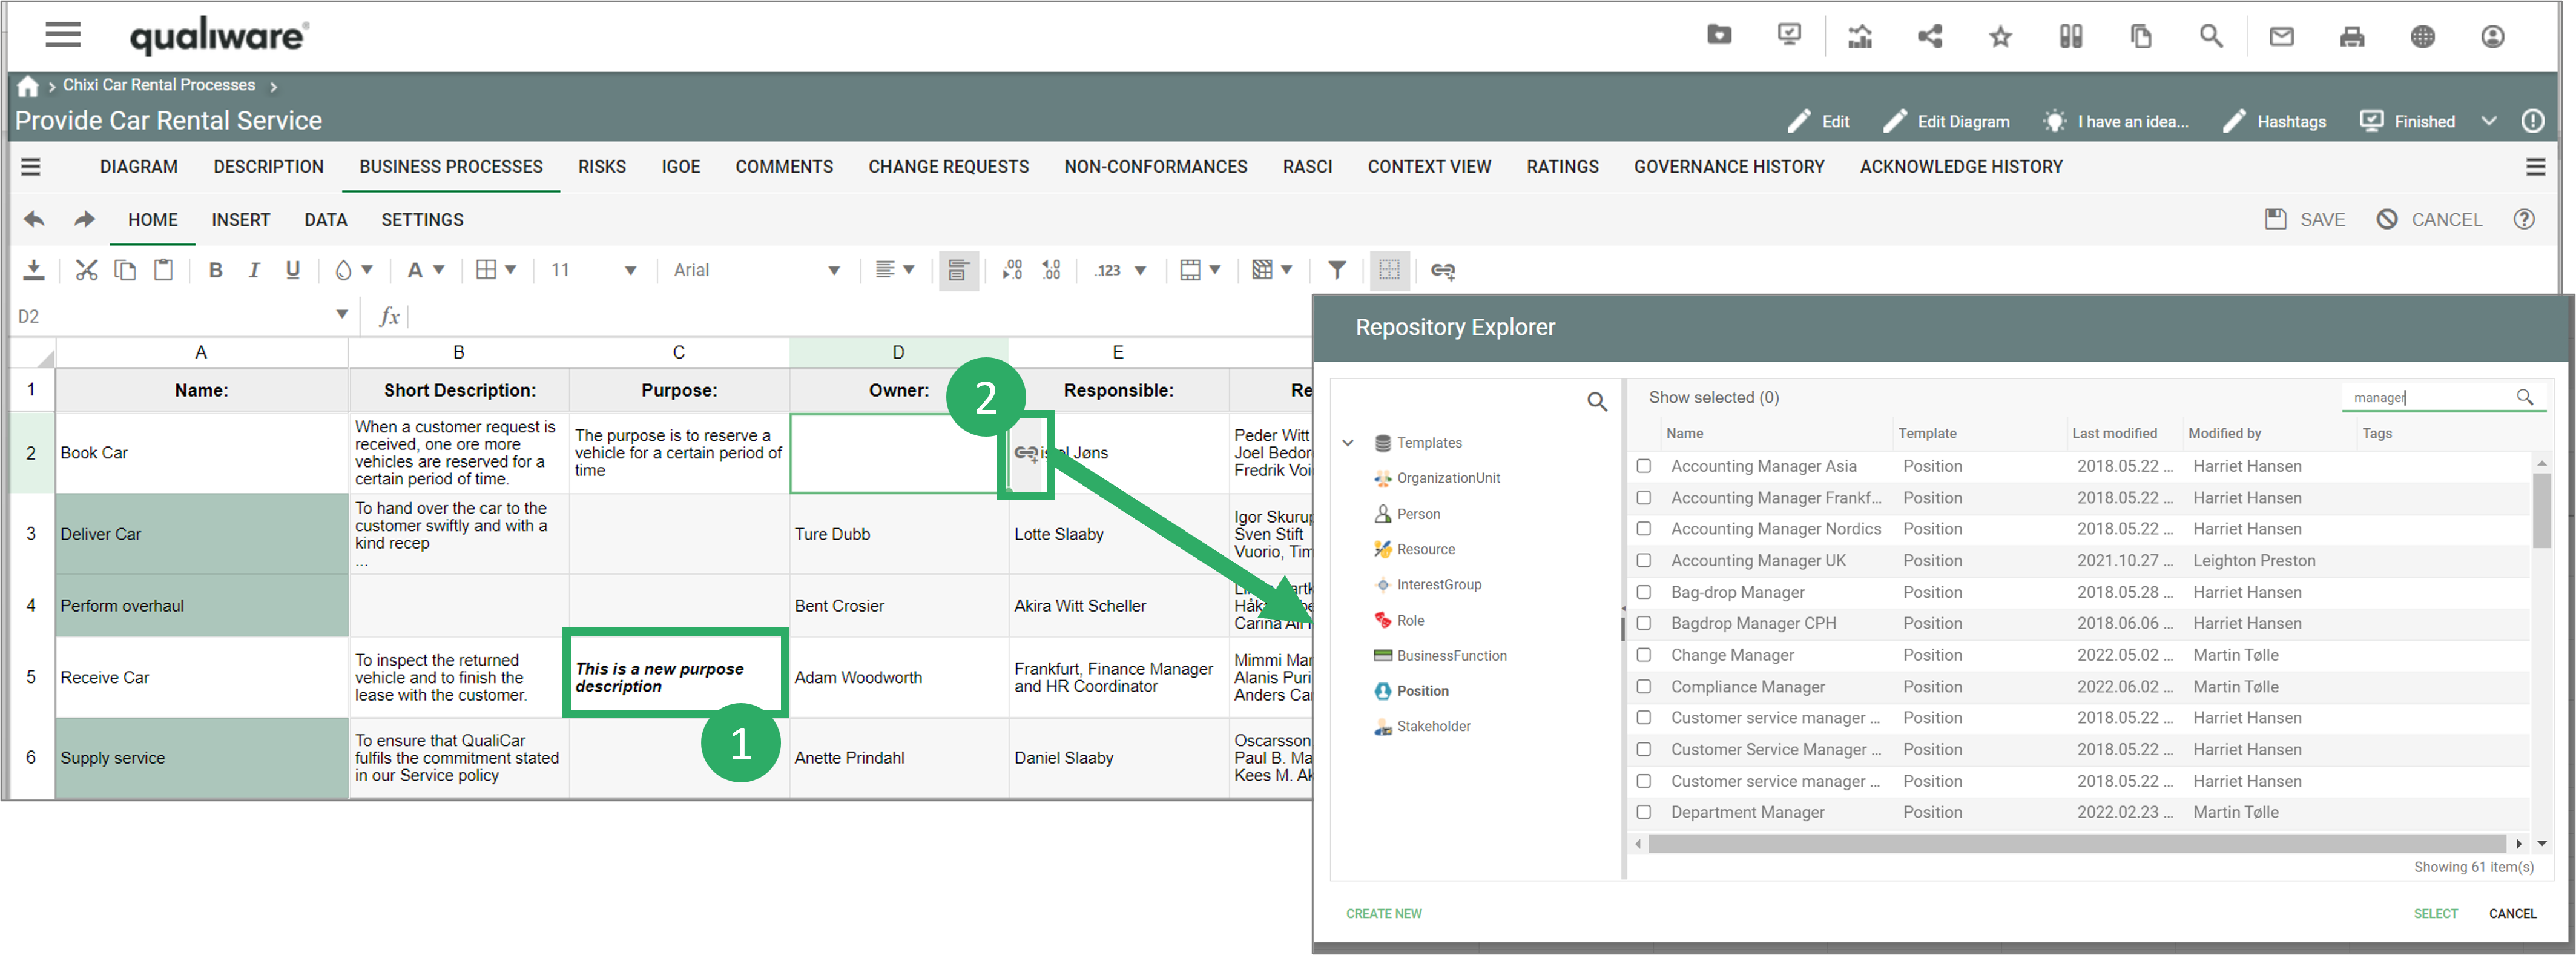
Inline editing of object properties e.g. directly from preview
In 10.10 it is no longer necessarily to open an object to edit its properties.
You can toggle on the “Inline Editing” and then double-click on the specific property in the property tile to directly edit it.

It is possible to inline editing in all attributes preview lists, both in the web frontend, visualizer, repository explorer and in the web-modeler.

Spreadsheet support for propertysheets, translation, revisions and XYZ-link matrices
QualiWare 10.10 introduces a new properysheet template, that enables to get a spreadsheet view of:
- default properties for an object
- a set of properties for an object for multiple:
- Configurations
- Languages
- Revisions
This enables the user to easily explore and modify properties of different variants of the same objects.

Configurations
The configurations show the properties of the object in the available configurations, e.g. Base and Development

Languages
The configurations show the properties of the object in the available language variants.

Revisions
The configurations show the properties of the object in the available revisions.

Smart “Add row” and “Add Column” in spreadsheet
Spreadsheets now have the functionality to add new rows and columns directly in the spreadsheets.
The functionality is very useful in the link Matrix spreadsheets (so-called XY-spreadsheets).
In these spreadsheets you have a list of e.g. capabilities in the first column, and the on the other “axis” you can have a list of related initiatives, processes, information or applications.
As default the link matrixes only show already related objects.
The new feature makes it easy to add new/existing objects to the spreadsheet to facilitate fast bulk editing of relationships.


New visualizations
Gain a deeper understanding of your organization through the new visualizations introduced in 10.10.
Framed

This visualization shows how different objects are related by framing them through their relation, e.g. “DeliverCapability” showing the different elements (process, application, project, etc.) that delivers the capability.


Hierarchy
The hierarchy visualization allows the user to navigate through the hierarchy:
- either by expanding multiple level at a time (by right clicking the object)

- and/or by navigating through the hierarchy and clicking on the branches to expand/hide the next level

Context View 2D

The context view 2D visualization is not new, but now it has been added to the list of Visualization using a HTMLFeature, which enables it to be a part of the Table list in a HTMLDashboardItem.
It is still possible to have as a separate DashboardItem using the “ContextView” Method.


Tree-List support for standard GovernanceWorkflows e.g. Promote, Approve, Revision
Tree-List is now supported for standard GovernanceWorkflows.
This enables the user to select which objects should be included as part of the governance, when e.g. approving a Process Diagram, it is possible to select if any of the processes in the diagram should be approved as well (similarly when creating a new revision of the diagram).
The Tree-List can be configured to include/disable objects with specific properties.

Read more about the Governance Workflows here.
Web-dialogs become non-model, movable and minimizable. Multi object editing in web-dialogs
Work with several different web dialogs at the same time across the whole web-platform, both in the Web-modeler and on the web.

In version 10.10 it is possible to have several web-dialogs open at the same time. They are fully movable and can be minimized to help navigate while editing.

New UI in Web-modeler
In QualiWare 10.10 the User Interface has been updated in Web-Modeler, and additional features have been included.
- The left side menu has been updated
- The Symbol bar has been moved to the left side
- The property window has been expanded and it is now possible to do inline editing in the properties directly (see more here)
- Governance actions has been included in the web-modeler (see more here)
- It is possible to filter properties to see only favorite/value-only or all properties (see more here)

Read more about the Web-Modeler here.
QWM: New Diagram Types
In QualiWare 10.10 the following diagrams have been enabled for the web-modeler:
See the full list of Web-Modeler enabled diagrams here.
Favorite/full/Value-only support in properties
In the new property view in the Web-Modeler, it is possible to toggle between full view or favorite property view, and in full view it is possible to hide empty properties, only focusing on the properties that are described/instantiated.
The list of Favorite properties is determined by the properties defined by the Properties in the Properties tile in the associated diagram. This way, you get easy access to the favorite fields that are used in the organization. The Properties are configured in the HTMLContentTable associated with the template, as defined in the context dependent tile.

Governance support in Web-modeler
It is now possible to perform governance actions directly in the web-modeler.
This enables you to e.g. create new revisions of frozen objects and update them without exiting the web-modeler.

Read more about governance workflows here.
Read more about the Web-Modeler here.
Right-click to set options on symbols and connections in Web-Modeler
In the web-modeler it is possible to right click a connection or a symbol in the Web-Modeler and select between options.
More options have been added so it is easier to set the options simple by right-clicking instead of editing the symbol or connection to set the properties in the web-dialog.
Read more about the Web-Modeler here.

“Context”-event introduced in BPMN diagram
A new Context event type has been added to the standard events (Start, Intermediate and End), in the BPMN diagram (BusinessProcessDiagram).

When used the new Context Event changes color to reflect the standard events (Start, Intermediate and End) based upon the connections linked to the event.
If connections are linked from the event if changes color to Blue as a Start event.
If connections are linked to and from the event if changes color to Yellow as an Intermediate event.
If connections are linked to the event if changes color to Red as an End event.

Support for accordions and sub-symbol-selection in web-modeler
It is now possible to set up accordions in the web-modeler to make it possible to select specific sub-symbols from the symbols menu.
This way you can use the drag and drop / click on the symbol to add the sub-symbol to the canvas.

Improved performance for Save-Load in Web-Modeler
The performance has been improved when loading and saving diagrams in the web-modeler.
Support for AI Chatbot
A new AI Chatbot has been embedded directly in QualiWare. This allows users to ask questions, analyze content, and explore repository data in a natural, conversational way.
Read more about the QualiChat here.
Support for Response ontologies and AI-based generation of objects with non-graphical relations. New predefined KnowledgeScopes
The QualiAI has been updated and is now not only available in the web-modeler helping you to create new diagram, now it is possible to use it from the web front-end to enrich content and add generate non-graphical relations and objects to selected content.
When the object(s) is selected you can add the QualiAI and prompt what you would like to get help with, and its suggestions will appear in a spreadsheet for your review and approval.
Note it is possible to multi-select by holder <ctrl> and clicking on the relevant objects.

Read more about the QualiAI here.
AI supported PowerPoint presentation generator
The new generate PowerPoint feature is a great asset in the QualiWare reporting toolset.
It allows the users to quickly create and compile different diagrams into a PowerPoint presentation.
The PowerPoint feature uses QualiWares AI to showcase relevant diagram information in the report.

Read more about the PowerPoint generator here.
Support for AI usage analysis (EU directive)
Every object that has had AI generate any kind of information will have this tagged.
This allows for easier documentation when audited on what part of an organization that is AI generated.
The QualiAI will automatically update the properties when used to create or modify the object.
The properties can be found on the “Governance” tab on the object.


QualiWare GO – Augmented Reality app provides easy access to content
QualiWare Go is the new mobile app from QualiWare, designed to keep you connected to your organization’s management system, wherever you are. Scan QR codes, view procedures, check data, or log actions directly from your phone or tablet, right where the work happens.
Read more about the QualiWare Go App here.
New compare features, compare with .qrx-files and custom object-list, compare with other object revisions, export of objects
The compare feature has been expanded to include .qrx-files and custom object-list.
It is now possible to load QualiWare import-file (.qrx-file) into the repository compare, to explore and compare an import file with the current repository, as import/copy (a subset) from the import file.

Once the import file is loaded it is possible to explore/compare the content with the current repository, and use the standard functionality to copy content from the import file to the current repository

To use this feature, you need to set up a Data Storage Pool in the Repository Administrator module (RA).
Read more about the repository compare here.
Language support
In QualiWare 10.10 we have improved the way to translate the web front end in the different working languages in the repository.
All labels and text can be translated and managed easily using the spreadsheet feature function.
The spreadsheet lists all the labels and their translations.
All the labels can be automatically translated using Microsoft Translator and can be easily updated afterwards.
Once the labels have been translated (or imported) the labels are translated on the web frontend.

Read more about Front End Translation here.
Read more about language support here.
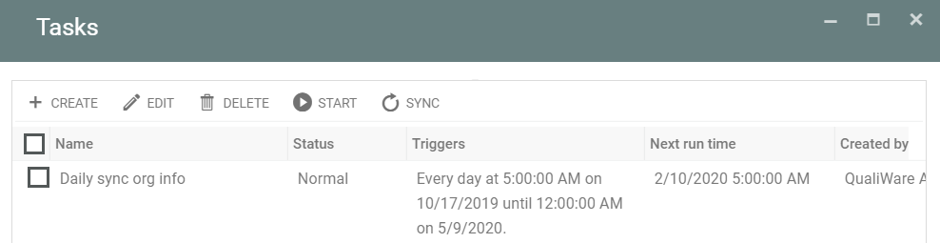
Watch Dog for QCL-engine
The QCL-engine is a central backend feature that tracks all changes in the repository, and triggers related updates of diagrams, data and governance actions.
The QCL-engine in managed in the administrator module, and now a watch dog is set up to monitor to status, and if needed it automatically restarts the engine to ensure that the web-portal always is kept updated.
QIS: Template and Attribute mapping
The possibility of renaming template and attributes have been added to the service operations in the repository administrator (RA) module.
This can be relevant if the metamodel has changed and you need to update content from repositories using a different metamodel than the current repository metamodel.
It is possible to rename template name, and attributes on a template type.