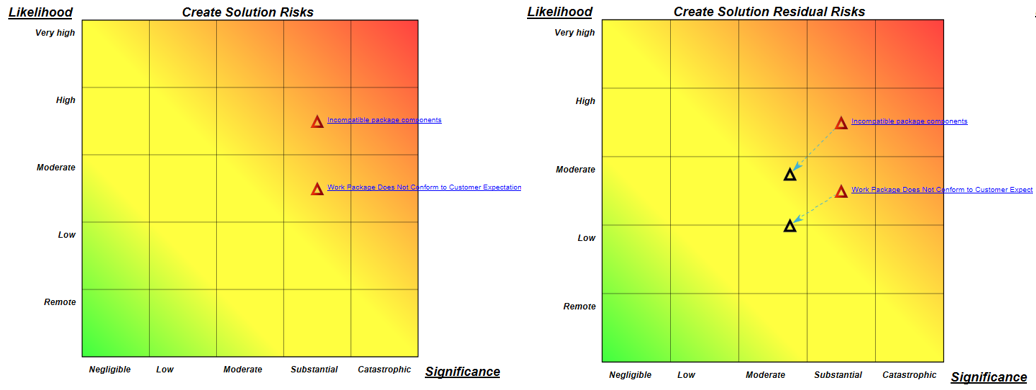
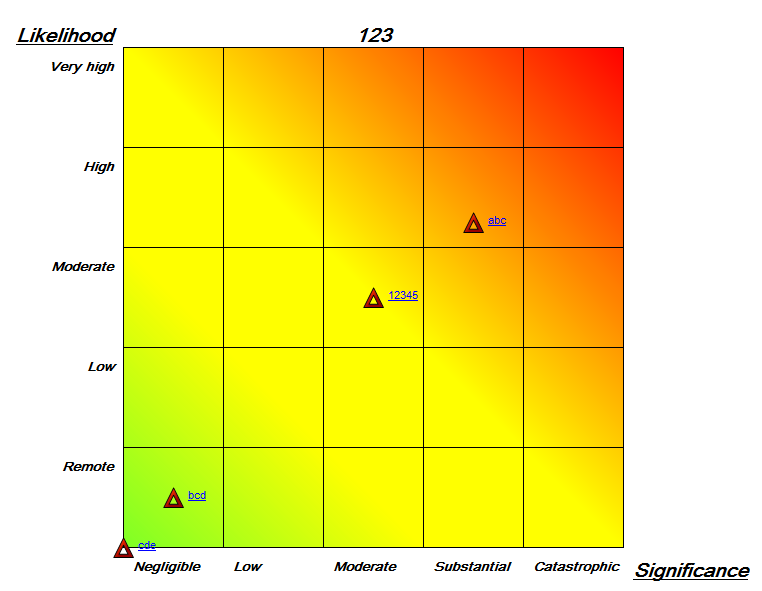
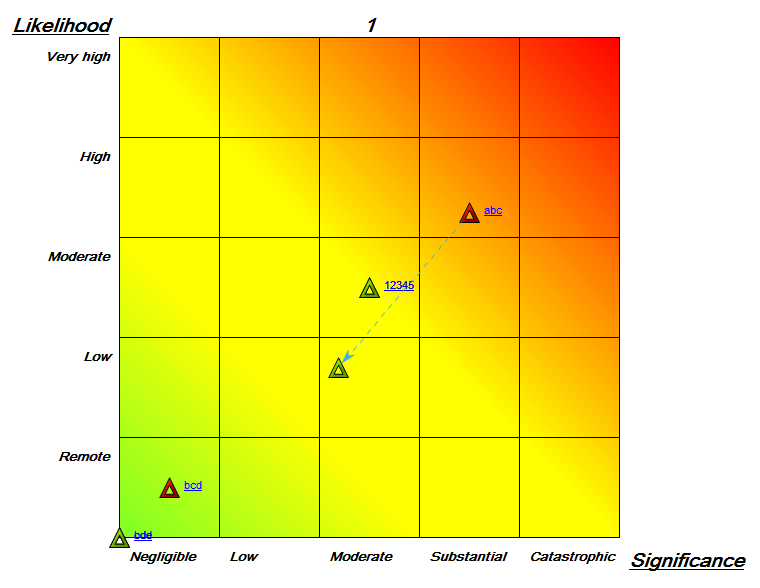
Risk Heat Maps can be used to graphically show how Risks are ranked from both an Likelihood and Significance point of view.
Example of Risk heat maps with and without residual risks:
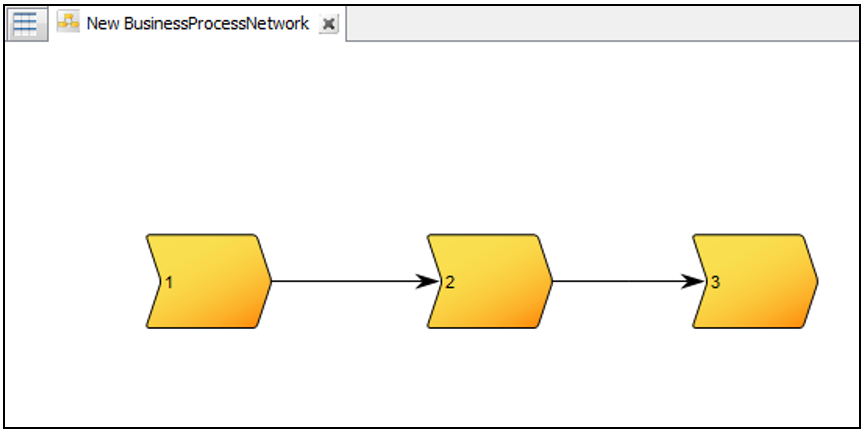
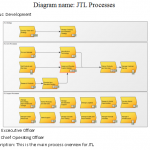
A Heat Map can be created for one or more objects within a diagram – for example a Workflow Diagram or a Business Process Network.
Example of a Business Process Network:
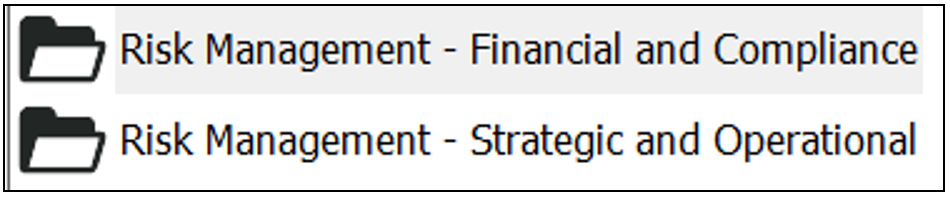
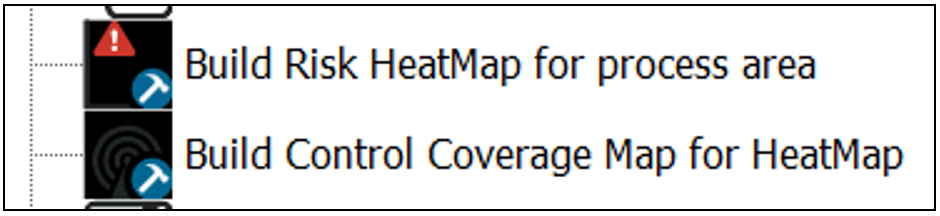
You can select one of the objects or all of the objects on the model. By then using the Actions tab you can select one of two Risk Management related toolbars:
Action menus from the Actions tab can be found on the right-hand side of a Diagram in QLM.
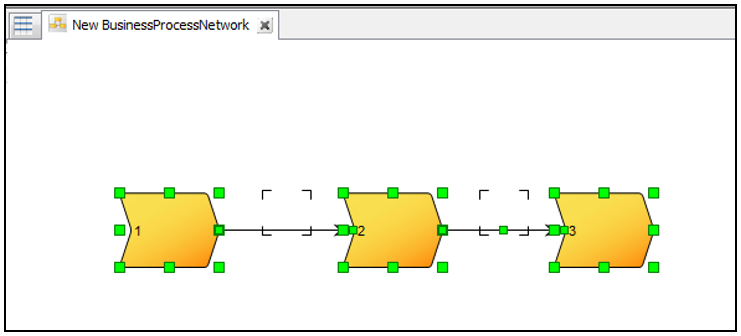
If you are dealing with Financial and Compliance related (e.g., SOX), the first choice would be what you would use. Alternatively, if you are dealing with Strategic and Operational Risk Management, then the second selection is appropriate, albeit the Risk Heat Map button is on both of the toolbars and will work regarding of your Risk Management focus. Below, you can see an example of a Business Process Network where all objects are selected:
Select one or more objects on the model. Select the “Create Risk Heat Map for process area button”:
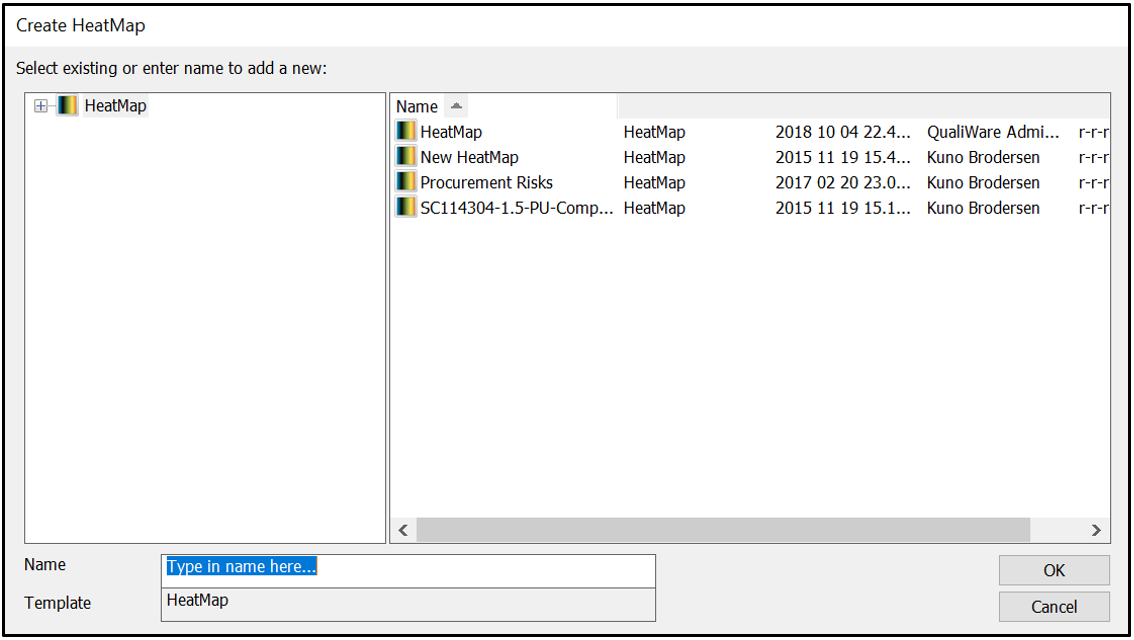
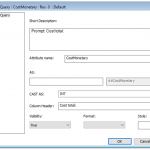
The user is then presented with the option to create and name a new Risk Heat Map, or to reuse an existing Heat Map:
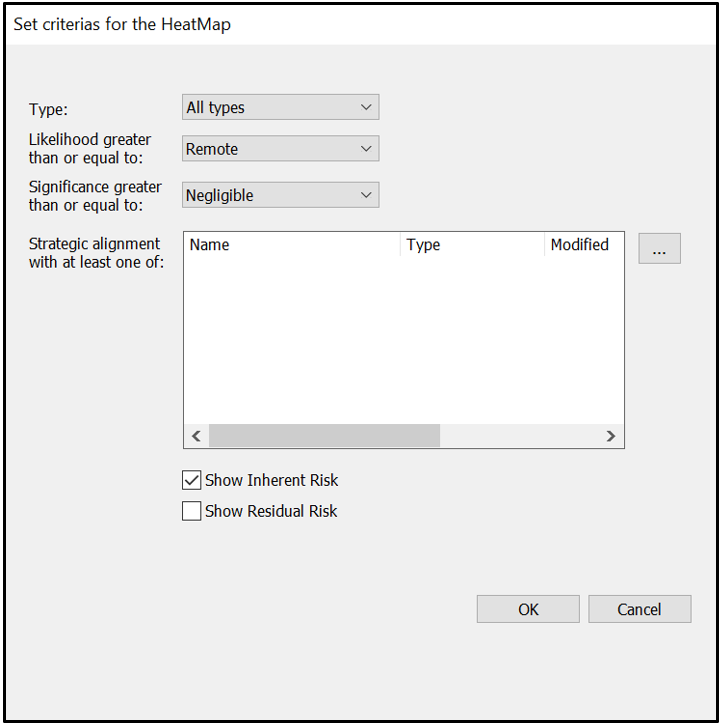
Next, the “set criteria” dialog for creating the Heat Map in QLM will appear:
The dialog permits the user to define what is shown on the Heat Map, including Inherent as well as Residual Risk. The resulting Heat Map will appear after the user selects OK:
When creating an Activity in an operational process model that is labeled as a Control or Key Control, the user also has the option to link to a ControlCoverage on the Coverage tab of the Activity. The ControlCoverage template permits the user to describe what level of coverage the Activity provides to mitigate the Risk, assuming that there may only be partial coverage, thereby leaving “Residual Risk”. On the ControlCoverage template the user is able to specify the coverage level. And, when a Heat Map is generated also displaying the Residual Risk, the user can see the Likelihood and Significance of the Risk at its Inherent and Residual levels:
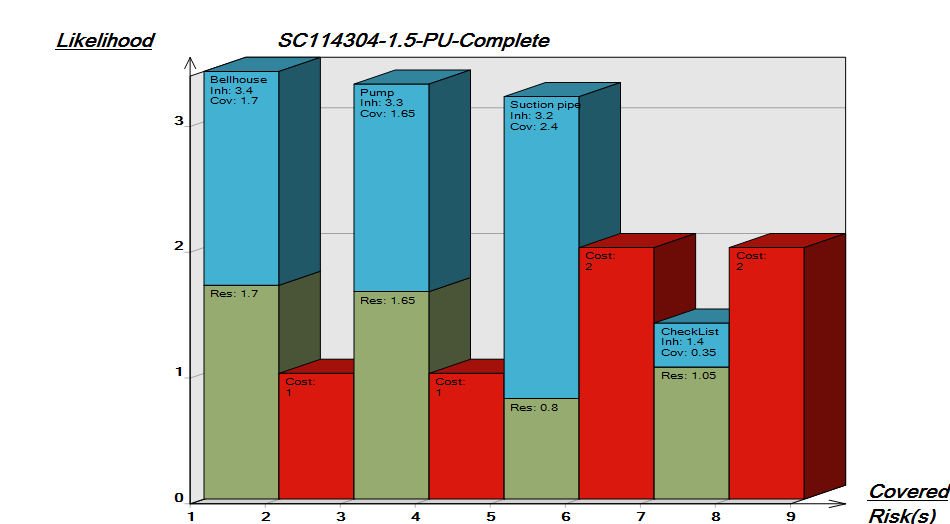
Creating Control Coverage Maps
With the ControlCoverage template the user is also able to define the Cost Level; see the CostLevel tab on the ControlCoverage template. With the CoverageLevel and CostLevel completed for the ControlCoverage object and having this object linked to Risk(s), the user is also able to create what is referred to as a Control Coverage Map. With the Heat Map open and displayed on the QLM user interface, using the button on the Risk related toolbar a Control Coverage Map is created:
On this map each Risk is displayed with its Inherent (Blue) and Residual (Green) risk levels and the Cost (Red) is also displayed:
Other buttons on the Risk Management related toolbars include unique template views via the Repository Explorer, Matrices, Reports, etc. and each of the toolbar buttons can be explored but will not be addressed in this user documentation.
This guide covers the steps necessary to design a simple report.
Reports are designed via the template ReportDefinition.
Reports are always generated dynamically based on the content where they are executed. For example, if you click on the report button on a diagram, it will use the objects and their information contained on the diagram. To make this possible it is necessary to define what variables the ReportDefinition should gather and where it should place them in the report.
Designing a report consists of four stages: Designing the queries, arranging the attributes in the main report, designing sub-reports and finally applying advanced formatting.
In the design phase it is necessary to structure the data for the report. This is done via SQL. To remove the need of learning SQL QualiWare has introduced a Query Designer that helps users build SQL scripts and tables automatically based on a graphical diagram.
The queries are then used as input for the ReportDefinition where the individual attributes can be re-arranged graphically.
When designing a Query that needs to read the attributes of objects that are referenced in a multi-link field it is necessary to create sub-queries and sub-reports. Sub-reports gather and organize the attributes for the underlying objects and then are themselves inserted into the main report, just like the other attributes.
When the data has been defined, organized and arranged in the report it is necessary to apply advanced formatting to the report for aesthetic reasons.
This guide will describe the steps necessary to create a report that displays information about a BusinessProcessNetwork and the individual business processes contained in the diagram. The knowledge attained from this guide can then be used to build similar reports for other diagram types and objects, as the principles remain the same.
1 – Query Designer
1.1 – Designing the Query
This step details how to design the main query containing information about the BusinessProcessNetwork diagram.
Create a new QueryDesign name it “BusinessProcessNetwork Query”, and double-click it to open it
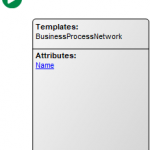
In the series of menus select From Repository, Diagram and BusinessProcessNetwork. This generated a diagram that contains a green Play button and a single Object Query for the template BusinessProcessNetwork with the attribute Name
QueryDesign ObjectQuery.
All of the attributes that are intrinsically a part of the object should be listed in the ObjectQuery’s attributes.
Attributes that should not be listed are links to other objects, which means connections like Contains, OwnedBy, HasResponsible, Employs etc. Out of those if any links are of the multi-link type, they need a sub-report which will be covered later.
Open the property dialog for ObjectQuery and navigate to the tab “Property”
For the field Object properties, right-click and click Insert…
Select the following properties: HTMLDrawing, AuditGS, OwnedBy, HasResponsible and Description
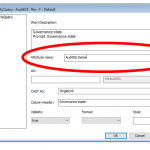
Because AuditGS points to a Governance State object, it is a link connection. This means that the field AuditGS points to the object which corresponds to the Governance State of the object at the given point in time. This is presented as a URL link There is a provision to remedy this by adding a .Name at the attribute. Instead of inserting the link it will insert the name of the object (in this case the governance state), which is what we are interested in.
In the property dialog for ObjectQuery “BusinessProcessNetwork”, on the tab Property, for the field Object properties, double-click on ObjectPropertyQuery “AuditGS” to open its property dialog
In the property dialog for ObjectPropertyQuery “AuditGS” for the field Attribute name type in AuditGS.Name
Do the same for OwnedBy and HasResponsible because these fields also point to an object
ObjectPropertyQuery for AuditGS.
1.2 – Generate Query
In order to generate the Query itself the green Play button needs to be double-clicked.
On the QueryDesign diagram “BusinessProcessNetwork Query” double-click on the green Play button to open the property dialog for GenericQuery “BusinessProcessNetwork Query”
In the property dialog for GenericQuery “BusinessProcessNetwork Query” navigate to the tab Query Filter and for the top field insert the string: T01.sys_ObjectId = '<qlmScript id="ObjID">'
Navigate back to the click the button Rebuild to build and open the GenericQuery table “BusinessProcessNetwork Query”
2 – Report Definition
Now that the query has been designed and generated it is possible to connect it to the ReportDefinition and design the main report.
2.1 – Connect ReportDefinition to GenericQuery
In the RepositoryExplorer, Right-click on ReportDefinition (it is an object template, not a diagram template), click New… and name the new ReportDefinition “BusinessProcessNetwork Report”
Double-click on ReportDefinition “BusinessProcessNetwork Report” to open its property dialog
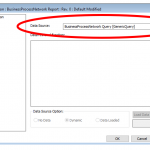
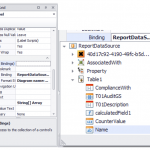
In the property dialog for ReportDefinition “BusinessProcessNetwork Report” navigate to the tab Data Source and for the field Data Source insert GenericQuery “BusinessProcessNetwork Query”, and click Apply
Connecting the GenericQuery to the ReportDefinition.
2.2 – Design the report with Report Wizard
In the property dialog for ReportDefinition “BusinessProcessNetwork Report”, Navigate to the tab ReportDefinition and click Wizard to open the Report Wizard window
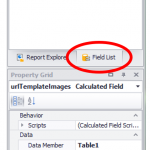
In the Report Wizard Window, on the right, click Field List and expand Table1
Where to locate Table1 in the Report Wizard.
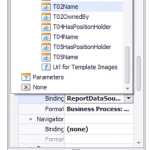
Drag the following fields into the Detail ribbon of the report: Name, T01AuditGS (the governance state), T01Description (the description of the diagram), T01sys_ObjedctId (an image of the BusinessProcessNetwork), T01OwnedBy (the owner of the diagram) and T01HasResponsible (the responsible for the diagram).
Click on each of the text-based fields and then click on the [>] button to open additional settings for the field
In the extra settings, for the field Format String, click on the three dots
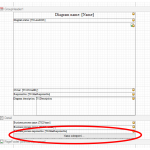
On the category tab General for the field Prefix type in an appropriate text, for example “Diagram name: “ for the Name attribute
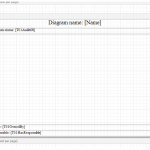
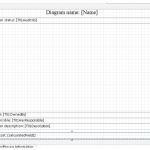
Rearrange the fields and enter a prefix for all the attributes as in the picture
The fields have been inserted, rearranged and got a prefix.
2.3 – Add a Table
Some attributes will require additional formatting tools, such as the description, which does not have a Formatting String option. In these cases a table can be used to add a prefix.
In the toolbar on the left click table and place a table inside the Detail ribbon
Delete columns in the table until there are two and change the size of the table to the full width
In the cell on the left type in “Diagram description: ”
For the cell on the right drag in the attribute T01Description
2.4 – Add a Page Break
It is a good idea to keep reports structured with page breaks.
In the toolbar on the left click on the Page Break icon
Click at the bottom of the Detail ribbon to add a page break
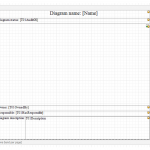
The Page Break can be seen as the dotted line just above the PageFooter ribbon.
2.5 – Preview Report
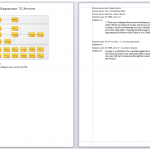
With the report designed it is now time to try out the report via the View button. The example will contain all BusinessProcessNetworks, whereas in a real use scenario it will be limited to a single BusinessProcessNetwork.
Save the report design with CTRL+S and then close the report designer
In the property dialog of ReportDefinition “BusinessProcessNetwork Report” click the View button to open an example of the report
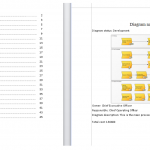
A test report can be previewed.
3 – Sub-Report
In order to get information about the BusinessProcesses contained on the BusinessProcessNetwork as well as the Regulations that the BusinessProcess points to it is necessary to create a sub-report which has its own query.
3.1 – Design a Sub Query
Single-link connections do not need a sub-report. Multi-link connections like Employs, AssociatedDocument and ComplianceWith need a sub-report.
Open QueryDesign “BusinessProcessNetwork Query”
Double-click on ObjectQuery “BusinessProcessNetwork” and click Expand from metamodel
Click Graphical
Click Full and click OK
This automatically adds a new ObjectQuery connected to the ObjectQuery “BusinessProcessNetwork” via a Contains RelationQuery.
Open the property dialog for the new ObjectQuery
In the property dialog for the new ObjectQuery for the field Template Filter remove everything except BusinessProcess
3.2 – Adding Properties
In the PropertyDialog for ObjectQuery “BusinessProcess”
Navigate to the tab Property and add the ObjectPropertyQuery OwnedBy and HasResponsible
Edit the ObjectPropertyQueries OwnedBy and HasResponsible by adding .Name to them, just like before
3.3 – Adding Relations
Double-click on ObjectQuery “BusinessProcess” and click Expand from metamodel
Click Relations
From the list select ComplianceWith and click OK
Open the property dialog for ObjectQuery “Regulation” and navigate to the tab Property
Insert ParagraphText and click OK to save your changes
3.4 – Adding a Concerns for the SubQuery
For the purposes of testing the report later, an object must be added to the concerns field of the subquery before the query is built properly.
On the diagram QueryDesign “BusinessProcessNetwork Report” open the property dialog for the RelationQuery ComplianceWith
In the property dialog, Open the GenericQuery in the field Subquery
Open the property dialog for the GenericQuery and navigate to the tab Advanced Query
Insert any BusinessProcess into the field Concerns
Click on the button Rebuild
3.5 – Generating the SubReport Query
On the diagram QueryDesign “BusinessProcessNetwork Query” double-click on the green Play button to generate the query
In the property dialog for GenericQuery “BusinessProcessNetwork Query” click Rebuild
In the Repository Explorer create a new ReportDefinition and name it “subBusnessProcessNetwork – BusinessProcess Regulation”
Double-click on the new ReportDefinition to open its property dialog and navigate to the Data Source tab
For the field Data Source insert the GenericQuery “BusinessProcessNetwork Query SubQuery_T03”
3.6 – Design the SubReport
Ensure that the property dialog for ReportDefinition “subBusnessProcessNetwork – BusinessProcess Regulation”
Navigate to the tab ReportDefinition and click Wizard
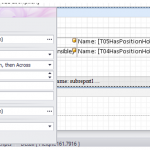
The SubReport must now be designed. Design it to fit the picture below:
The Regulation properties have been placed and arranged in the Report Wizard for the Sub Report.
Save and close the report designer
3.7 – Insert Sub Report into Main Report
Open the property dialog for ReportDefinition “BusinessProcessNetwork Report”
Navigate to the tab Associate->Other and insert ReportDefinition “subBusnessProcessNetwork – BusinessProcess Regulation” into the Associated with field
Navigate to the tab ReportDefinition and click Wizard to open the report designer
In the lower left corner of the screen click Add a Group and click Name
Move all the previously arranged objects to the GroupHeader1 ribbon
Insert T02Name, T02OwnedBy and T02HasResponsible into the Detail ribbon
On the right in the Field List unfold the AssociatedWith group and insert “subBusnessProcessNetwork – BusinessProcess Regulation” into the report
The sub report is inserted into the main report the same way as an attribute.The contents, as designed in the sub report, can be seen in the main report.
3.8 – Add the ReportDefinition to a Template
Open the Publisher with CTRL+H
Navigate to the tab Template Definitions
Open the property dialog for TemplateDefinition “BusinessProcessNetwork”
In the property dialog for TemplateDefinition “BusinessProcessNetwork” for the field “Report definitions” inser the ReportDefinition “BusinessProcessNetwork Report” and click OK to save your changes
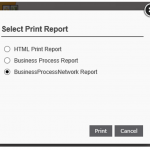
The ReportDefinition will now be available when the Print button is clicked
The new Report Definition can be seen on the web when the Print button is clicked.
4 – Advanced Formatting
Advanced formatting techniques can be used to improve the readability and usability of the report.
4.1 – Calculated Fields
Calculated fields can be used to sum up a series of objects. In this example the costs of all BusinessProcesses will be summed together to find out the total cost of the workflow.
In the QueryDesign for the ObjectQuery “BusinessProcess” add Object Property CostMonetary. Make sure that it is cast as an INT and not as a VARCHAR, so it can be calculated.
For calculated fields it is important that the Property is cast as an INTeger.
Double-click the green Play button and Rebuild the Query
Go to the ReportDefinition Wizard
In the Field List for Table1, right-click and click “Add calculated field”
Right-click on calculatedField1 and for the Expression field type in Sum([T02CostMonetary])
Add a text label and type in Total cost: [calculatedField1]
The calculated field has been inserted in the ReportDefinition via the Report Wizard.
4.2 – Table of Contents
A table of contents that lists all the important chapters in the report can greatly improve the usability of the report for the reader.
4.2.1 – Add a bookmart to all relevant elements
Select Diagram name: [Name] and in the Property Grid, scroll down to Data->Data bindings->Bookmark->Binding
Set the binding to Name
Set the Format String to Diagram name: {0}
A data binding has been set for the BusinessProcessNetwork Name.
Select Business Process Name: [T02Name] and in the Property Grid, scroll down to Data->Data bindings->Bookmark->Binding
Set the binding to T02Name
Set the Format String to Business Process: {0}
The Data Binding has been set for the BusinessProcess Name.
4.2.2 – Insert Report Header Band and Add Table of Contents
Right-click on an empty space inside a band and click Insert Band->Report Header
In the toolbar on the left, click on Table of Contents and click inside the Report Header Band
Rename the title of the Table of contents to “Table of Contents”
A preview of the table of contents.
4.3 – Insert Company Logo
A logo can be inserted into the report – ideally in the PageHeader ribbon.
The logo can be found in the Field List under Property->LogoUrl.
Drag the LogoUrl into the report PageHeader in order for it to appear at the top of every page in the report.
To find the logo, navigate to the folder: [QLM Installtion Folder]\Models\qishtml\QEP\Images
To change the logo replace the file _logo.png with a different image.
4.4 – Keep Together
If you have a group of information that cannot be contained in one page, the content will continue on the next page. This can be confusing in a report. Use the “Keep together” feature to force the report to keep all related content in the Details band together on one page.
Select the Details band, click on the > button and set a checkmark in “Keep together”.
Elements in a band can be kept on the same page via the Keep Together functionality.
4.5 – Adding Page Numbering
Numbering all the pages in the report can ease navigation for the printed report.
Page numbers can be inserted via the page info button in the toolbar on the left.
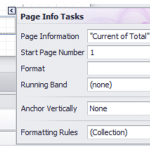
The page info can be further configured via the > option.
Page numbering can be inserted and configured via Page Info.
Go pro: Do a full course that guides you through workflows in both the QualiWare Lifecycke Manager and web interface.
Our digital course consists of 15 lessons with several exercises built around scenarios. You will explore several scenarios covering the journey of modeling GRC domains in the QualiWare Lifecycle Manager and on the Web.
QualiWare’s web portal allows you to register and share innovative ideas that could help improve your organization: Share ideas that are not specifically linked to a problem, change request or non-compliance. Ideas are handled like tickets and go through a short life circle:
Problems are used in the case an occurrence inside the organization cannot yet be classified as being, for instance, a change request or a non-conformance. For those events, QualiWare offers a general ticket called a problem. The unique feature of this function is the possibility to convert a problem into any other type of ticket at a later stage.
A problem goes through the following governance stages:
Registration
Investigation (Possibility to change to e.g. Change Request or Non-conformance etc. here)
A change-request is a proposal for an alteration to documented operations, procedures, and activities. In other words, ideas that may be used to improve operations, procedures, and activities to make them more effective and easy to execute. In QualiWare, change requests functions like tickets and go through a life cycle of different governance states:
Registration (of suggested changes)
Handling (evaluation of suggested changes)
Implementation or Close
Implementation (change a process and make the organization react)
Non-conformances: Report when you experience a process that is not being followed in the everyday execution (the way it’s been described). A non-conformance documents the details of a non-conformance as identified by either a quality auditor or by employees who continuously operate specific processes. The objective of reporting a non-conformance is to make an unambiguous, defensible, clear and concise definition of the problem.
In QualiWare, non-conformances function like tickets and go through a life cycle of different governance states:
Registration (of occurrences or deliberate chosen alternative processes)
Handling (evaluation, if a non-conformance is accepted the ticket is closed. Othervise:
Implementation (edit or create new documentation)
Verification (verify with organization: feedback and acceptance from accountable)
Approved and closed (new valid documentation).
Document a non-conformance
Document a non-conformance for a process
Document a non-conformance identified in an audit
Edit a non-conformance
Send non-conformance to "handling"
Send non-conformance to "implementation"
Document a corrective action triggered by a non-conformance
Edit non-conformance, send to "verification" and "closed"
A corrective action remedies a non-conformance: Corrective actions are improvements to the organization’s processes taken to eliminate causes of non-conformances or other undesirable situations. By reporting a corrective action workable solutions are documented.
Document a corrective action
Document a corrective action triggered by a non-conformance
Document a corrective action triggered by an accident
QualiWare offers a structured way to register and handle customer complaints. This function does not only help you handle actual complaints, it also provides valuable insights and statistics as to where customer complaints are triggered in your organization: Get an overview by attaching complaints directly to the processes involved.
In QualiWare, complaints function like tickets and go through a life cycle of different governance states that involves communication with the customer:
Register complaint (create a log)
Announcement (send a receipt to the customer)
Handling (find possible solution)
Acceptance (get acceptance from the customer to suggested solution)
Finished, subsequently closed.
If necessary, a complaint may be reopened and send to the handling state for a second handling.
Document accidents in the workplace involving damaged goods or injuries to people. Using QualiWare ensures that you handle accidents in a controlled manner.
In QualiWare, accidents works like tickets and go through a life cycle of different governance states:
Register accident (nature and cause of accident)
Investigate (what happened and how could the accident have been prevented)
Handling (find possible solution to avoid future accidents)
Finished, subsequently closed.
Document an accident
Edit a documented accident
Send accident to "investigation"
Send accident to "handling"
Document a corrective action triggered by an accident
Read Acknowledge provides you with documentation in the case you need the certainty of if (and when) employees and colleagues have read a diagram, document or any other specific piece of documentation. This is done by creating ‘read acknowledge’-lists that link together persons with pieces of specific documentation. Send out notifications using QualiWare to designated users prompting them to acknowledge new or revised documentation.
This is automatically saved as receipts for later use and may serve as documentation during audits. Users are identified using Microsoft Active Directory credentials.
Show how your organization complies with legislation and regulations: QualiWare offers an uncomplicated way to verify how users interact with data and documentation. Use QualiWare to ensure that vital information reaches the right people and save your documentation for later audits.
A regulation list view shows the standards specified by the external regulation your organization pursues to adhere, for instance, a diagram of ISO 9001. (Or any other set of quality management standards).
See gaps in compliance
Navigate to ‘Compliance’ in the Mega Menu
Under the ‘Compliance Matrices’ submenu, click on the regulation collection you want to work view
Note, that you get a overview of which processes and audits are related to each regulation
This provides you with documentation in the case you need the certainty of if (and when) employees and colleagues have read and understood a diagram, document or any other specific piece of documentation. This is done by creating ‘read acknowledge’-lists that links together persons with pieces of specific documentation. Send out notifications using QualiWare to designated users prompting them to acknowledge new or revised documentation.
This is automatically saved as receipts for later use and may serve as documentation during audits.
List of who has acknowledged a diagram
Navigate to ‘Process’ in the Top Menu
Click on ‘Process flows’ under the ‘Process’ submenu to open a QRV of all process flows
You can sort the view using the ‘Set Filters’ button and sort by for example name or date
Choose the process flow you want to view by clicking on its name
Navigate to the ‘Acknowledge History’ tab to get an overview of who has read and acknowledged the diagram
The function Social Behavior Warehouse allows you to look at how people interact with your documentation. The function keeps taps on all documentation inside your QualiWare solution and accumulates statistics of how users interact with it. What is seen by users and what is not? What kind of documentation attracts attention within specific business units?
Use the statistics from Social Behavior Warehouse to improve the quality and relevance of your documentation.
Read-statistics for a diagram
Navigate to ‘Process’ in the Top Menu
Click on ‘Process networks’ under the ‘Process’ submenu to open a view of all process networks
You can sort the view using the ‘Set Filters’ button and sort by for example name or date
Choose the process network you want to view by clicking on its name
Click on the analytics button in the upper left corner
Navigate to the ‘User Activity’ tab to view user activity for the diagram
Amongst other things, you can also view organization activity, rating chart and compliance activity
The analytics function in QualiWare gives you an overview of the status of all documentation in your repository. For instance, how many diagrams have not been finished yet? How many are in circulation or awaiting approval? The function also allows you to analyze the present status of e.g. change requests: (Current number of change requests and their current state in life circle).
Navigate to ‘Analytics’ in the Top Menu
Under the ‘Compliance’ submenu, choose your desired statisctical content
A dashboard for your chosen content is now visible
An audit is basically a control of your organization’s everyday operations against documented operations, processes, and activities. QualiWare helps you find the specific documentation you wish to audit and subsequently report what’s not following approved processes and how improvements can be made. After having executed the audit you must conclude and make a final audit report.
An audit program is an overall action plan that contains several individual audits. It documents what internal processes you must follow to validate that your organization is compliant with regulations.
In QualiWare, ‘Plan your audit program’ is used to group audits. Once you created one or more audits inside an audit program you can add processes or other objects from the repository.
Following execution of an audit, report what’s not following approved processes (report a non-conformance) and tell how improvements can be made (report a change request).
After non-conformances and change requests are documented and assigned to responsible, the audit may be verified and closed, finishing the audit.
Closed audits contain vital information that often must be shared with both people outside the organization and colleagues who cannot access QualiWare. That’s why QualiWare allows you to generate a printed report that contains all of the audit’s information in full text.
Register non-conformances and change requests from Audit
Define potential risks and document them in a structured way. Set the likelihood and significance of the risk and thereby to determine the overall risk facing your organization. QualiWare offers an approach that allows you to compare which risks actually pose a risk to your organization.
When a Diagram is in its development phase, you can add risks to it using the tools on the web.
Document a risk from diagram
Navigate to the Private Workspace webpage using the wrench icon in the upper left corner
Navigate to ‘Development’ in the Topbar
Choose ‘Development’ to get a page showing all the objects governed in the development state
You can sort the page using the ‘Set Filters’ button and sort by for example name or date
Choose the diagram you want to add a risk to and open it
Click on ‘create risk’ above the diagram or for a specific activity
Fill out the Property form including name, short description, likelihood and significance
Finish up and close the Property form by clicking ‘OK’
Edit risk
Navigate to ‘Process’ in the Top Menu.
Click on ‘Risks’
Choose the risk you want to edit – you can sort the view using the ‘Set Filters’ button and sort by for example name or date.
Click on ‘Edit’
Edit the information as desired in the Property form- there are several tabs with different types of information available to edit.
Once risks are created in QualiWare you got the documentation and overview needed for prioritizing these risks. Now it’s time to decide which risks to accept and which to react upon. This is done by putting risks in context by visualizing in a heatmap. The heatmap offers an intuitive way of identifying which risks you must handle later on.
Once risks are documented and visualized you can decide which risks most urgently need your attention. To handle risks, you must introduce specific control activities which will reduce the likelihood of that risk being triggered. Control activities are an integrated part of the QualiWare workflow.
Learn how to navigate your individual dashboard in the QualiWare Governance, Risk, and Compliance solution: QualiWare offers an individual, person based dashboard which provides information about your responsibilities, governance tasks, subscriptions, ideas and processes relevant to you specifically. Updated and online.