Purpose: The purpose of a Concept Model is to organize an enterprise’s vocabulary to support cPonsistent and unambiguous communication about specific problem domains across business units.
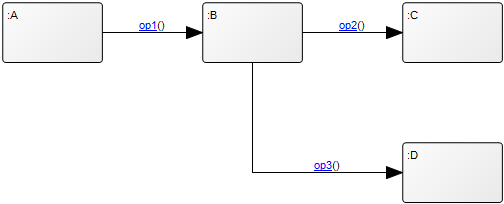
Core concerns: The Concept Model template enables you to model Concepts, Specialization Aspects and Subject Areas. They can be linked by Concept Associations, Concept Aggregations, Concept Generalizations, Type Relationships, and Relationship Constraints.
You are also able to link the diagram to its area of usage through the model’s property dialogue. This area of usage can by default be set to be either an Organization Unit, Role, Actor or External Entity.
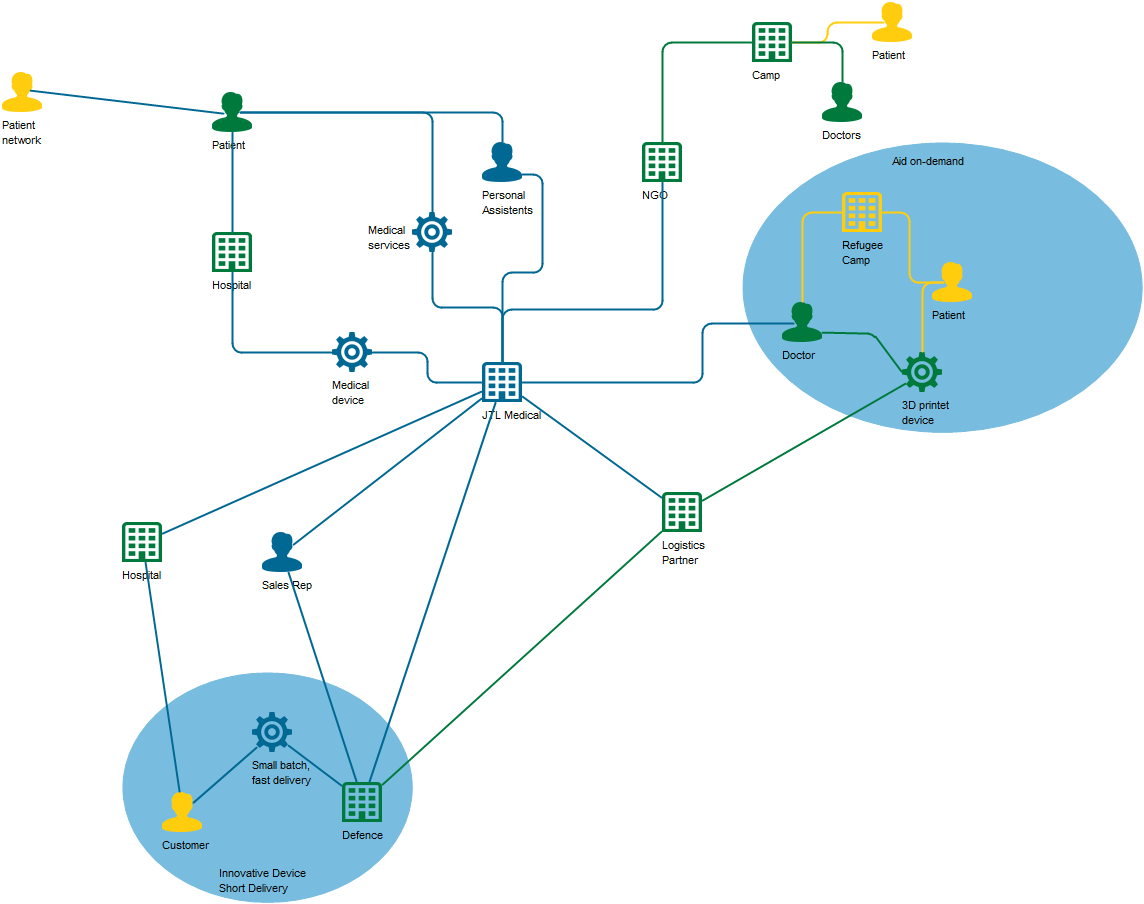
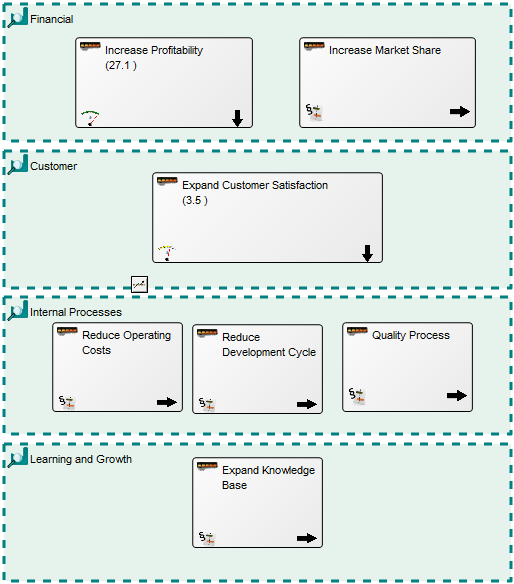
Below you can see some examples of Concept Models from a healthcare domain:
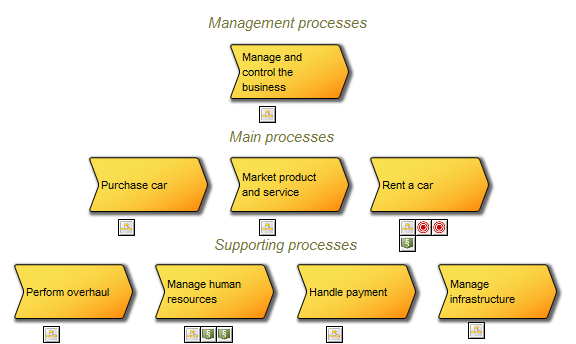
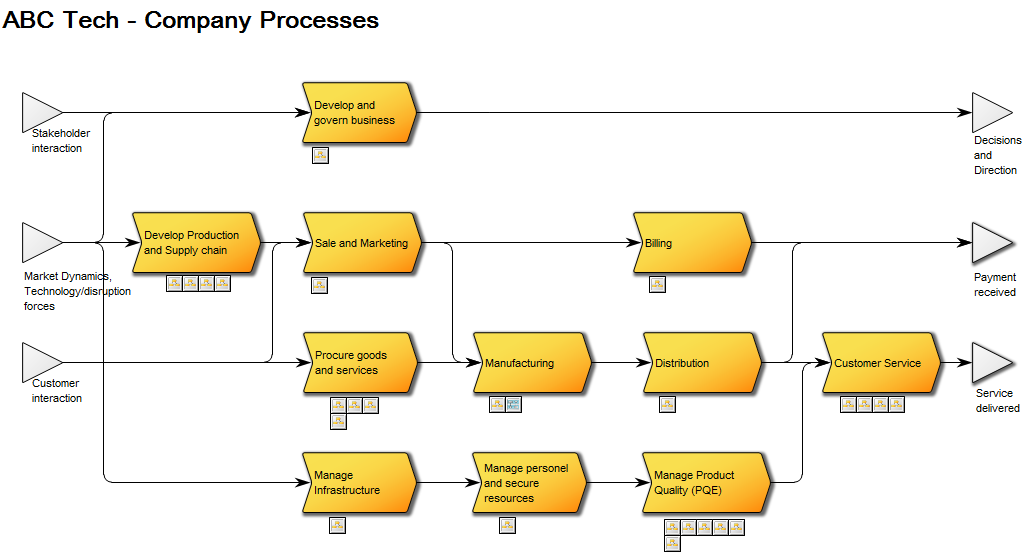
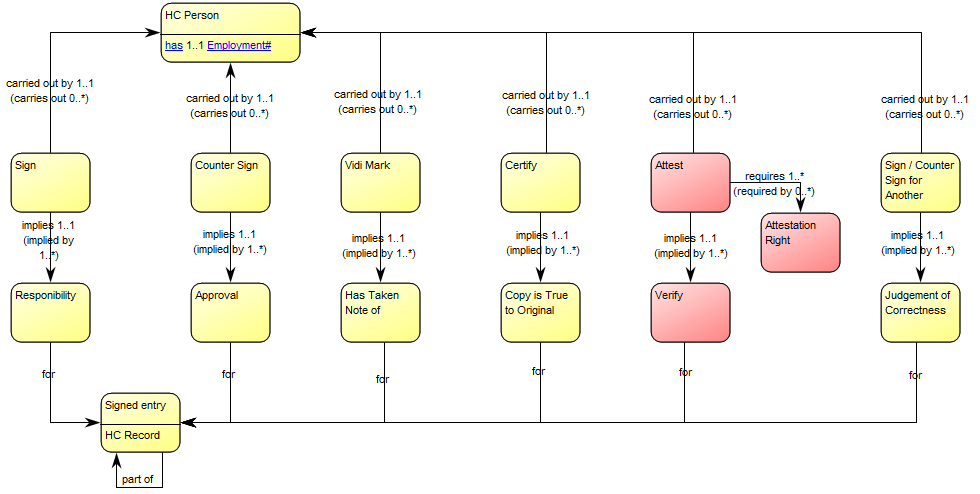
The model above shows the concepts related to the healthcare activity ‘knee arthroplasty’. The model below shows the concepts related to a signature in the healthcare domain:
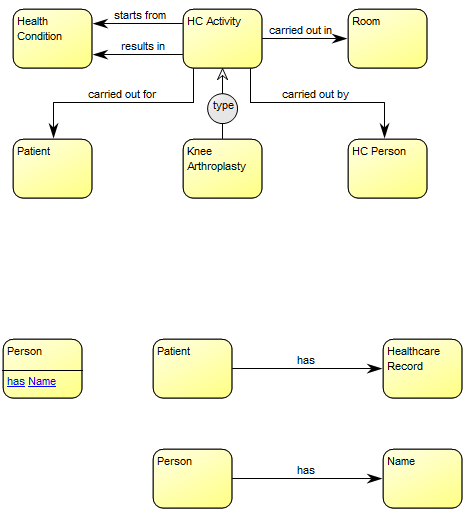
The model above shows the concepts related to the healthcare activity ‘knee arthroplasty’.
The model below shows the concepts related to a signature in the healthcare domain:

Relation to other templates: A Concept Model should enable the identification of the right terms to use in communications where high precision is needed. This is useful when creating large sets of business rules or processes that need to fit together without ambiguity and when creating complex Data Models. As such, it could be advantageous to link to a concept model from the affected Business Process Networks, Workflow Diagrams, Requirements Models and Regulation Diagrams.
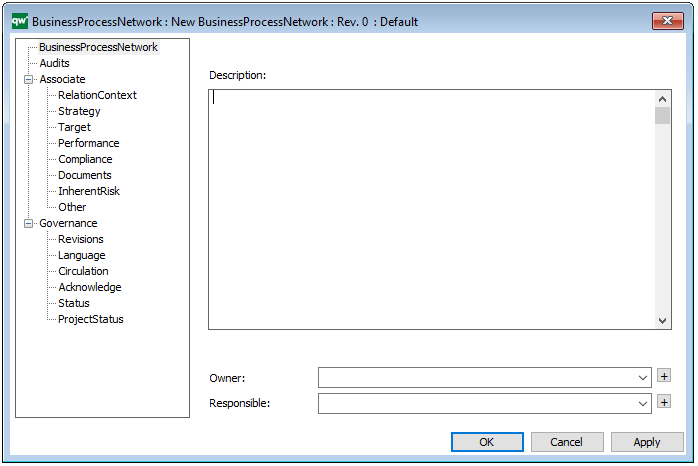
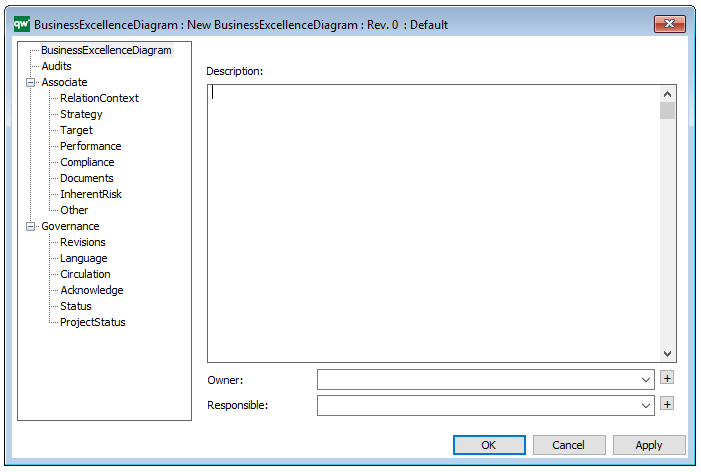
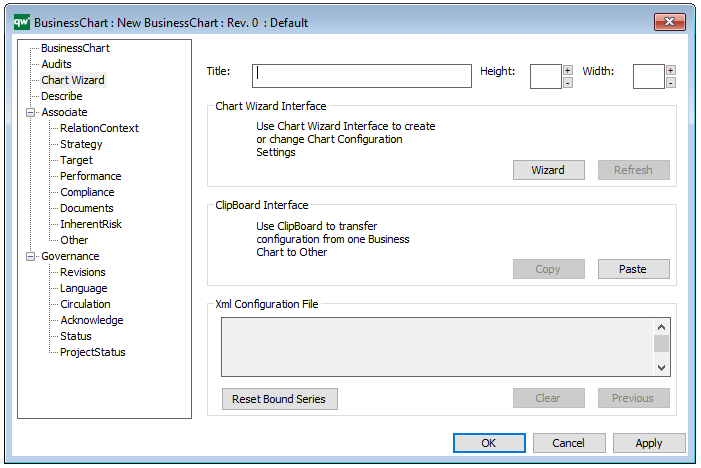
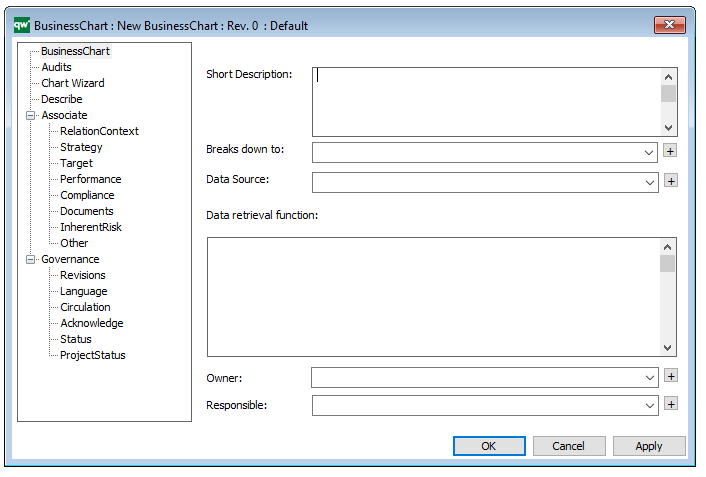
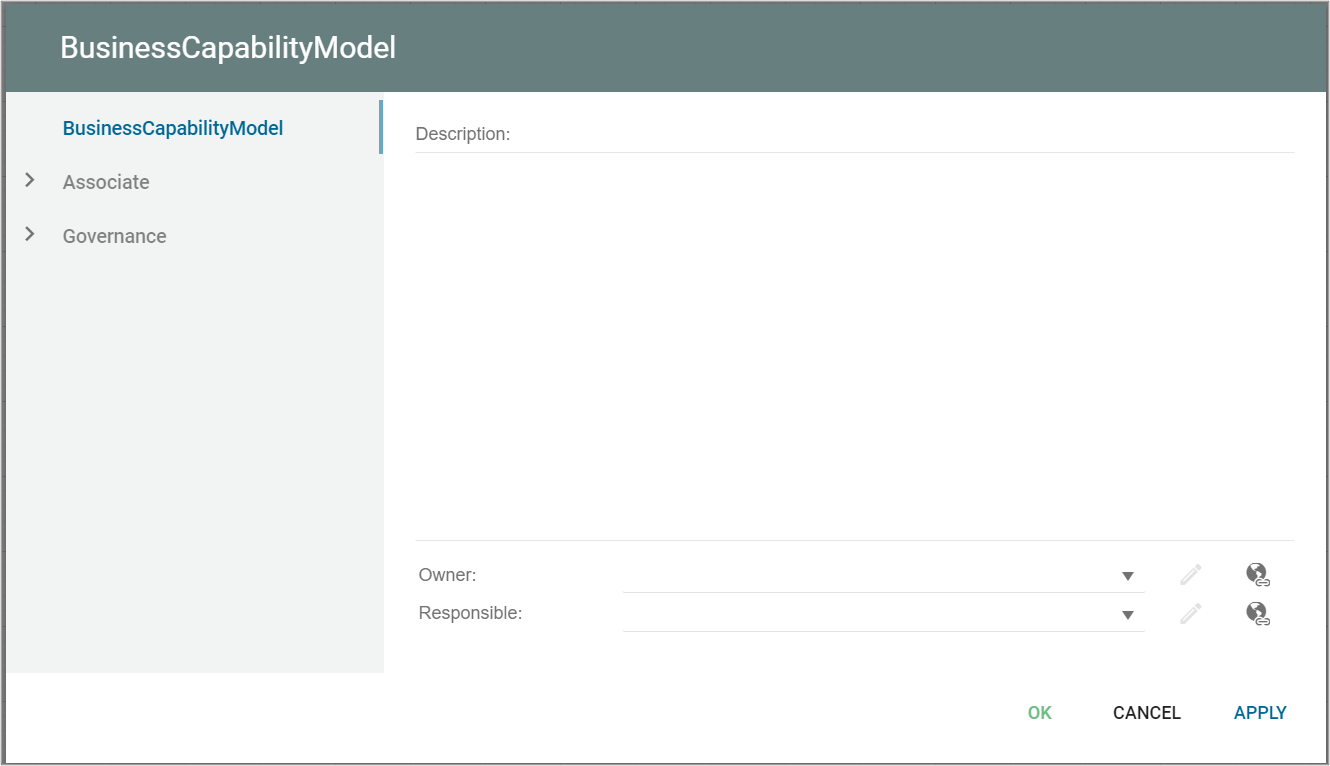
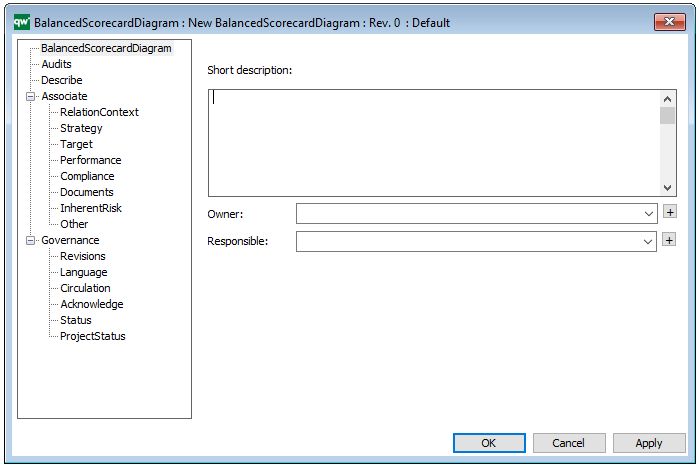
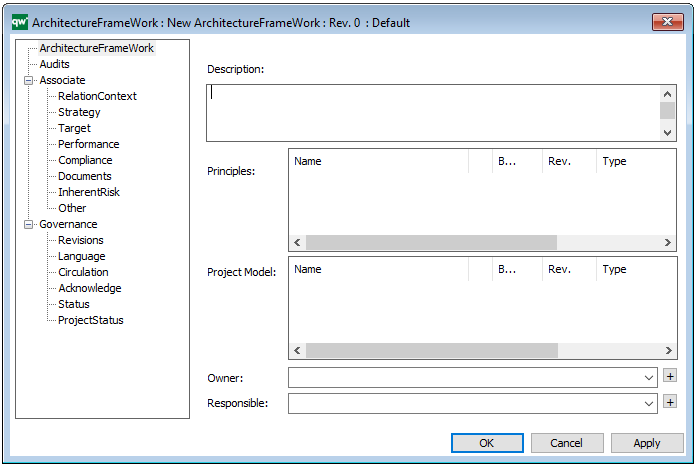
Properties and metadata: The Concept Model can for example retain the following information:
- A description of the diagram
- Link to the owner of the model
- Link to the one responsible for the model
- Link to view of area of usage
- Audits (auto generated information regarding its current state and access rights)
- Associated documents, diagrams and other objects
- Inherent Risk detailing risk considerations
- Governance information detailing information about the published diagram and who has been involved in the approval of the diagram
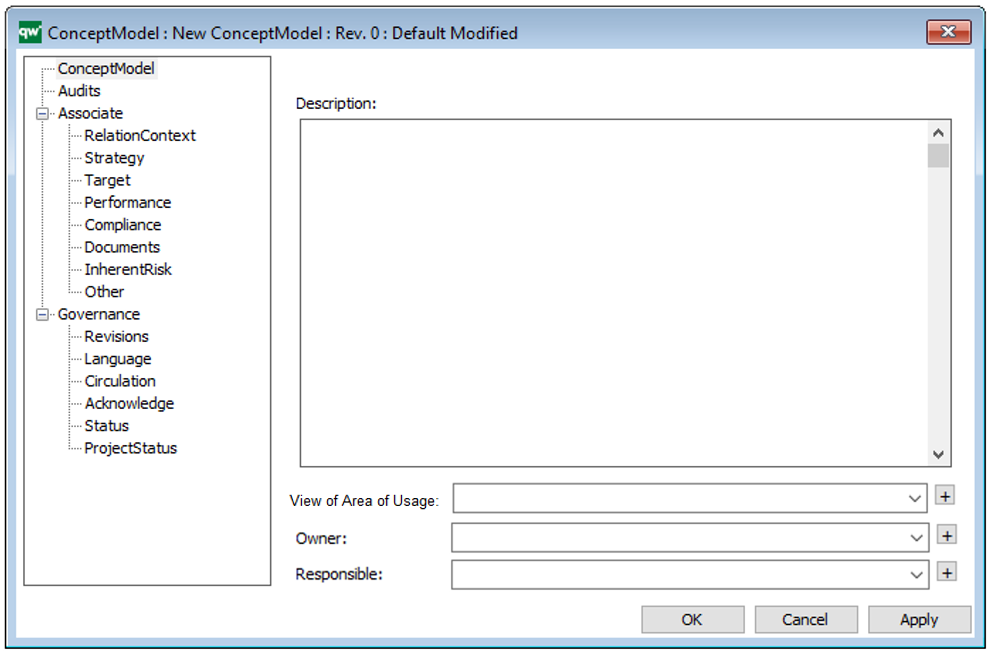
The above picture shows the properties dialogue window for the Concept Model, where you can view and edit the diagram’s properties in QualiWare Lifecycle Manager.
For more information: to learn more about Concept Models, you can read the following article:
Ronald G. Ross , “What Is a Concept Model?” Business Rules Journal Vol. 15, No. 10, (Oct. 2014). URL: http://www.brcommunity.com/a2014/b779.html