Integration View

Purpose: The purpose of the Integration View template is to document the routing of integrations between systems.

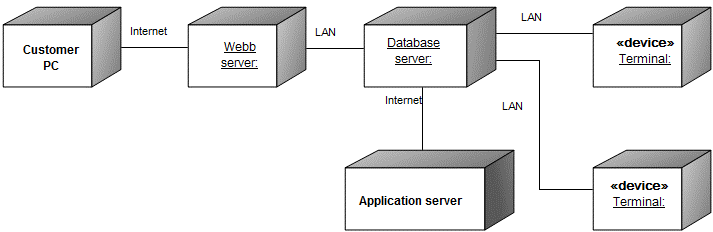
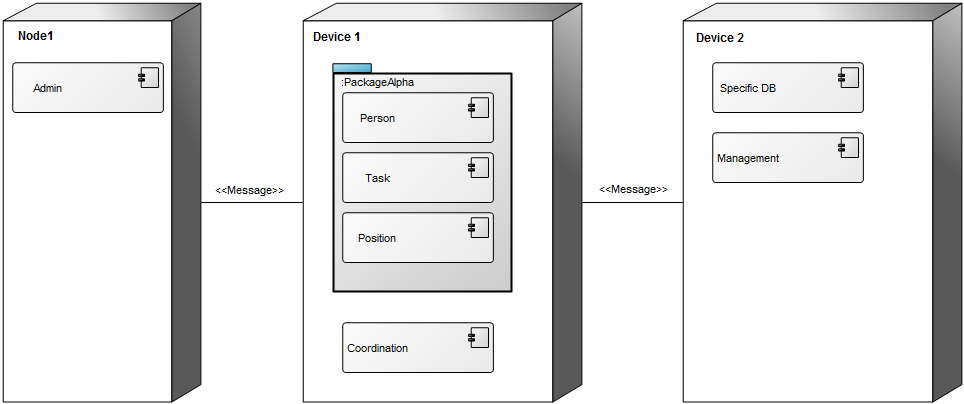
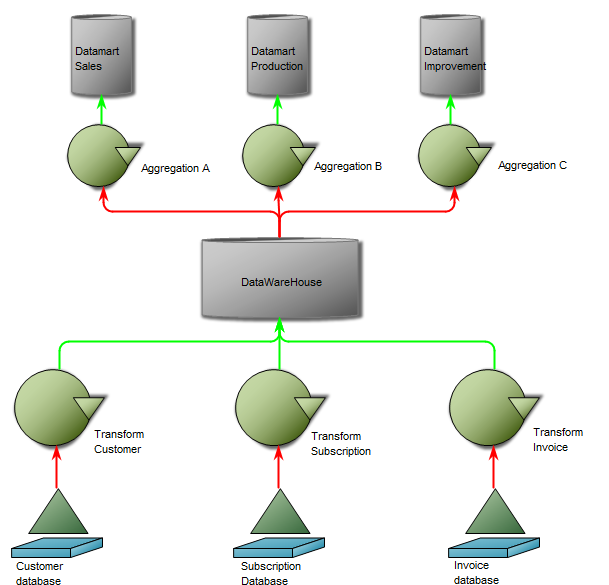
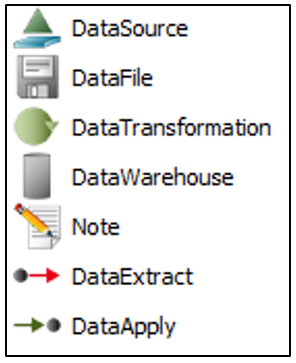
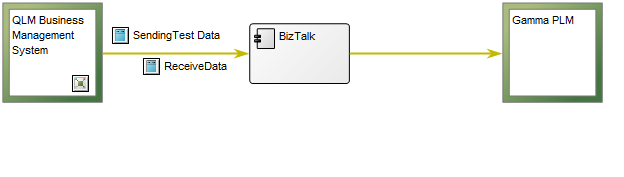
Core concerns: The Integration View template enables you to model Information Systems, System Components and External Entities (a source to or a receiver of information from a system), and connect them using Integration Flows.

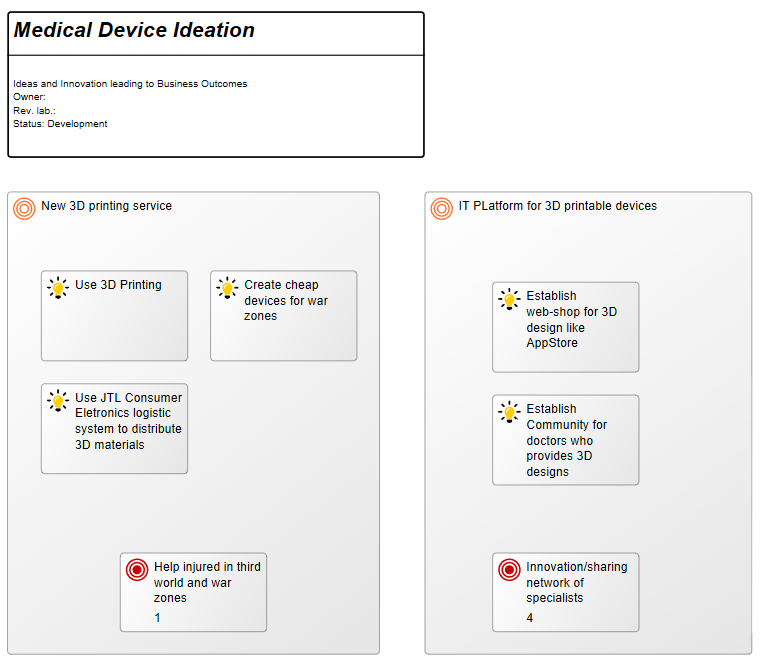
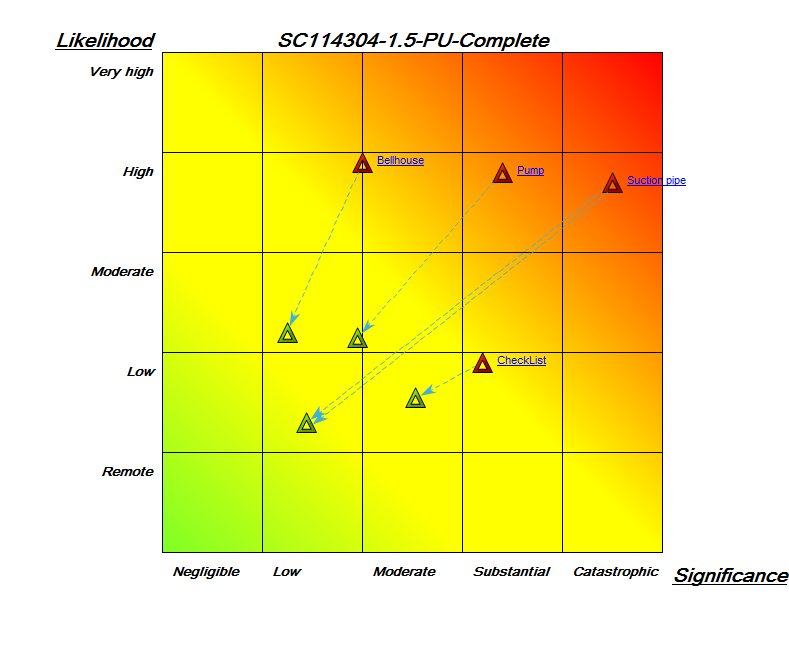
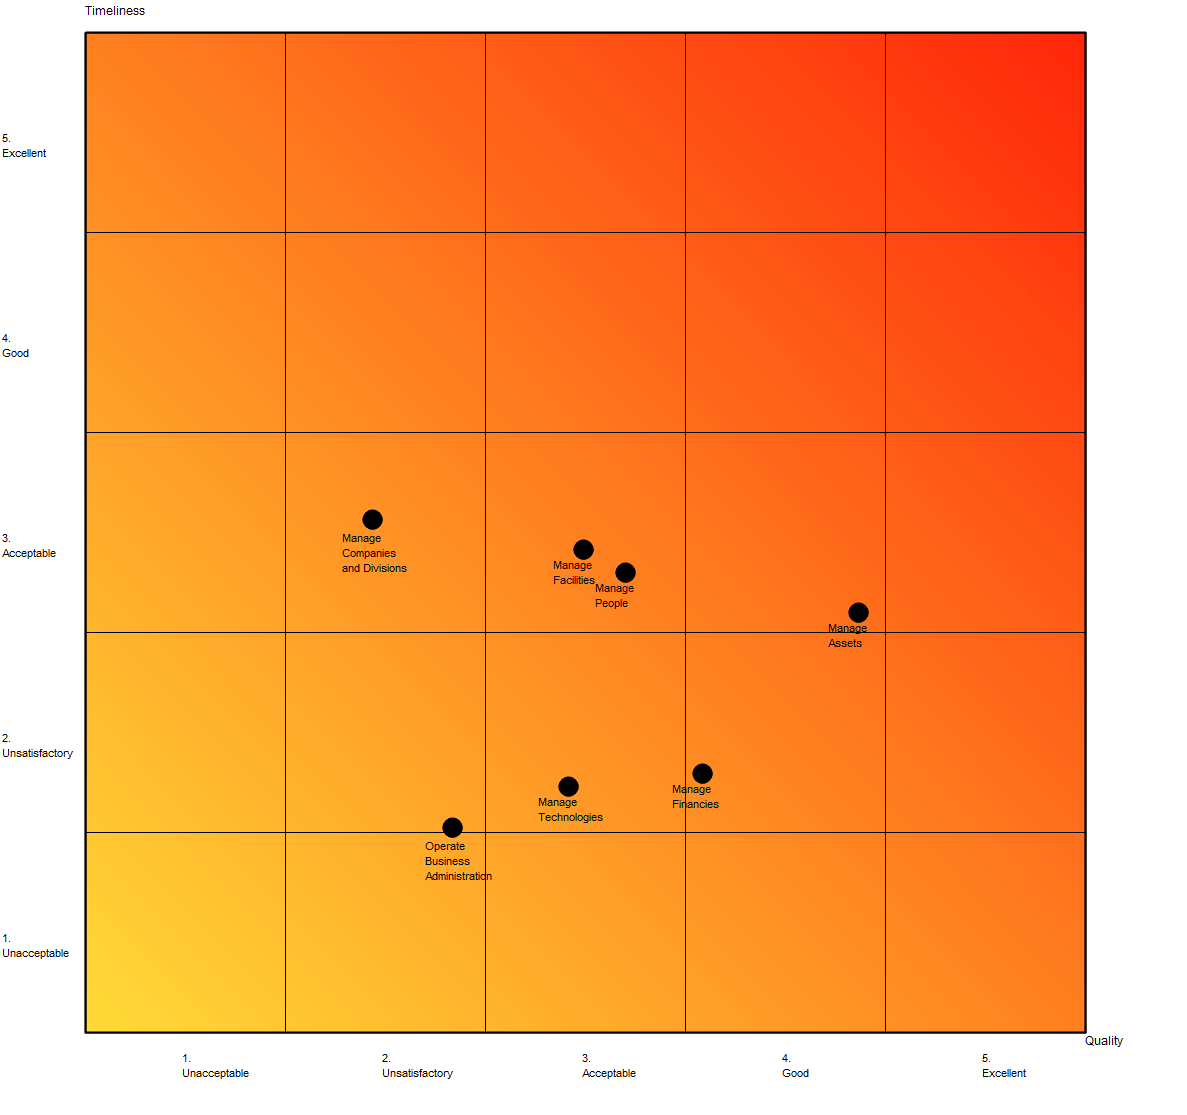
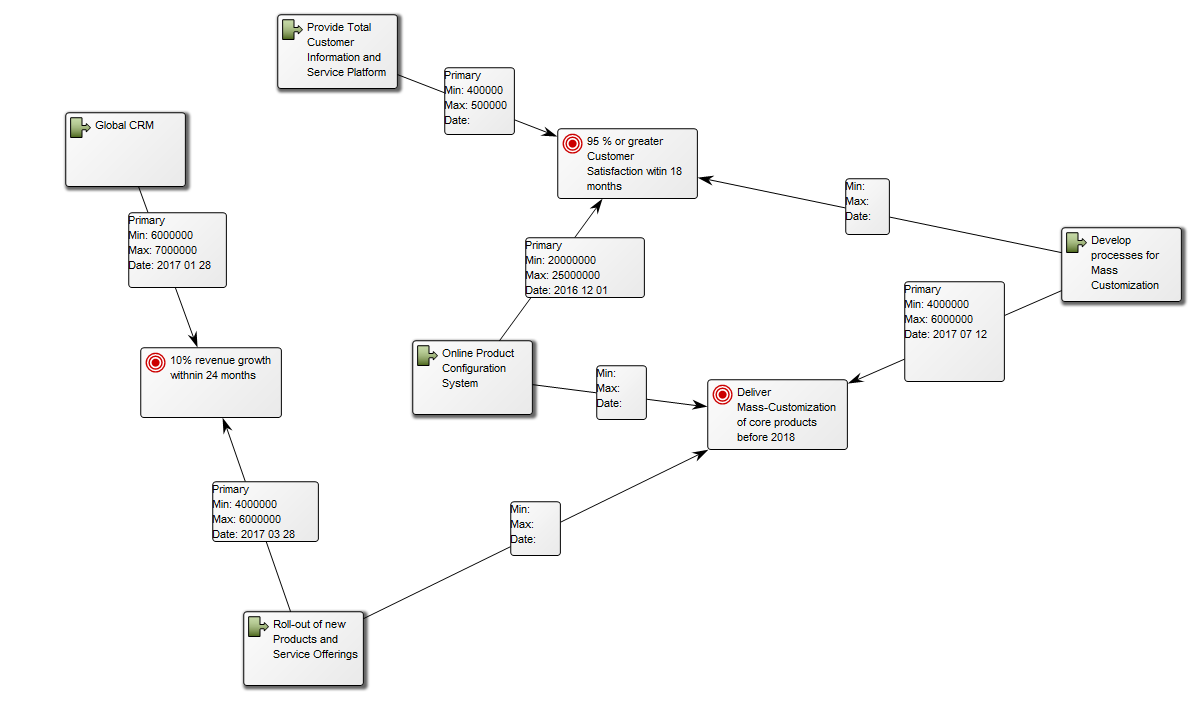
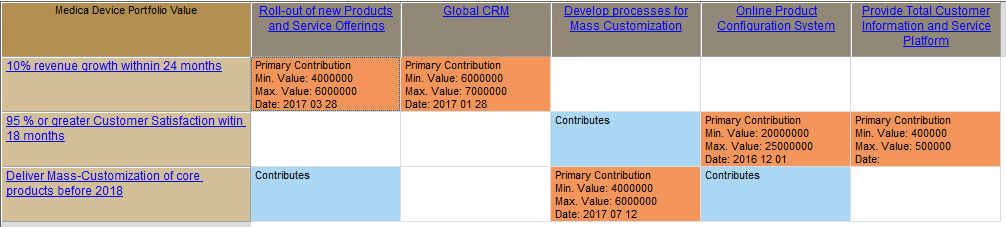
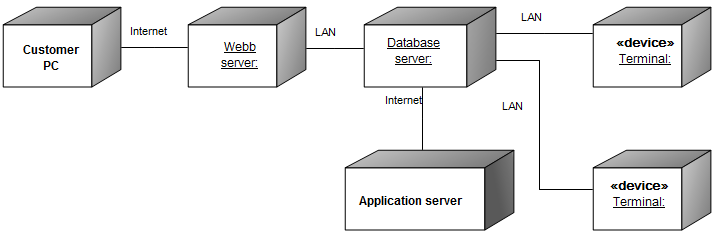
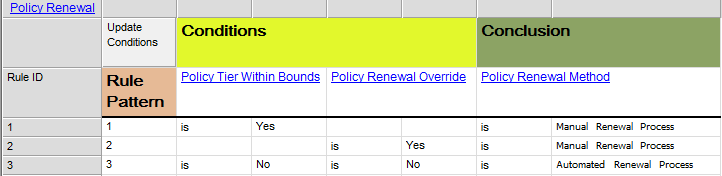
Below is an example of an Integration View concerning the flow of test data:

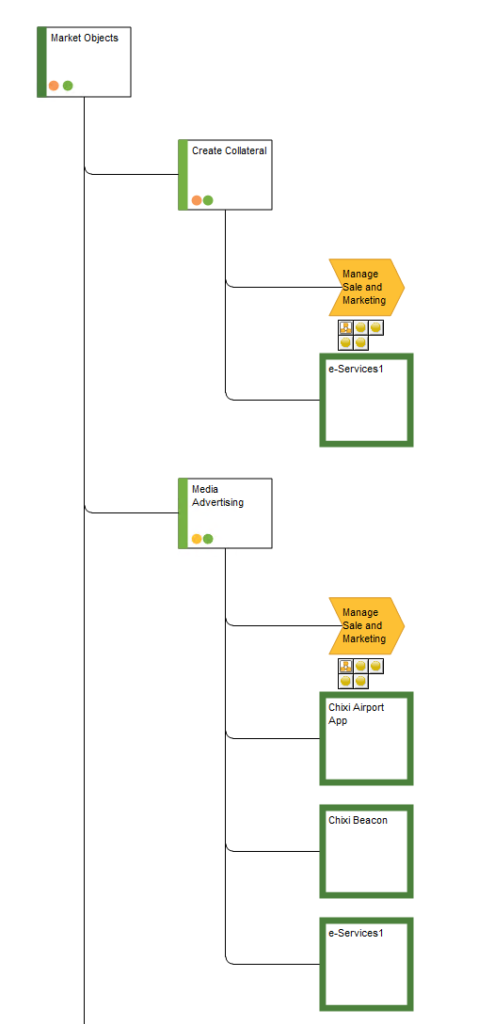
Relation to other templates: The Integration View belongs to the Application layer of the architecture and is as such related to the Application Architecture Diagram, the Data Flow Diagram and the Component Diagram.

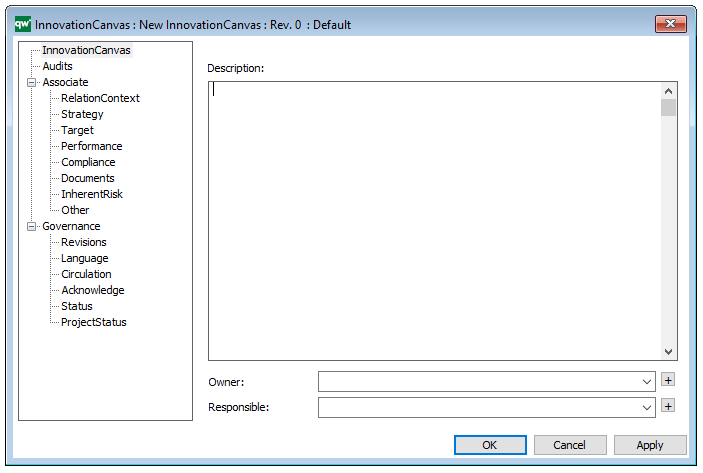
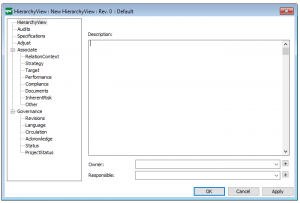
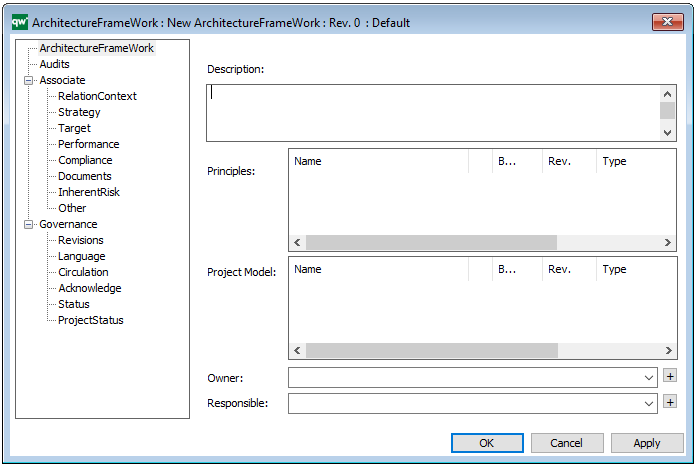
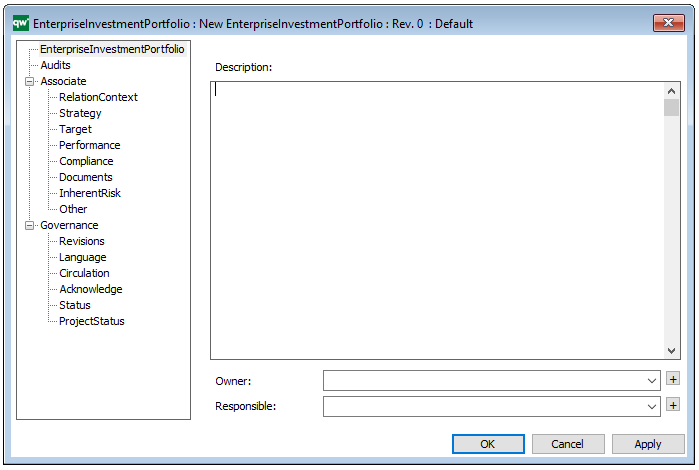
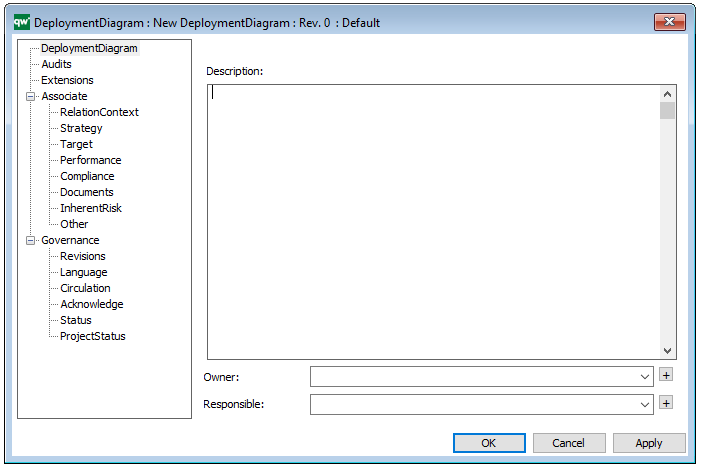
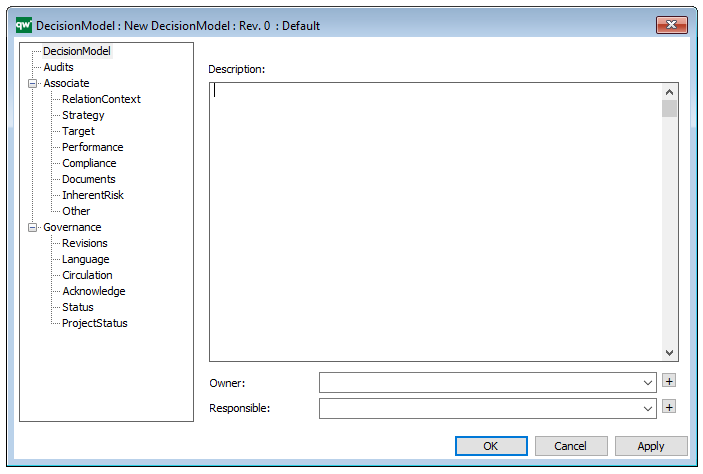
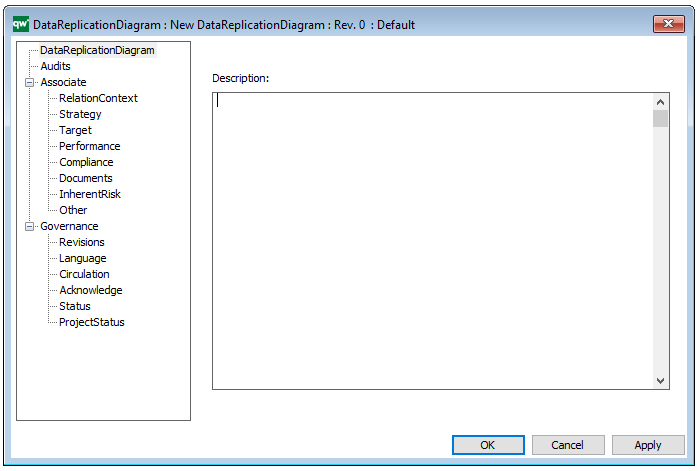
Properties and metadata: The Integration View template can for example retain the following information:

  • A description of the model
  • Audits (auto generated information regarding its current state and access rights)
  • Associated documents, diagrams and other objects
  • Inherent Risk detailing risk considerations
  • Governance information detailing information about the published diagram and who has been involved in the approval of the diagram

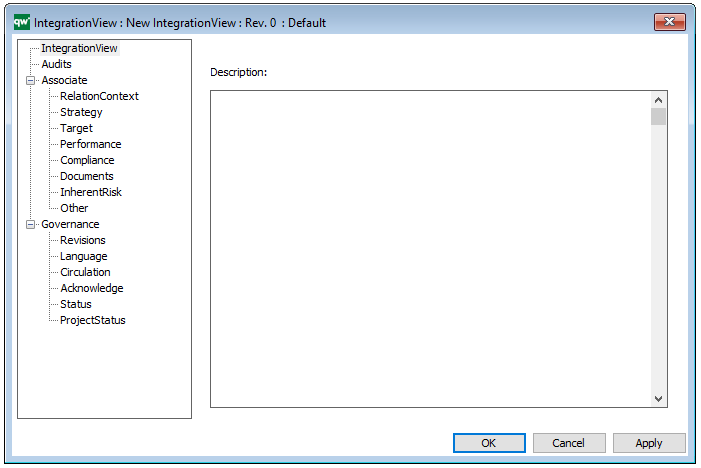
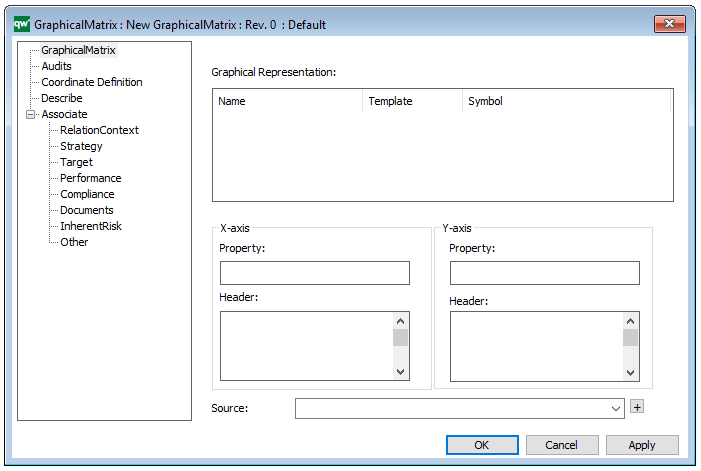
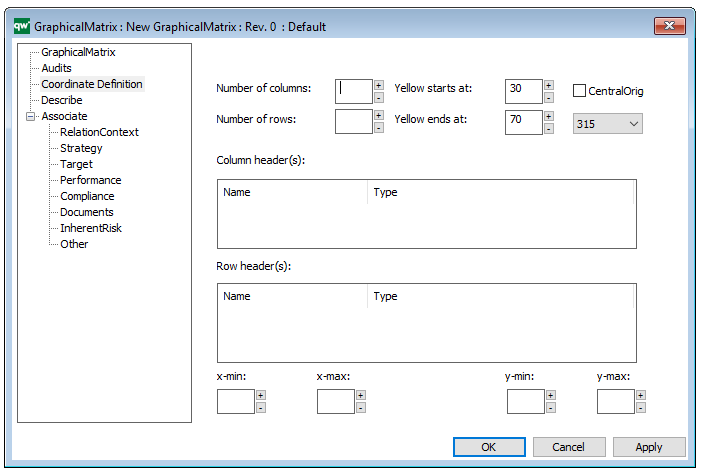
The above picture shows the properties dialogue window for the Integration View template where you can view and edit the diagram’s properties in QualiWare Lifecycle Manager.


Innovation Canvas

Purpose: The Purpose of the Innovation Canvas is to model ideas for Innovation detailing their goals and ideas for action.

Core concerns: The Innovation Canvas allows you to model an innovation detailing the ideas that exist in relation to it. In the example below, the goals of the innovation have also been defined and attached. Goals, vision, mission and many more strategic objects are available in the default extended syntax for the diagram, enabling you to model your ideas for innovation in as much detail as you prefer.

Relation to other templates: The Innovation Canvas is a strategic template and the elements modelled in it can easily be connected to other strategic templates such as a Strategy Model, Enterprise Investment Portfolio, Business Canvas or Business Capability Model.

Properties and metadata: The Innovation Canvas can for example retain the following information:

  • A description of the diagram
  • Link to the owner of the diagram
  • Link to the one responsible for the accuracy of the diagram
  • Audits (auto generated information regarding its current state and access rights)
  • Associated documents, diagrams and other objects
  • Inherent Risk detailing risk considerations
  • Governance information detailing information about the published diagram and who has been involved in the approval of the diagram
  • Project status: information about budgeted and actual man-hours spent, percentage completed and the latest milestone, result and quality control of a change process.

In the picture below you can see the Innovation Canvas’ properties dialogue window, where the properties can be viewed and edited:

Hierarchy View

Purpose: The purpose of the Hierarchy View template is to show the hierarchy of objects related to a chosen root object.

Core concerns: The root object in the hierarchy View can for example be a Capability or a Business Process. The view is not modeled as a diagram, but generated based on information specified in the template’s property dialog, making the scope of the view flexible. Below, you can see an examples of a Hierarchy View for the Capability “Market Objects”:

Relation to other templates: The Hierarchy View is not directly connected to any single template but is not unlike a Context View. The Hierarchy View is, compared to a Context View, usually filtered to only show certain types of relations amongst certain types of objects and not as a default connected to diagram templates:

Properties and metadata: The Hierarchy View template can for example retain the following information:

  • A description of the diagram
  • Link to the owner of the Hierarchy View
  • Link to the one responsible for the Hierarchy View
  • Audits (auto generated information regarding its current state and access rights)
  • Specifications (definition of root object and other inclusion criteria)
  • Adjust (specification of templates that should be removed from the view)
  • Associated documents, diagrams and other objects
  • Inherent Risk detailing risk considerations
  • Governance information detailing information about the published diagram and who has been involved in the approval of the diagram

The above picture shows the properties dialogue window for the Hierarchy View template where you can view and edit the diagram’s properties in QualiWare Lifecycle Manager.

The HierachyView can be used in relation to the Standard Tree View in the HTMLPublisher, to establish a hierarchy for the network of process models in a repository.

Heatmap

Purpose: The purpose of the Heat Map template is to document a representation of values from other QualiWare templates in the form of a Heat Map.

Core concerns: The Heat Map template is created using the Risk Management and Application Portfolio Management toolbars in a diagrams action tab in QLM. It can afterwards be found under the Heat Map template in the repository explorer window.

The Heat Map template can, for example be used to document risks, identify the most pressing ones. Additionally, Heat Maps can be used to identify systems that don’t live up to business or technical criteria.

Below, you can see two examples of Heat Maps for risks. The first shows two risks and how they compare to each other with regards to significance and likelihood:

HeatMap_2

The second Heat Map shows four risks as well as their residual risks, and how they compare to each other regarding likelihood and significance:

HeatMap_1

Relation to other templates: The Heat Map can for example be generated from data gathered from a Business Process Network, Workflow Diagram, Business Process Diagram, Application Architecture Diagram or a Strategy Model.

Properties and metadata: The Heat Map template ­­­­can for example retain the following information:

  • A description of the diagram
  • Link to the owner
  • Link to the responsible
  • Audits (auto generated information regarding its current state and access rights)
  • Associated documents, diagrams and other objects
  • Inherent Risk detailing risk considerations
  • Governance information detailing information about the published diagram and who has been involved in the approval of the model

The above picture shows the properties dialogue window for the Heat Map template, where you can view and edit the template’s properties in QualiWare Lifecycle Manager.

To learn how to build Heat Maps in QualiWare click here

Graphical Matrix

Purpose: The purpose of the Graphical Matrix template is to compare the states or scores of objects, such as for example Capabilities or Information Systems.

Core concerns: The Graphical Matrix is generated based on information inserted into its property dialog where input, x-axis and y-axis are defined. Below, you can see an example of a Graphical Matrix for capabilities, scoring their quality and timeliness:

GraphicalMatrix_1

Relation to other templates: When scoring risks and visualizing residual risks, you can use a Heatmap.

Properties and metadata: The Graphical Matrix template can for example retain the following information:

  • A description
  • Link to the source of the input
  • Coordinate definitions of the Graphical Matrix
  • Audits (auto generated information regarding its current state and access rights)
  • Associated documents, diagrams and other objects

The above picture shows the properties dialogue window for the Graphical Matrix, where you can view and edit the diagram’s properties in QualiWare Lifecycle Manager. Below, you can see the tab for Coordinate Definition:

Generic Query

Purpose: The Purpose of the Generic Query template is to provide datasets for QualiWare System templates.

Core concerns: The Generic Query template is an auxiliary template. The Generic Query can be created using a Query Design template which enables you to easily structure the query for creating reports. When creating a Report for a diagram, the Generic Query created using the Query Design should be used as a Data Set in the Report Definition.

A Generic Query can also be generated using its Property Dialog, where you can link to Data Source and filter the data selection using a wizard – see example of the property dialog below:

The Generic Query can, for example, take the form of data sheets:

GenericQuery_2

The Generic Query template can also execute a command using the Advanced Query tab:

Relation to other templates: Generic Queries are automatically created when creating a Query Design. Generic Queries are used in the following templates: HTML Template Definitions, HTML Embedded content, HTML Publisher and HTML Content tab.

Properties and Metadata: The Generic Query can for example rentain the following information:

  • A description
  • Audits (auto generated information regarding its current state and access rights)
  • Query Filter, including a wizard for filter options
  • Attribute Definition
  • Advanced Query
  • Matrix Behavior

The above picture shows the properties dialogue window for the Generic Query where you can view and edit the diagram’s properties in QualiWare Lifecycle Manager.

Read more about Query Design and GenericQuery here.


Enterprise Investment Portfolio

Purpose: The purpose of the Enterprise Investment Portfolio template is to model enterprise goals and investments.

Core concerns: The Enterprise Investment Portfolio template enables you to model Goals, Projects, and Initiatives. The projects and initiatives can be connected to enterprise goals them through Project Contributions, that show the viable minimum and optimistic maximum of the value contribution. Below, you can see an example of an Enterprise Investment Portfolio, where the way goals are realized is visualized:


EnterpriseInvestmentPortfolio_1

Other Functionalities: By using the Enterprise Investment Actions tab, you can create, for example, a Portfolio Value matrix, which offers another way to view the same data:

Relation to other templates: The Enterprise Investment Portfolio is a strategic template and is as such related to the enterprise’s Strategy Model, Strategic Roadmap, Business Canvas and Innovation Canvas. The projects contained in the initiatives can also be further described in the Work Model template.

Properties and metadata: The Enterprise Investment Portfolio template can for example retain the following information:

  • A description of the diagram
  • Link to the owner of the diagram
  • Link to the one responsible for the diagram
  • Audits (auto generated information regarding its current state and access rights)
  • Associated documents, diagrams and other objects
  • Inherent Risk detailing risk considerations
  • Governance information detailing information about the published diagram and who has been involved in the approval of the diagram

The above picture shows the properties dialogue window for the Enterprise Investment Portfolio template, where you can view and edit the diagram’s Properties in QualiWare Lifecycle Manager.

For more information: This model type is used in the Enterprise Investment Methodology developed by Chris Potts and QualiWare. To learn more about Enterprise Investment, you can about it here:Enterprise Investment.

Deployment Diagram

Purpose: The purpose of the Deployment Diagram is to document the configuration of run-time processing nodes and the components they contain.

Core concerns: The Deployment Diagram template is structural UML diagram that enables you to model Packages, Components, Artifacts, Instance Specifications, Properties, Nodes, Devices, Execution Environments, Deployment Specifications, Objects, Classes, Interfaces, and Annotations. They can then be connected through Association, Dependency, Generalization, Deployment or Manifestation.

The Deployment Diagram models how the different hardware component and software components are connected. Below you can see an example of a Deployment Diagram for a booking service:

DeploymentDiagram_1

In the next example, you can see how Packages and Components would be included in a Deployment Diagram:

DeploymentDiagram_2

Relation to other templates: The Deployment Diagram is, as a component model, part of the application domain on the operational level. As such, it offers a complimentary view to those of the Application Architecture Diagram, Class Diagram, Component Diagram, Data Flow Diagram, Data Mapping Diagram, Data Replication Diagram, Sequence Diagram, State Event Diagram, Structure Chart, and Use Case Diagram.

Properties and metadata: The Deployment Diagram can for example retain the following information:

  • A description of the diagram
  • Link to the owner of the diagram
  • Link to the one responsible for the diagram
  • Links to extensions such as Stereotypes and Constraints
  • Audits (auto generated information regarding its current state and access rights)
  • Associated documents, diagrams and other objects
  • Inherent Risk detailing risk considerations
  • Governance information detailing information about the published diagram and who has been involved in the approval of the diagram

The above picture shows the properties dialogue window for the Deployment Diagram where you can view and edit the diagram’s properties in QualiWare Lifecycle Manager.


Decision Model

Purpose: The purpose of the Decision Model template is to document complex decisions by modelling decision trees that illustrates decision gates. Below you can see an example of a Decision Model:

DecisionModel_1

Core concerns: Complex decisions can be documented as decision trees. The model illustrates the Business Decision and its underlying Rule Families. The Rule Families can contain Rule Family Tables, that precisely describe the outcome of a given set of variables. Below you can see an example of a Rule Family Table:

DecisionModel_2

Relation to other templates: Where the Decision Model template illustrates the decision gates, the end to end process is described in either a Work Flow Diagram or a Business Process Diagram.

Properties and metadata: The Decision Model can for example retain the following information:

  • A description of the diagram
  • Link to the owner of the diagram
  • Link to the one responsible for the accuracy of the diagram
  • Audits (auto generated information regarding its current state and access rights)
  • Associated documents, diagrams and other objects
  • Inherent Risk detailing risk considerations
  • Governance information detailing information about the published diagram and who has been involved in the approval of the diagram
  • Project status: information about budgeted and actual man-hours spent, percentage completed and the latest milestone, result and quality control of a change process.

In the picture below you can see the Decision Model’s properties dialogue window, where the information can be viewed and edited:


Data Replication Diagram

Purpose: The purpose of the Data Replication Diagram template is to map a high-level view of the movement and replication of information between data sources.

Core concerns: The Data Replication Diagram template enables you to map Data Sources, Data Files, Data Transformations and Data Warehouses. These elements can then be connected by either a Data Extract or a Data Apply.

Graphical representation of the elements:

Below, is an example of a Data Replication Diagram for a commercial Data Warehouse:

DataReplicationDiagram_1

The model shows that the data is extracted from different data sources, transformed and applied to the Data Warehouse from which it is extracted, aggregated and either applied to sales, production or improvement.

Relation to other templates: The Data Replication Diagram offers a high-level data mapping. The Data Transformations contained in the Data Replication Diagram can be further decomposed into more detailed Data Mapping Diagrams.

Properties and metadata: The Data Replication Diagram template ­­­­can for example retain the following information:

  • A description of the diagram
  • Audits (auto generated information regarding its current state and access rights)
  • Associated documents, diagrams and other objects
  • Inherent Risk detailing risk considerations
  • Governance information detailing information about the published diagram and who has been involved in the approval it

The above picture shows the properties dialogue window for the Data Replication Diagram, where you can view and edit the diagram’s properties in QualiWare Lifecycle Manager.