Generic Query

Purpose: The Purpose of the Generic Query template is to provide datasets for QualiWare System templates.

Core concerns: The Generic Query template is an auxiliary template. The Generic Query can be created using a Query Design template which enables you to easily structure the query for creating reports. When creating a Report for a diagram, the Generic Query created using the Query Design should be used as a Data Set in the Report Definition.

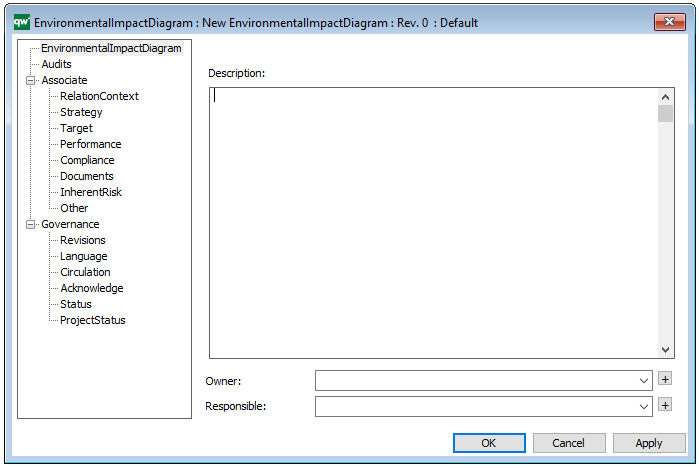
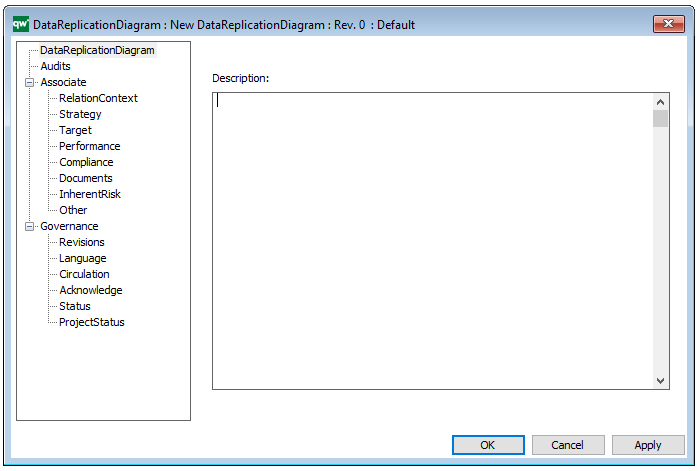
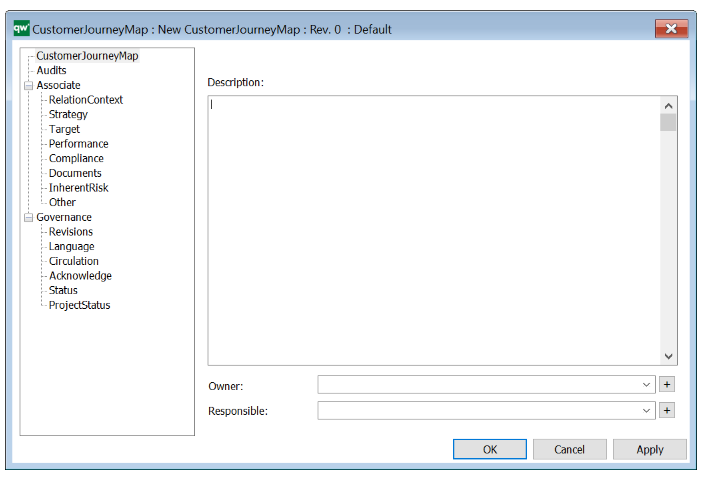
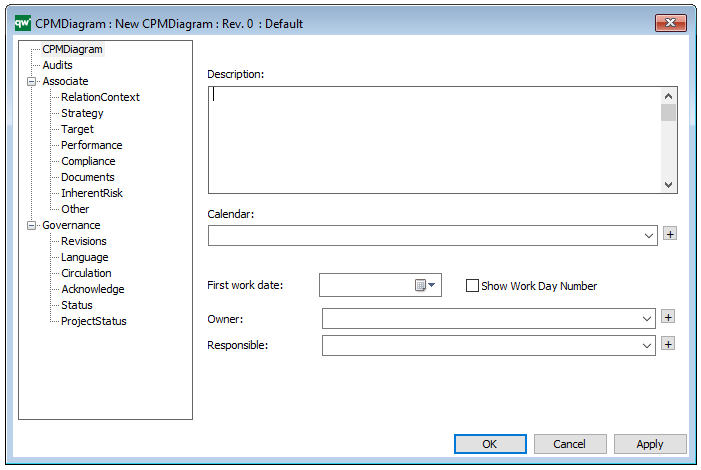
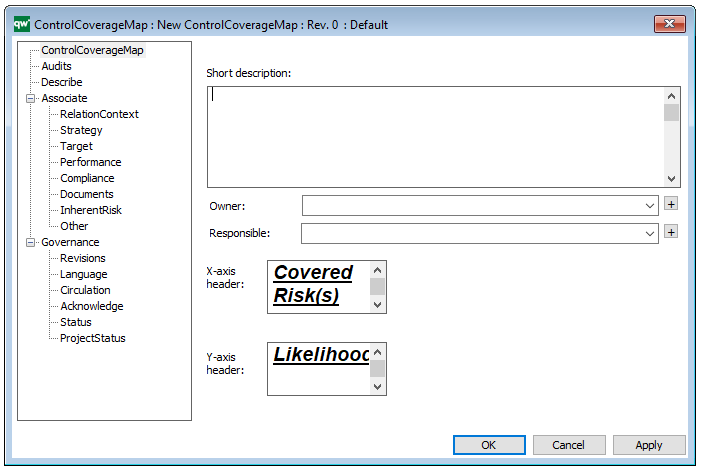
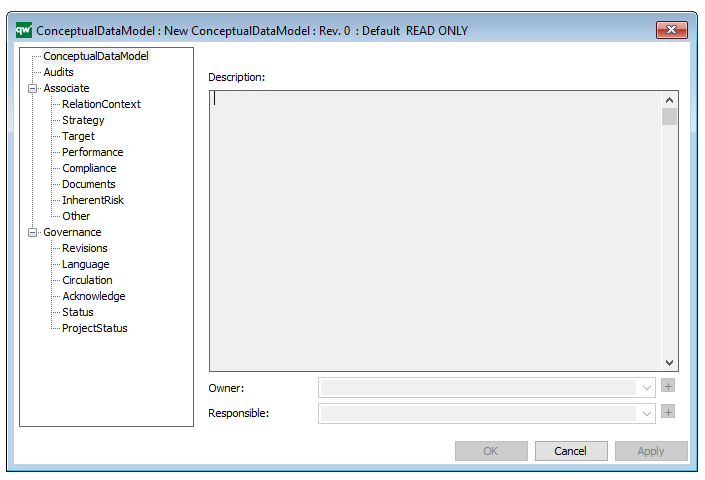
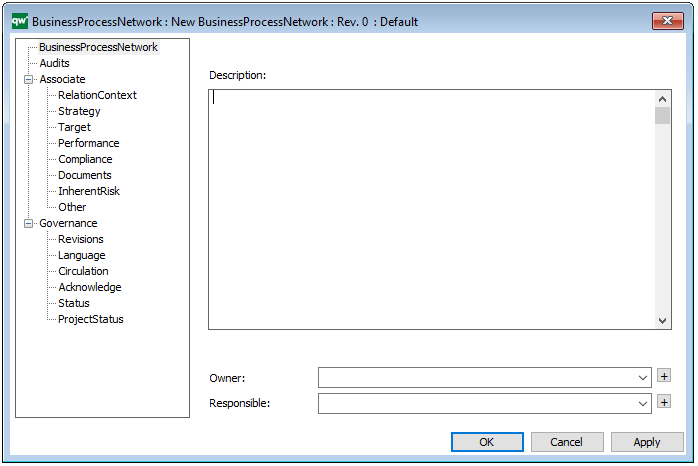
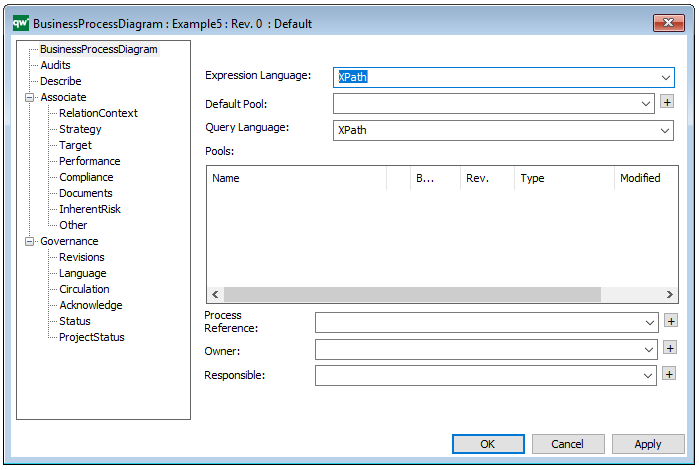
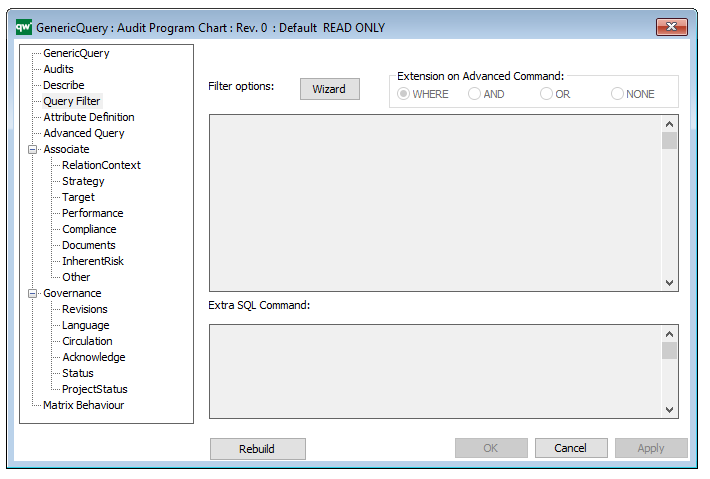
A Generic Query can also be generated using its Property Dialog, where you can link to Data Source and filter the data selection using a wizard – see example of the property dialog below:

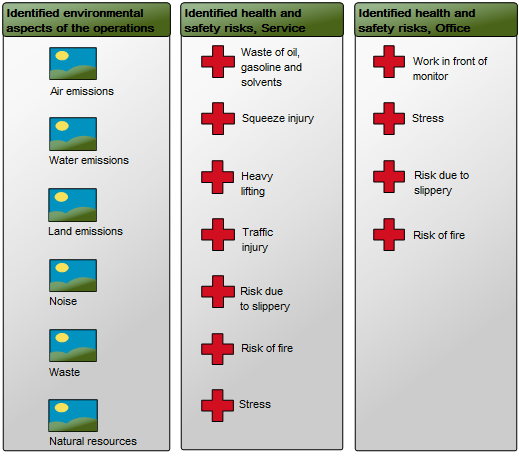
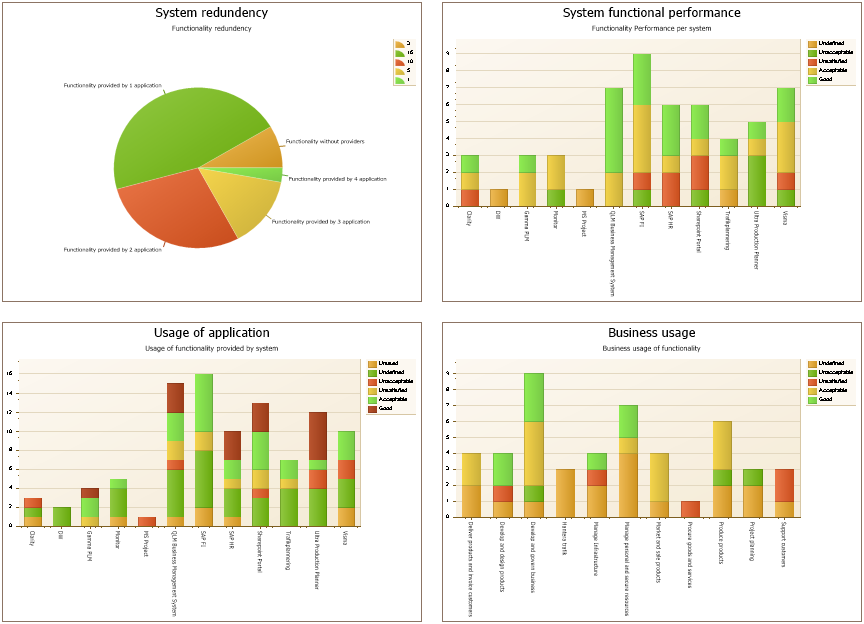
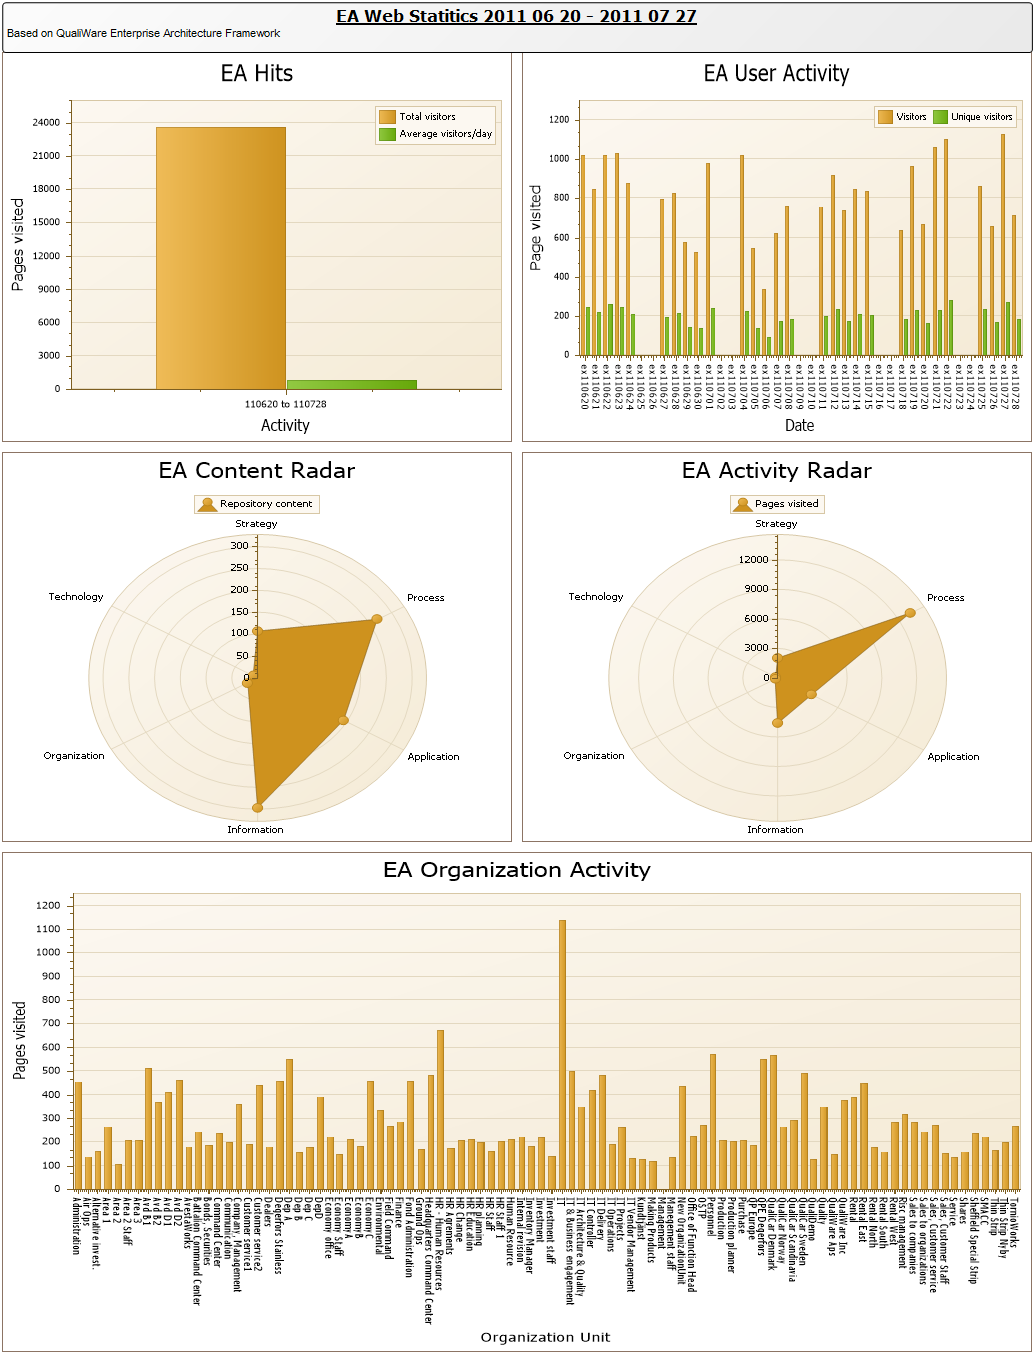
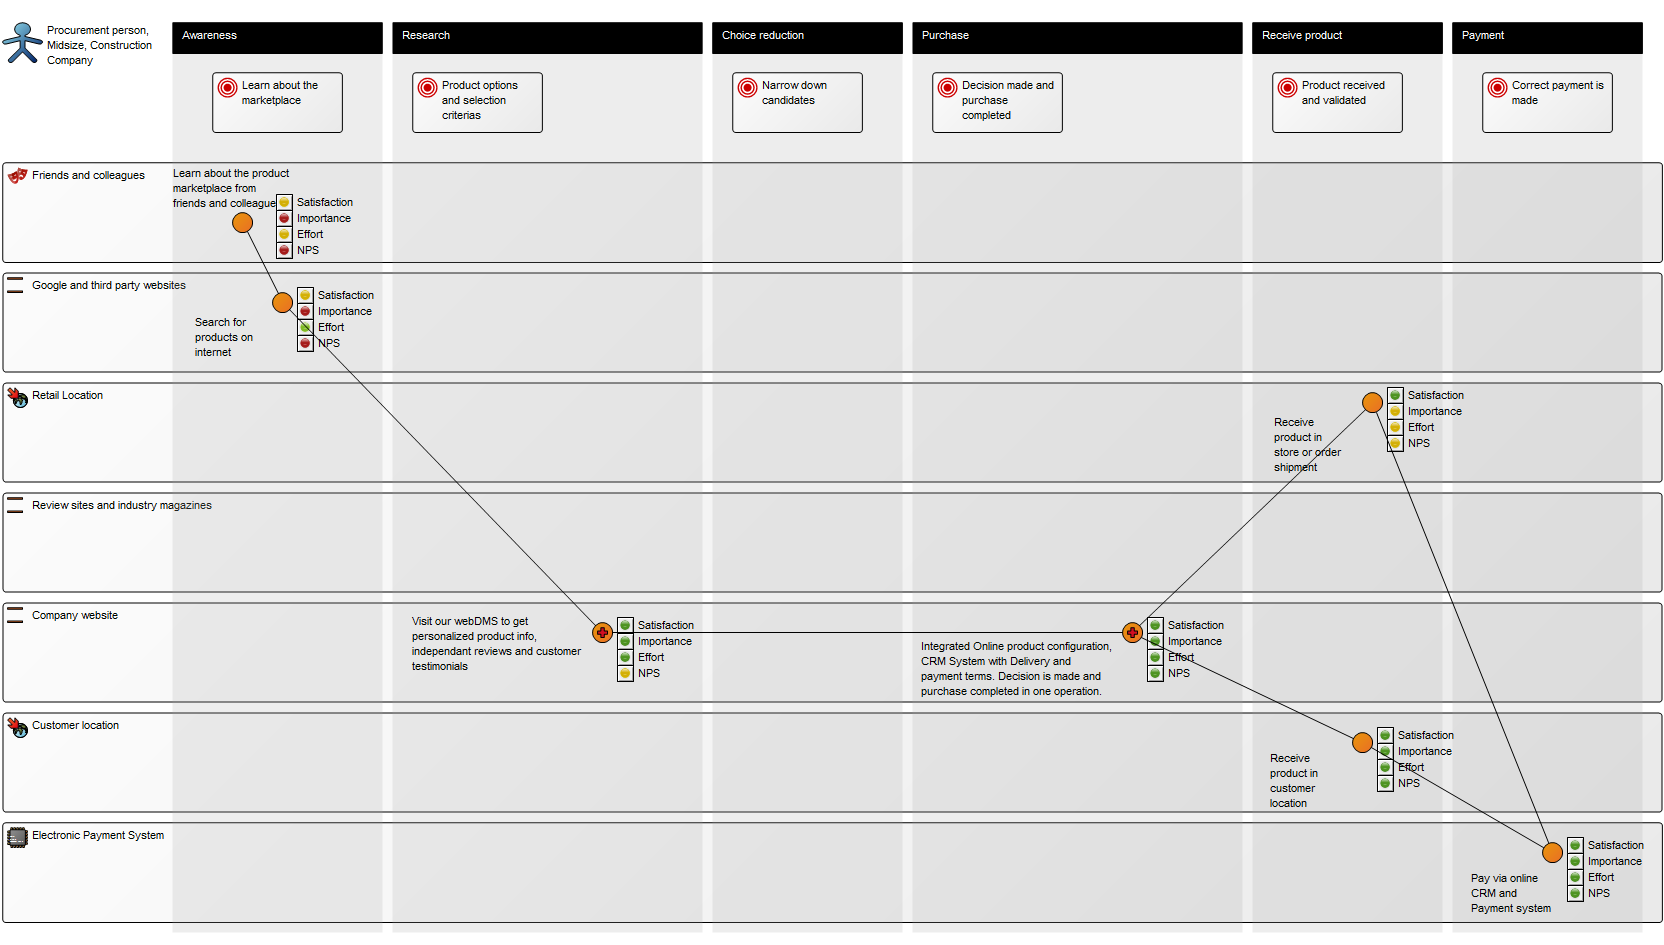
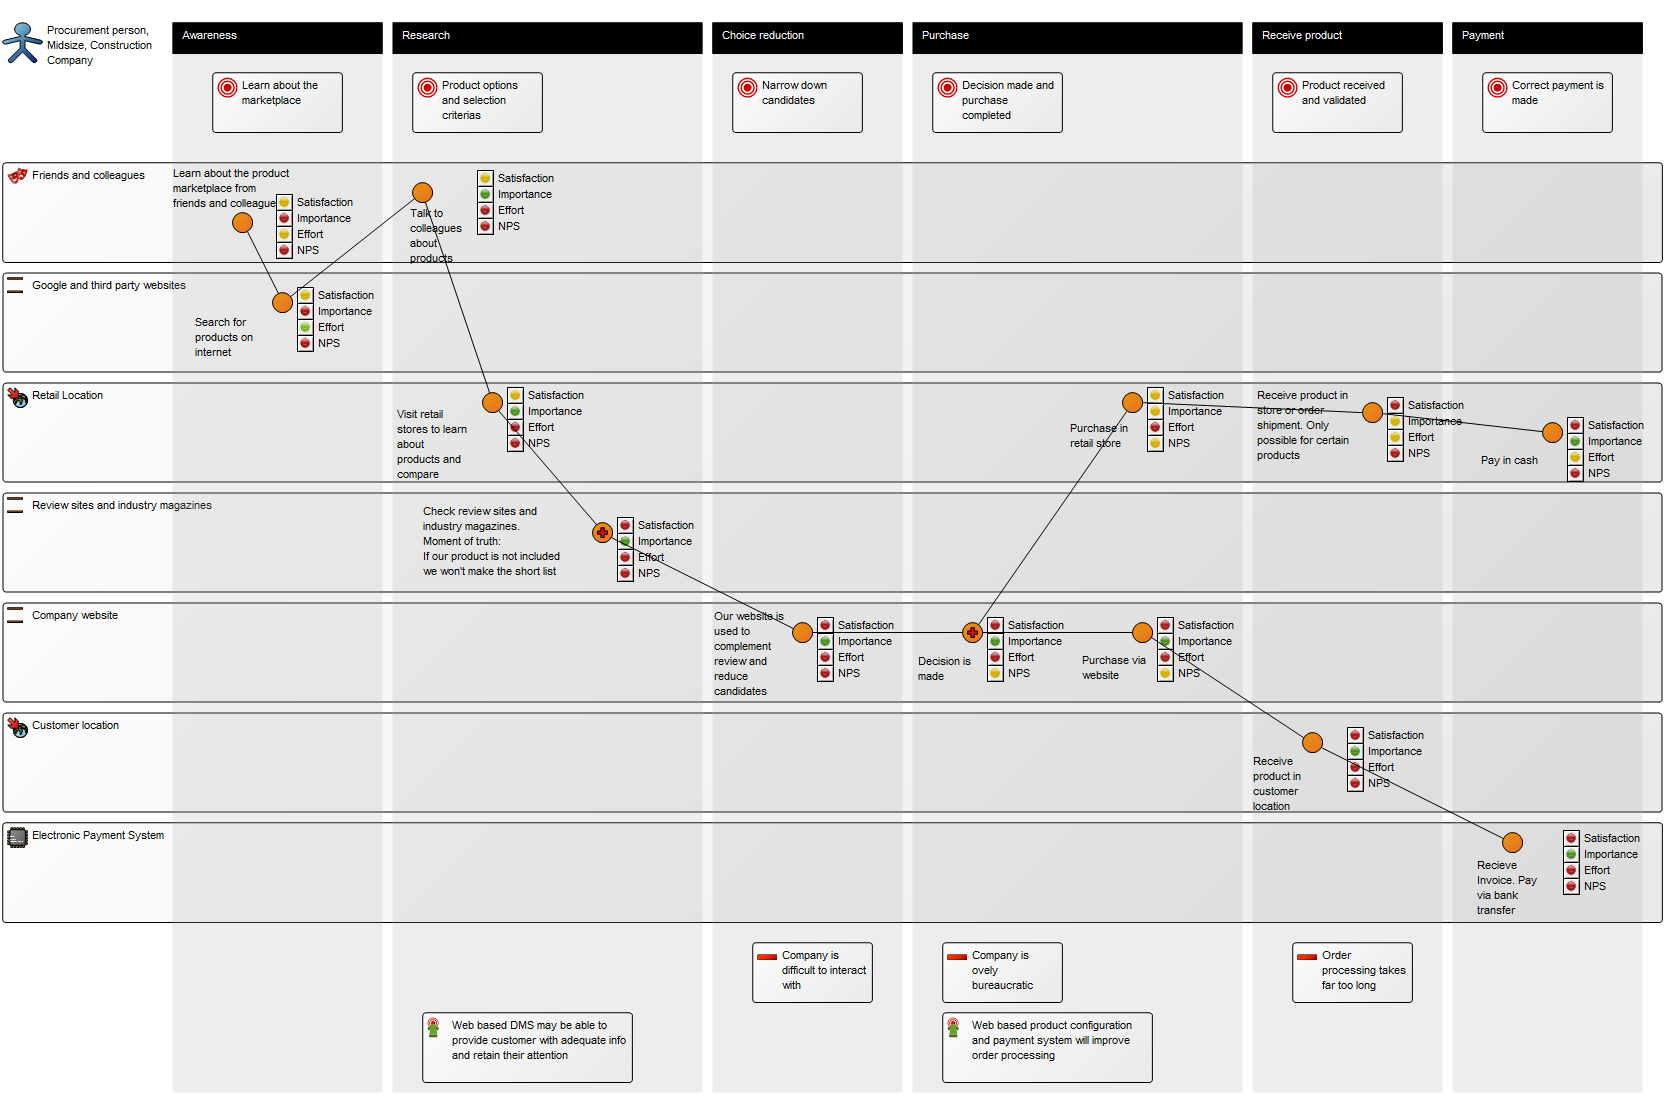
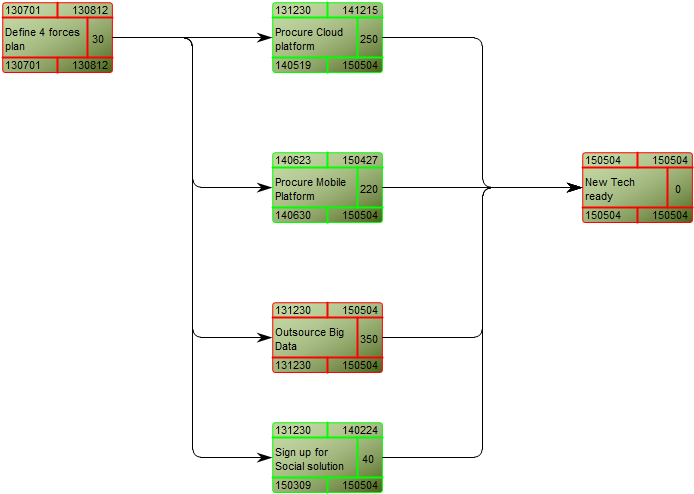
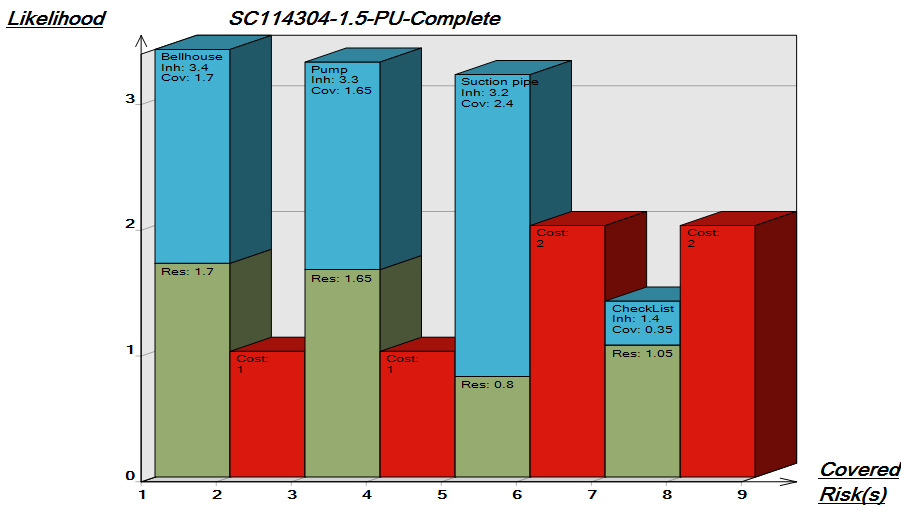
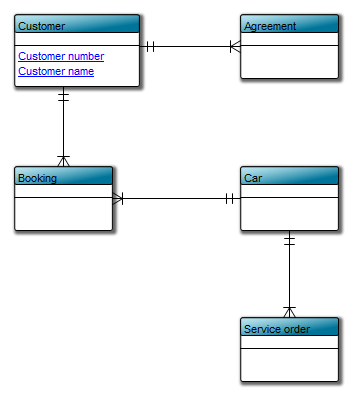
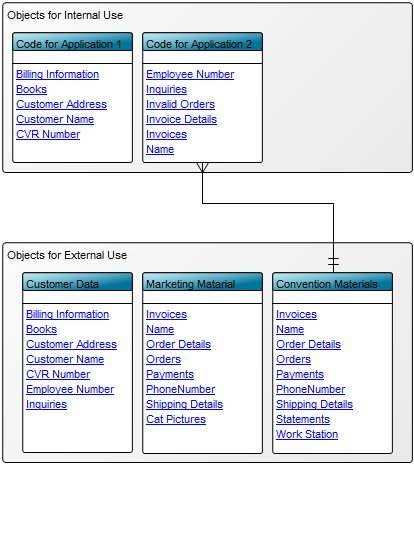
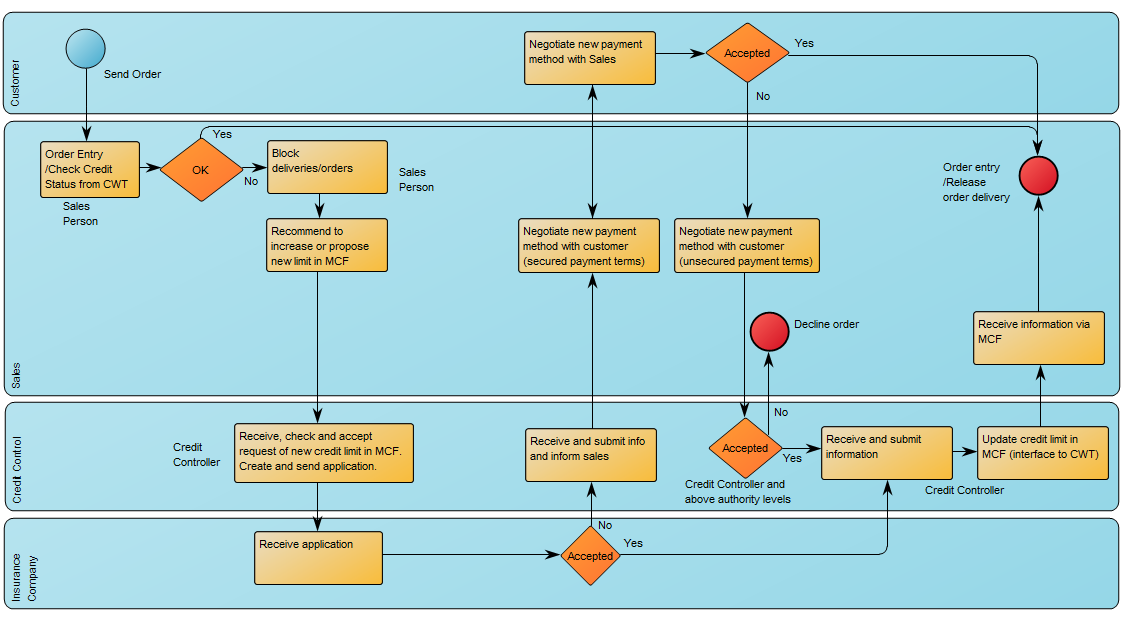
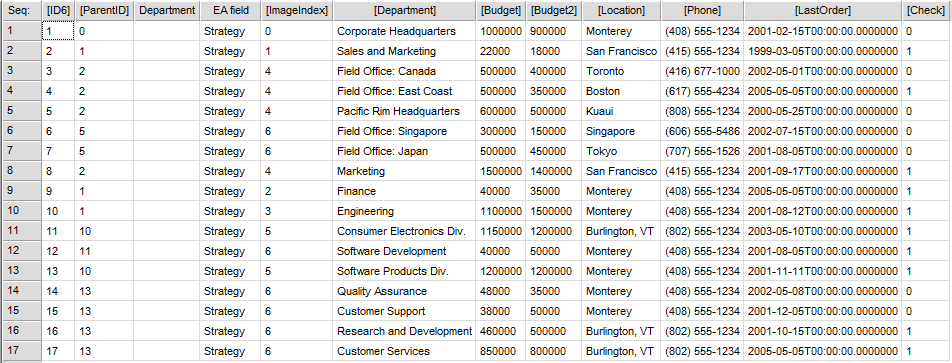
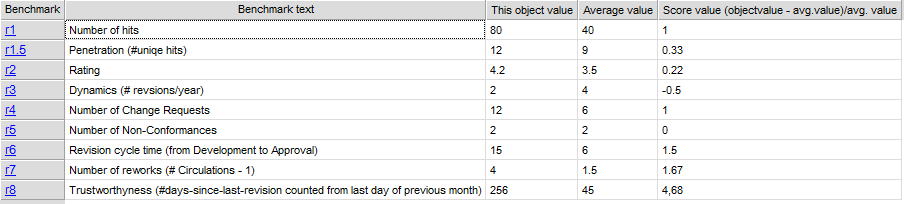
The Generic Query can, for example, take the form of data sheets:

GenericQuery_2

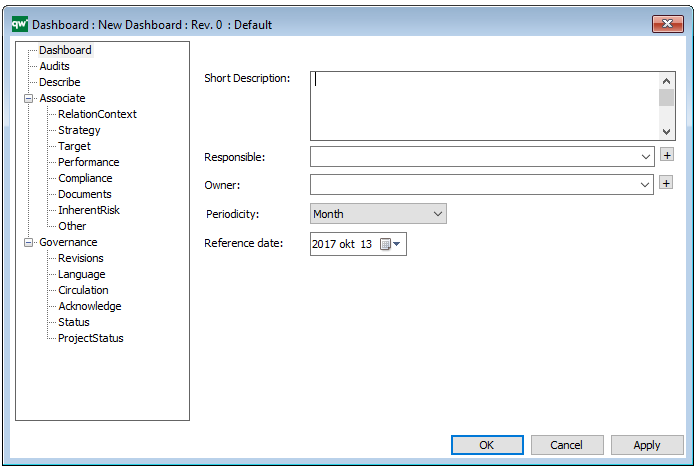
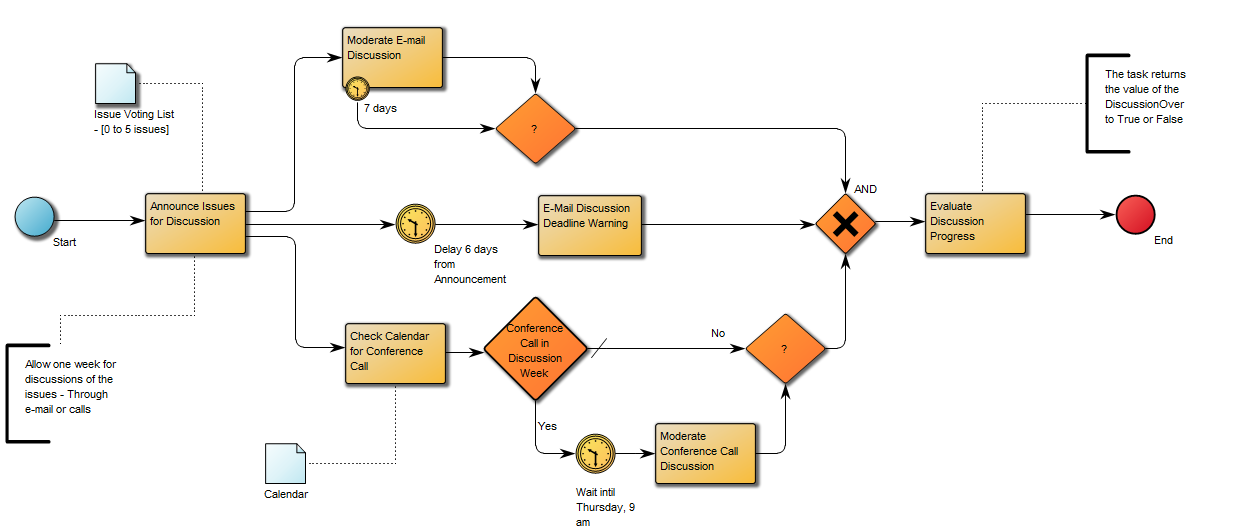
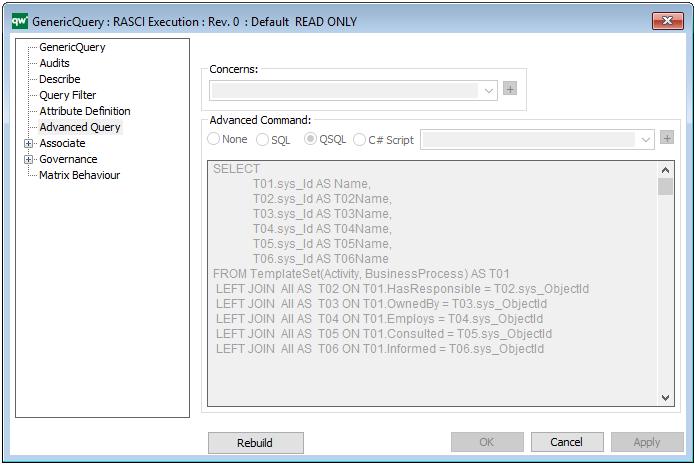
The Generic Query template can also execute a command using the Advanced Query tab:

Relation to other templates: Generic Queries are automatically created when creating a Query Design. Generic Queries are used in the following templates: HTML Template Definitions, HTML Embedded content, HTML Publisher and HTML Content tab.

Properties and Metadata: The Generic Query can for example rentain the following information:

  • A description
  • Audits (auto generated information regarding its current state and access rights)
  • Query Filter, including a wizard for filter options
  • Attribute Definition
  • Advanced Query
  • Matrix Behavior

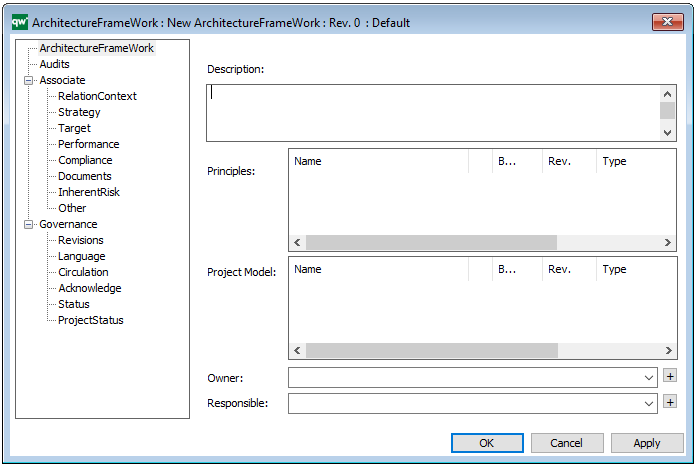
The above picture shows the properties dialogue window for the Generic Query where you can view and edit the diagram’s properties in QualiWare Lifecycle Manager.


Environmental Impact Diagram

Purpose: The purpose of the Environmental Impact Diagram template is to document the environmental aspects and impacts for an Activity or Business Process.

Core concerns: The Environmental Impact Diagram enables you to model Business Functions, Activities, Business Objects, Environmental Aspects (Environmental Aspect, Environmental Impact, Health and safety impact) and Business Scopes. These elements can then be connected by Impact Quantities.

Below, you can see an example of an Environmental Impact Diagram, detailing the Environmental aspects and Health and safety impact:

EnvironmentalImpactDiagram_1

The diagram shows all identified aspects and modes of impact for one or more specific processes.

Relation to other templates: The Environmental Impact Diagram is related to the Lifecycle Assessment diagram as well as templates containing Activities, Business Functions, Lines of Business, and Logistical Flows. As such, it is related to, for example, Business Process Diagrams, Workflow Diagrams, Business Diagrams, and Strategy Models.

Properties and metadata: The Environmental Impact Diagram template ­­­­can for example retain the following information:

  • A description of the diagram
  • Link to the owner
  • Link to the responsible
  • Audits (auto generated information regarding its current state and access rights)
  • Associated documents, diagrams and other objects
  • Inherent Risk detailing risk considerations
  • Governance information detailing information about the published diagram and who has been involved in the approval of the diagram

The above picture shows the properties dialogue window for the Environmental Impact Diagram, where you can view and edit the diagram’s properties in QualiWare Lifecycle Manager.

Data Replication Diagram

Purpose: The purpose of the Data Replication Diagram template is to map a high-level view of the movement and replication of information between data sources.

Core concerns: The Data Replication Diagram template enables you to map Data Sources, Data Files, Data Transformations and Data Warehouses. These elements can then be connected by either a Data Extract or a Data Apply.

Graphical representation of the elements:

Below, is an example of a Data Replication Diagram for a commercial Data Warehouse:

DataReplicationDiagram_1

The model shows that the data is extracted from different data sources, transformed and applied to the Data Warehouse from which it is extracted, aggregated and either applied to sales, production or improvement.

Relation to other templates: The Data Replication Diagram offers a high-level data mapping. The Data Transformations contained in the Data Replication Diagram can be further decomposed into more detailed Data Mapping Diagrams.

Properties and metadata: The Data Replication Diagram template ­­­­can for example retain the following information:

  • A description of the diagram
  • Audits (auto generated information regarding its current state and access rights)
  • Associated documents, diagrams and other objects
  • Inherent Risk detailing risk considerations
  • Governance information detailing information about the published diagram and who has been involved in the approval it

The above picture shows the properties dialogue window for the Data Replication Diagram, where you can view and edit the diagram’s properties in QualiWare Lifecycle Manager.


Dashboard

Purpose: The purpose of the Dashboard template is to publish selections of Business Charts targeting different stakeholders. It should be used to gather a series of relevant or connected Business Charts to provide a dashboard-like overview.

Core concerns: The Dashboard template enables you to gather Business Charts, Key Performance Indicators, Performance Indicators and General Concepts to create stakeholder specific views of analyzed data. For example, an Enterprise Architect could find a Dashboard containing Business Charts relevant to the usage and governance of the Enterprise Architecture useful.

Below, you can see examples of different Dashboards presenting an array of Business Charts:

Dashboard_1


Dashboard_2

Relation to other templates: The Dashboard template is closely connected to the Business Chart template, as the Dashboard publishes the charts the Business Chart template generates.

Properties and metadata: The Dashboard can for example retain the following information:

  • A description of the Dashboard
  • Link to the owner of the Dashboard
  • Link to the one responsible for the Dashboard
  • Audits (auto generated information regarding its current state and access rights)
  • Associated documents, diagrams and other objects
  • Inherent Risk detailing risk considerations
  • Governance information detailing information about the published diagram and who has been involved in the approval of the diagram

The above picture shows the properties dialogue window for the Dashboard template where you can view and edit the dashboard’s properties in QualiWare Lifecycle Manager.

Customer Journey Map

Purpose: The Purpose of the Customer Journey Map template is to document the customer’s journey from awareness to the end of their interaction with an organization, covering possible touch points from the customer’s perspective.

Core Concerns: The Customer Journey Map template allows you to model connections between different Personas, Customer Journey Phases, Touch Points, Goals, Roles, Locations, Channels, Technology and the aspects from a SWOT analysis.

You can choose to model both a current state and a desired future state of the customer journey and use the documentation for process improvement. Below is an example of a current state model and a future state model:

Current state model:

CustomerJourneyMap_2

Desired future model:

CustomerJourneyMap_1

Other functionalities: The customer’s touchpoints can be elaborated upon with four scores for Customer Satisfaction, Customer Importance, Customer Effort and Net Promoter Score. Particularly vital touchpoints can be designated as a Moment of Truth.

Relation to other templates: The Customer Journey Map can be used as a groundwork for a strategic change, which for example can be modelled in a Work Model, a Business Capability Model and/or a Strategy Model.

Properties and metadata: The Customer Journey Map can for example retain the following information:

  • A description of the diagram
  • Link to the owner of the diagram
  • Link to the one responsible for the accuracy of the diagram
  • Audits (auto generated information regarding its current state and access rights)
  • Associated documents, diagrams and other objects
  • Inherent Risk detailing risk considerations
  • Governance information detailing information about the published diagram and who has been involved in the approval of the diagram
  • Project status: information about budgeted and actual man-hours spent, percentage completed and the latest milestone, result and quality control of a change process.

The above picture shows the properties dialogue window for the Customer Journey Map, where you can view and edit the diagram’s properties.

For more information: on Customer Journey Mapping, please view our webinar Experience Mapping – Customer Obsession for IT and Digital Professionals with Milan Guenther and Katharina Weber.


CPM Diagram

Purpose: The Purpose of the Critical Path Method Diagram (CPM Diagram) is to reveal the critical path through a project, i.e. the list of activities that needs special attention since a delay in these activities will delay the whole project.

Core concerns: The CPM Diagram enables you to model Project Activities and connect them with Activity Paths. The Project Activities are then enriched with information about latest and earliest dates for start and finish as well as information about duration and slack for each Project Activity.

This makes it possible to calculate the probability of finishing the project within the planned timeframe, and to successively improve and detail the plan.

Below, you can see an example of a CPM Diagram about how to develop an organization to support a strategic change. It concerns the incoming and outgoing flow of employees as well as their training across several locations:


CPMDiagram_2

As you can see, the critical path is marked with red.

The following example is of a technology roadmap, where the critical path shows the three most critical project activities for on-time completion:

Other functionalities: A Calendar can be linked to the Property Dialog of the diagram showing holidays for the project.

Relation to other templates: The CPM Diagram template should be used after a project has been broken down into Project Activities. As such, it can be a decomposition of a Project Activity from a Business Canvas, Value Proposition, Work Model, Strategy Model or Innovation Canvas.

Properties and metadata: The CPM Diagram ­­­­can for example retain the following information:

  • A description of the diagram
  • Link to owner
  • Link to responsible
  • Link to calendar
  • Audits (auto generated information regarding its current state and access rights)
  • Associated documents, diagrams and other objects
  • Inherent Risk detailing risk considerations
  • Governance information detailing information about the published diagram and who has been involved in the approval of the diagram

The above picture shows the properties dialogue window for the CPM diagram where you can view and edit the diagram’s properties in QualiWare Lifecycle Manager.

Control Coverage Map

Purpose: The purpose of the Control Coverage Map is to provide an overview of uncovered risks, residual risks and potential cost of the risk occurring.

Core concerns: The Control Coverage Map concerns itself with Financial Risk Management and is created using the Actions tabs in QLM. It can be created based on the information in a Risk Heatmap or by using information from a diagram which contains risks that also have control actions.

Below, you can see an example of a Control Coverage map for four risks related to a Bellhouse, a Pump, a Suction pipe and using Check lists:

ControlCoverageMap

The Blue column represents the likelihood of the risk before the control action, the green column represents the likelihood of the risk after the implementation of a control action. The red columns represent the estimated cost if the risk is realized.

Relation to other templates: The Control Coverage Map presents graphical views of information from other diagrams the same as the Heatmap, Business Charts and the Graphical Matrix. It can be used by any diagram containing Activities with attached risks that have control activities.

Properties and metadata: The Control Coverage Map ­­­­can for example retain the following information:

  • A description
  • Link to the owner
  • Link to the one responsible
  • Graphical specification for the headers of the X-axis and Y-axis
  • Audits (auto generated information regarding its current state and access rights)
  • Associated documents, diagrams and other objects
  • Inherent Risk detailing risk considerations
  • Governance information detailing information about the published diagram and who has been involved in the approval of the Control Coverage Map

The above picture shows the properties dialogue window for the Control Coverage Map template where you can view and edit the template’s properties in QualiWare Lifecycle Manager.

Conceptual Data Model

Purpose: The Conceptual Data Model template is used to describe a high-level business oriented structure of the information concept used in a specific business area. Below yo can se an example of a Conceptual Data Model where the data is divided into data for internal and external use:

ConceptualDataModel_2

Core concerns: The conceptual data model template enables you to model a preliminary high level data model. It may be abstract in content and sparse in attributes. Its preliminary structure allows for many-to-many relationships. When using the Conceptual Data Model, you can model Information Concepts, Subject Areas, and their interrelationships. Below, you can see a car rental service’s Conceptual Data Model for a customer’s data.

ConceptualDataModel_1

Relation to other templates: The conceptual data model is a means of communicating information structures between participants in a project or documenting the overall Information Concept of a specific organization. For a more detailed model you should use a Data Model Diagram.

Properties and metadata: The Conceptual Data Model can for example retain the following metadata:

  • A description of the diagram
  • Link to the owner of the diagram
  • Link to the one responsible for the accuracy of the diagram
  • Audits (auto generated information regarding its current state and access rights)
  • Associated documents, diagrams and other objects
  • Inherent Risk detailing risk considerations
  • Governance information detailing information about the published diagram and who has been involved in the approval of the diagram
  • Project status: information about budgeted and actual man-hours spent, percentage completed and the latest milestone, result and quality control of a change process.

In the picture below you can see the Conceptual Data Model’s properties dialogue window, where the information can be viewed and edited:

Business Process Network

Purpose: The purpose of the Business Process Network is to at document a mid- to high-level view of Business Processes and their interrelationships.

Core concerns: The Business Process Network template enables the documentation of top to mid-level processes. The core objects available to model with are Business Processes, Business Events, Business Objects, Business Scope, Information Systems, and different types of connections. Below you can see two examples of a Business Process Network modelled in different styles.

High level process view without business events or connections between processes:

BusinessProcessNetwork_2

High-level process view where business events and connections indicate a flow between processes, stakeholders and customers:

BusinessProcessNetwork_1

Relation to other templates: The top-level processes would typically be broken down to one or more levels of mid-level processes. The last level of Business Process Networks can then be broken down to several Workflow Diagrams or Business Process Diagrams detailing the activities contained within the business process

Properties and metadata: The Business Process Network can for example retain the following information:

  • Description of the diagram
  • Link to the owner of the diagram
  • Link to the one responsible for executing the processes in the diagram
  • Audits (auto generated information regarding its current state and access rights)
  • Associated documents, diagrams and other objects
  • Inherent Risk detailing risk considerations
  • Governance information detailing information about the published diagram and who has been involved in the approval of the diagram

In the picture below you can see the Business Process Network’s properties dialogue window, where the diagrams properties can be viewed and edited:

Business Process Diagram

Purpose: The purpose of the Business Process Diagram template is to enable workflow modelling using the industry standard BPMN (Business Process Modeling Notation).

Core concerns: The Business Process Diagram template supply you with the BPMN icons that enable you to draw a workflow diagram. These icons include different types of events, activities, gateways, connectors, as well as pools, lanes and artifacts such as data objects and messages. The Business Process Diagram is typically used to illustrate business processes and software processes used in requirement documentation. Below is an example of a classic BPMN diagram with swimlanes:

BusinessProcessDiagram_1

To ensure the right BPMN syntax, the Business Process Diagram template will continuously perform Graphic Syntax Checks while you model. When a graphic syntax error occurs, you will be met with an error message like the one shown below:

Other functionalities: The Business Process Diagram can enable the execution and automation of a process when the diagram is converted into XML type files.

If you don’t wish to have a visible pool in your diagram, you can choose to have a ‘default pool’ that doesn’t have to be graphically represented. You can see an example of a diagram without pool and lanes below:

BusinessProcessDiagram_2

Relation to other templates: The Business Process Diagram template is exclusively aimed at modeling using the BPMN standard. If the BPMN is not chosen as a mandatory standard, the WorkFlow Diagram template, which has fewer syntax limitations, can be used instead.

The Business Process Diagram is typically linked as a decomposition of a Business Process contained in a Business Process Network template.

Properties and metadata: The Business Process Diagram can for example retain the following information:

  • Description of the diagram
  • Expression and query language
  • Link to the owner of the process
  • Link to the one responsible for executing the process
  • Audits (auto generated information regarding its current state and access rights)
  • Associated documents, diagrams and other objects
  • Inherent Risk detailing risk considerations
  • Governance information detailing information about the published diagram and who has been involved in the approval of the diagram

In the picture above you can see the Business Process Diagram’s properties dialogue window, where the diagram’s properties can be viewed and edited:

For more information: about the BPMN standard please visit OMG’s dedicated website.