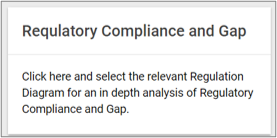
The Regulation Diagram is a central diagram used to capture regulations and document compliance.
On the collaboration platform the RegulationDiagram is view in a Diagram Dashboard (read more about Dashboard here)

As standard (QualiWare 10.10) there are 2 diagram dashboard available in the tool to the Regulation Diagram (and if needed they can be configured to fit you special need):
Click here to see how to shift between available layouts on a Dashboard.
Browsing Diagram Dashboard (Regulation Diagram)

The Regulation Diagram is the main focus of the Browsing dashboard, you can click each of the symbols to learn more (learn more about Responsive tiles here)
- Description Tile shows the description (and the paragraph text) of the diagram (or selected object) (learn more about Context Dependent Tiles here)
- Properties Tile shows the Properties of the diagram (or selected object) (learn more about Context Dependent Tiles here)
- Highlight if – Default Highlight if available on Browsing Dashboards (learn more about Highlight if here)
Analyzing and Improving Diagram Dashboard (Regulation Diagram)

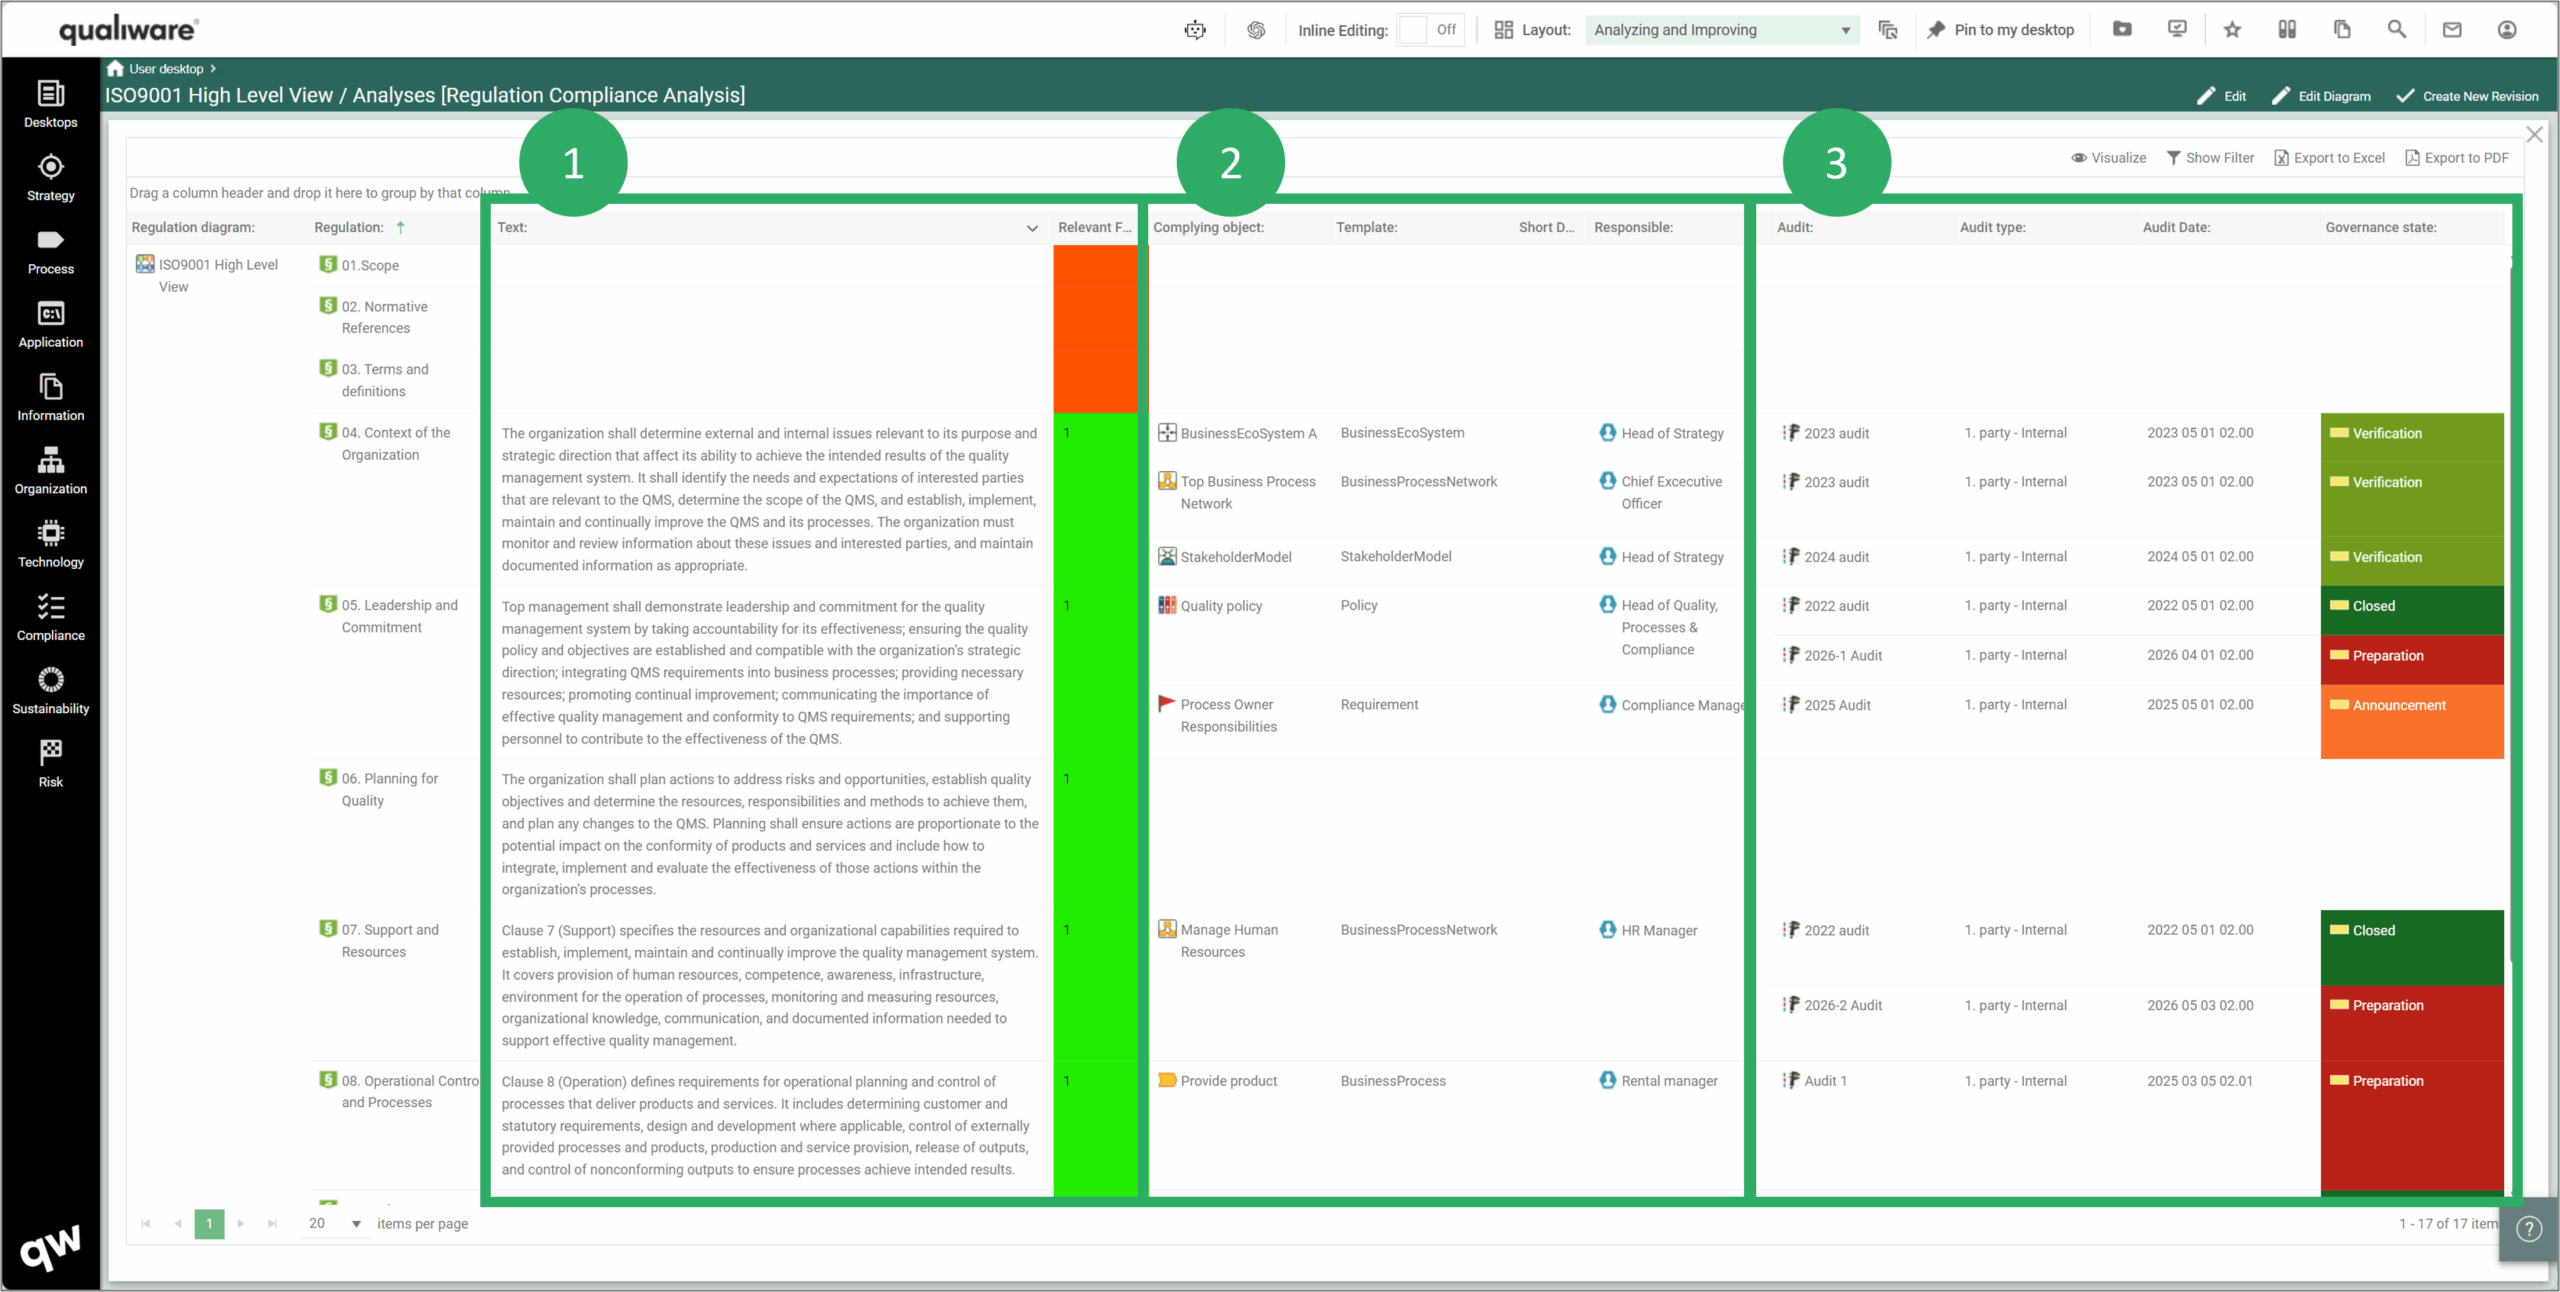
The Analyzing and Improving Dashboard also contains the Diagram, properties and description tiles, and in addition it contains a comprehensive set of features and analyses that can support you with all aspects of compliance in relation to a set of regulations.
- The Compliance Matrix is generated automatically based upon the regulation in the diagram, and their related complying object(s) and their audits
- Edit tile contains a set of Spreadsheets where data and relations can be managed and updated
- Highlight tile contains a set of Advanced highlights that are based upon derived relationships and underlying data.
- Analyses tile contains a set of filterable Queries each focusing on a relevant subset of properties and relation to the regulations
- Audit view – Relevant for Business & Complying object Autogenerated Gantt Charts based upon the derived complying objects and their audits
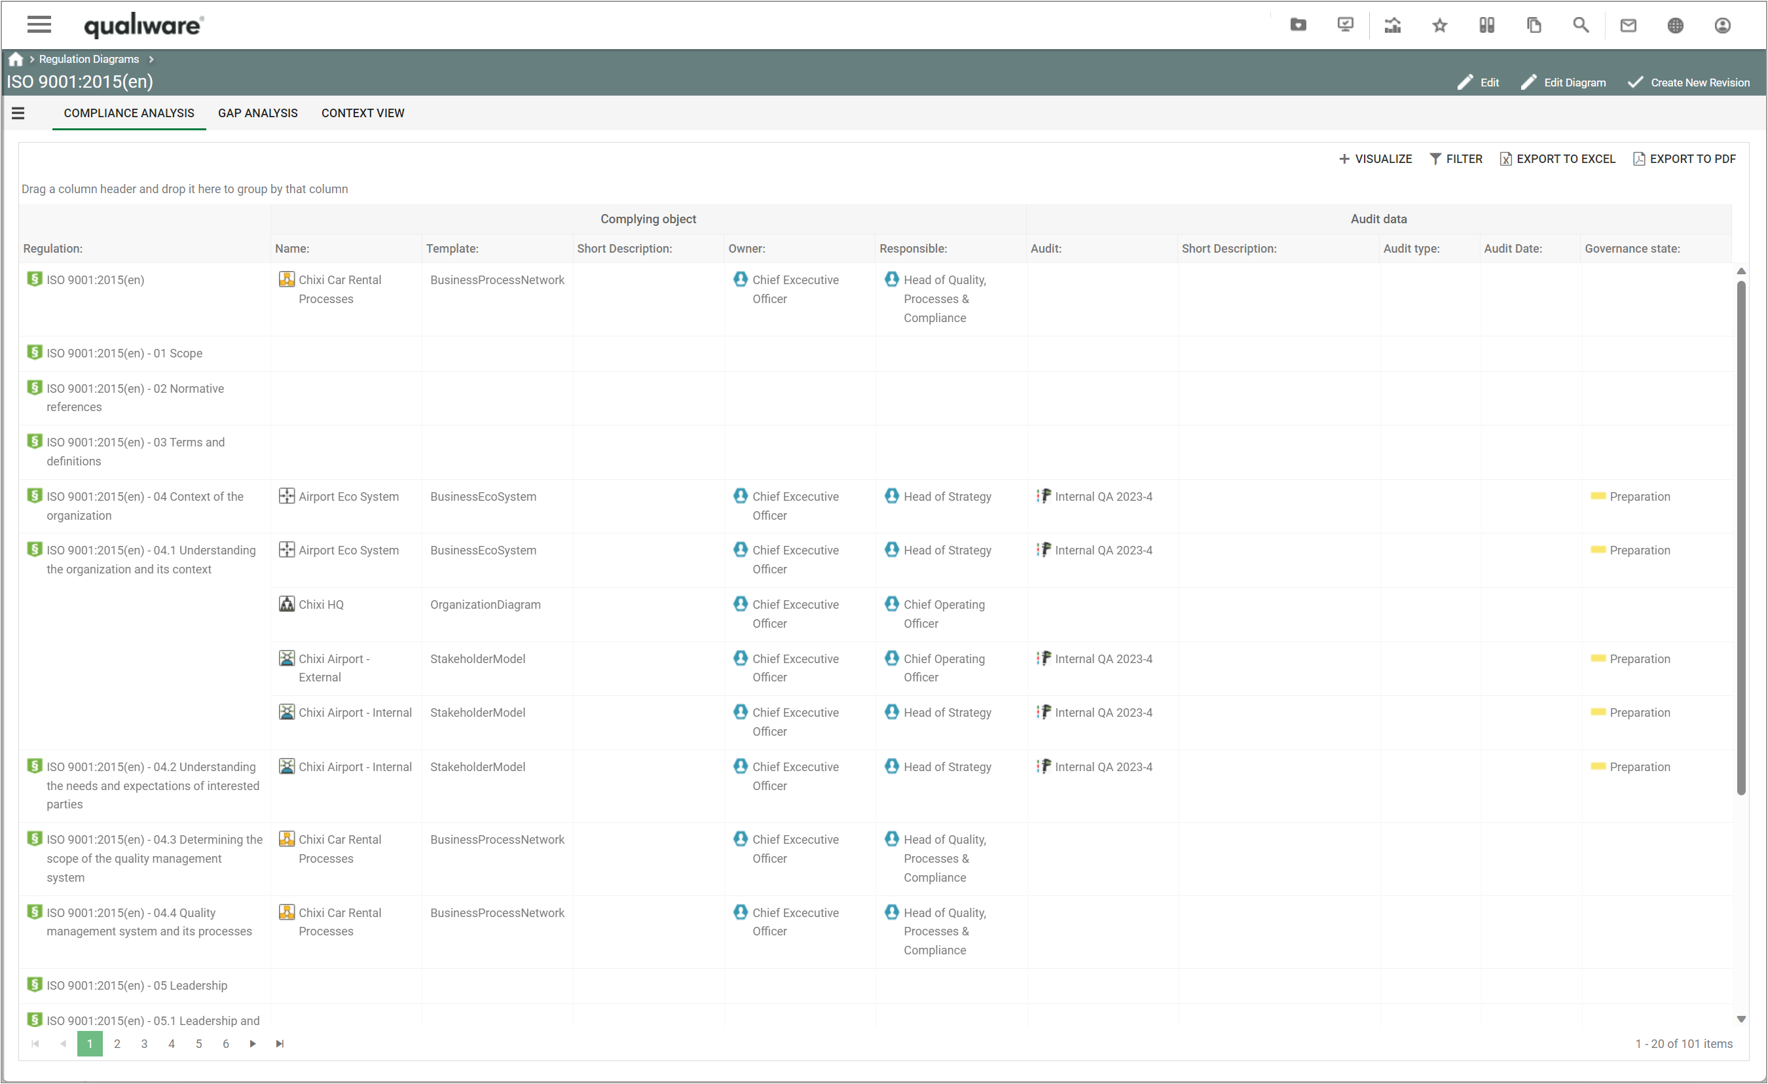
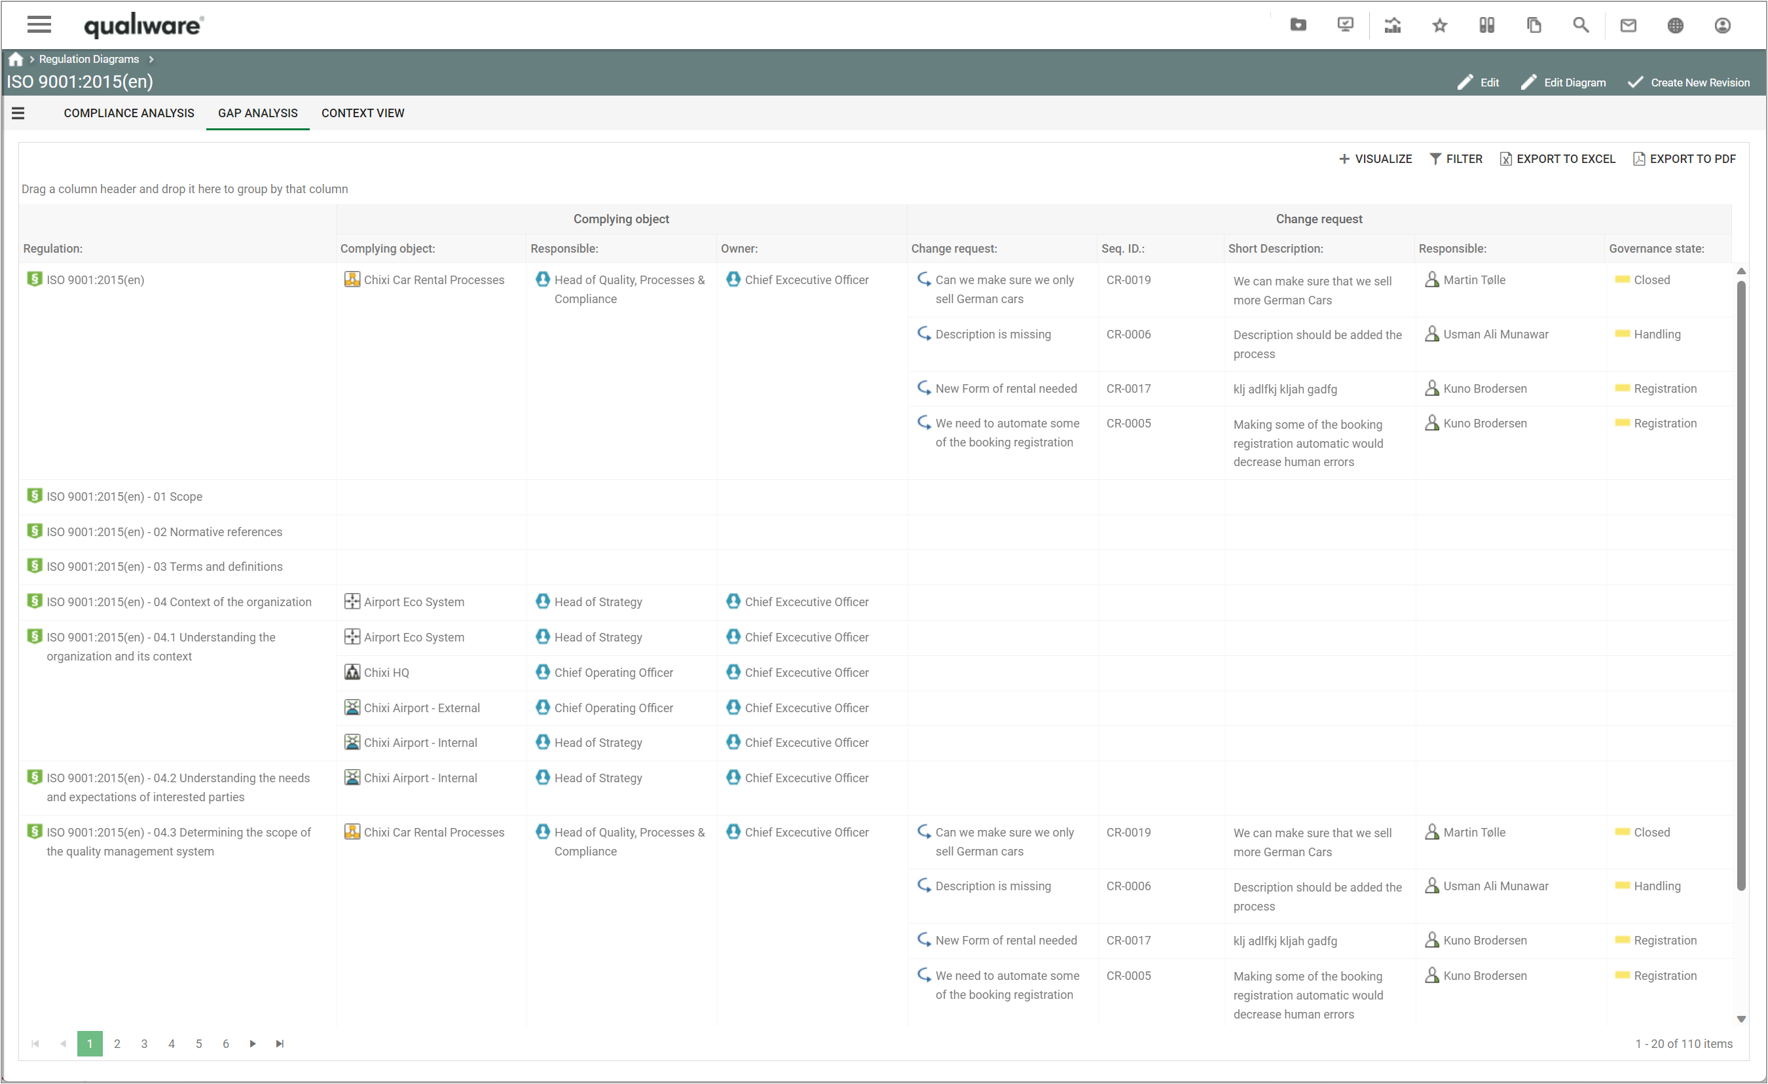
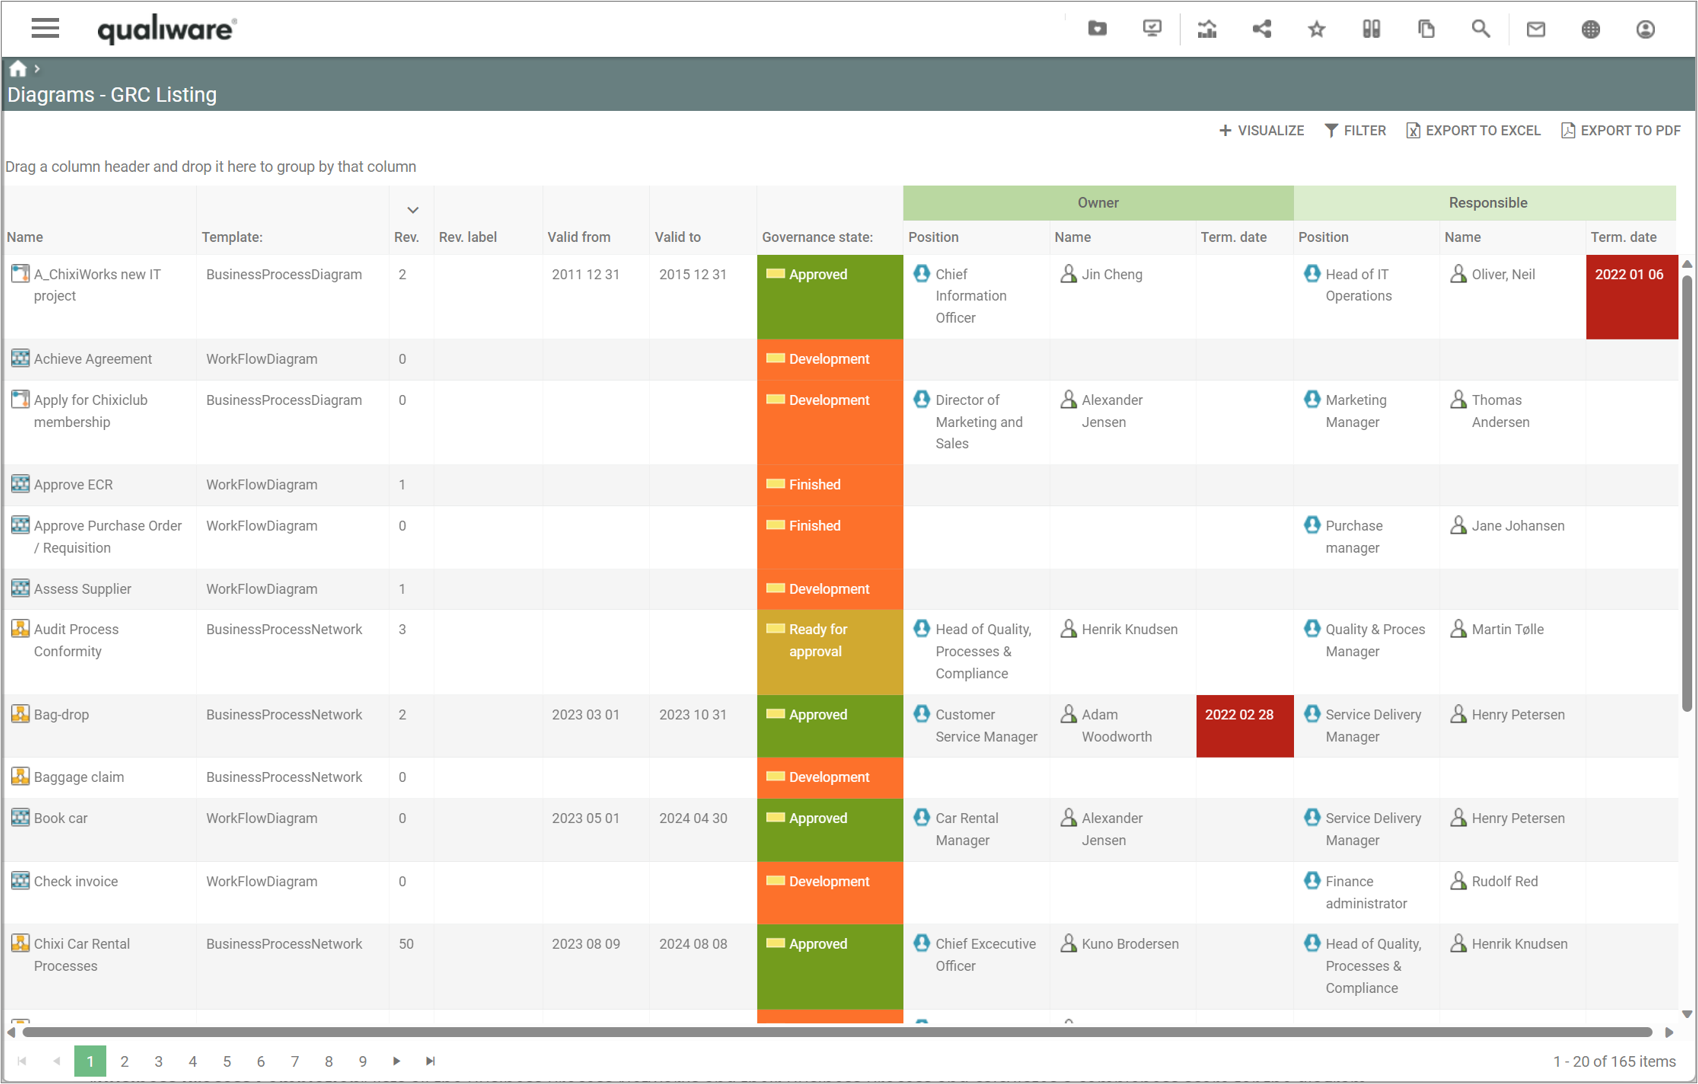
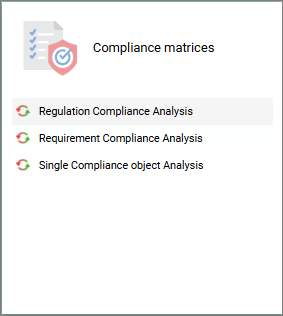
Compliance Matrix
The Compliance matrix is generated automatically in QualiWare based upon the relations between the objects in the system. The Regulation Diagram is used to capture a set of regulations and the matrices are derived based upon the content (regulations) and their related complying objects.
On the Dashboard the tile lists regulations (relevant in the top, not relevant in the bottom), and their complying objects and the audits that are related to each complying object.

The compliance matrix can be expanded/toggled to full size (clicking in the top right corner). The full size contains an additional set of columns enabling you to analyze and focus on the relevant subset.
- The first columns contain properties about the regulation (paragraph number, text, relevant for business)
- Audits where the regulation is target regulation (name, audit date and audit governance state)
- Complying objects (responsible for the object, type of template, governance state of the object)
- Change request related to the complying object, and their governance state
- Non-Conformances related to the complying object, and their governance state
- Audits where the complying object is target object (name, audit date and audit governance state)

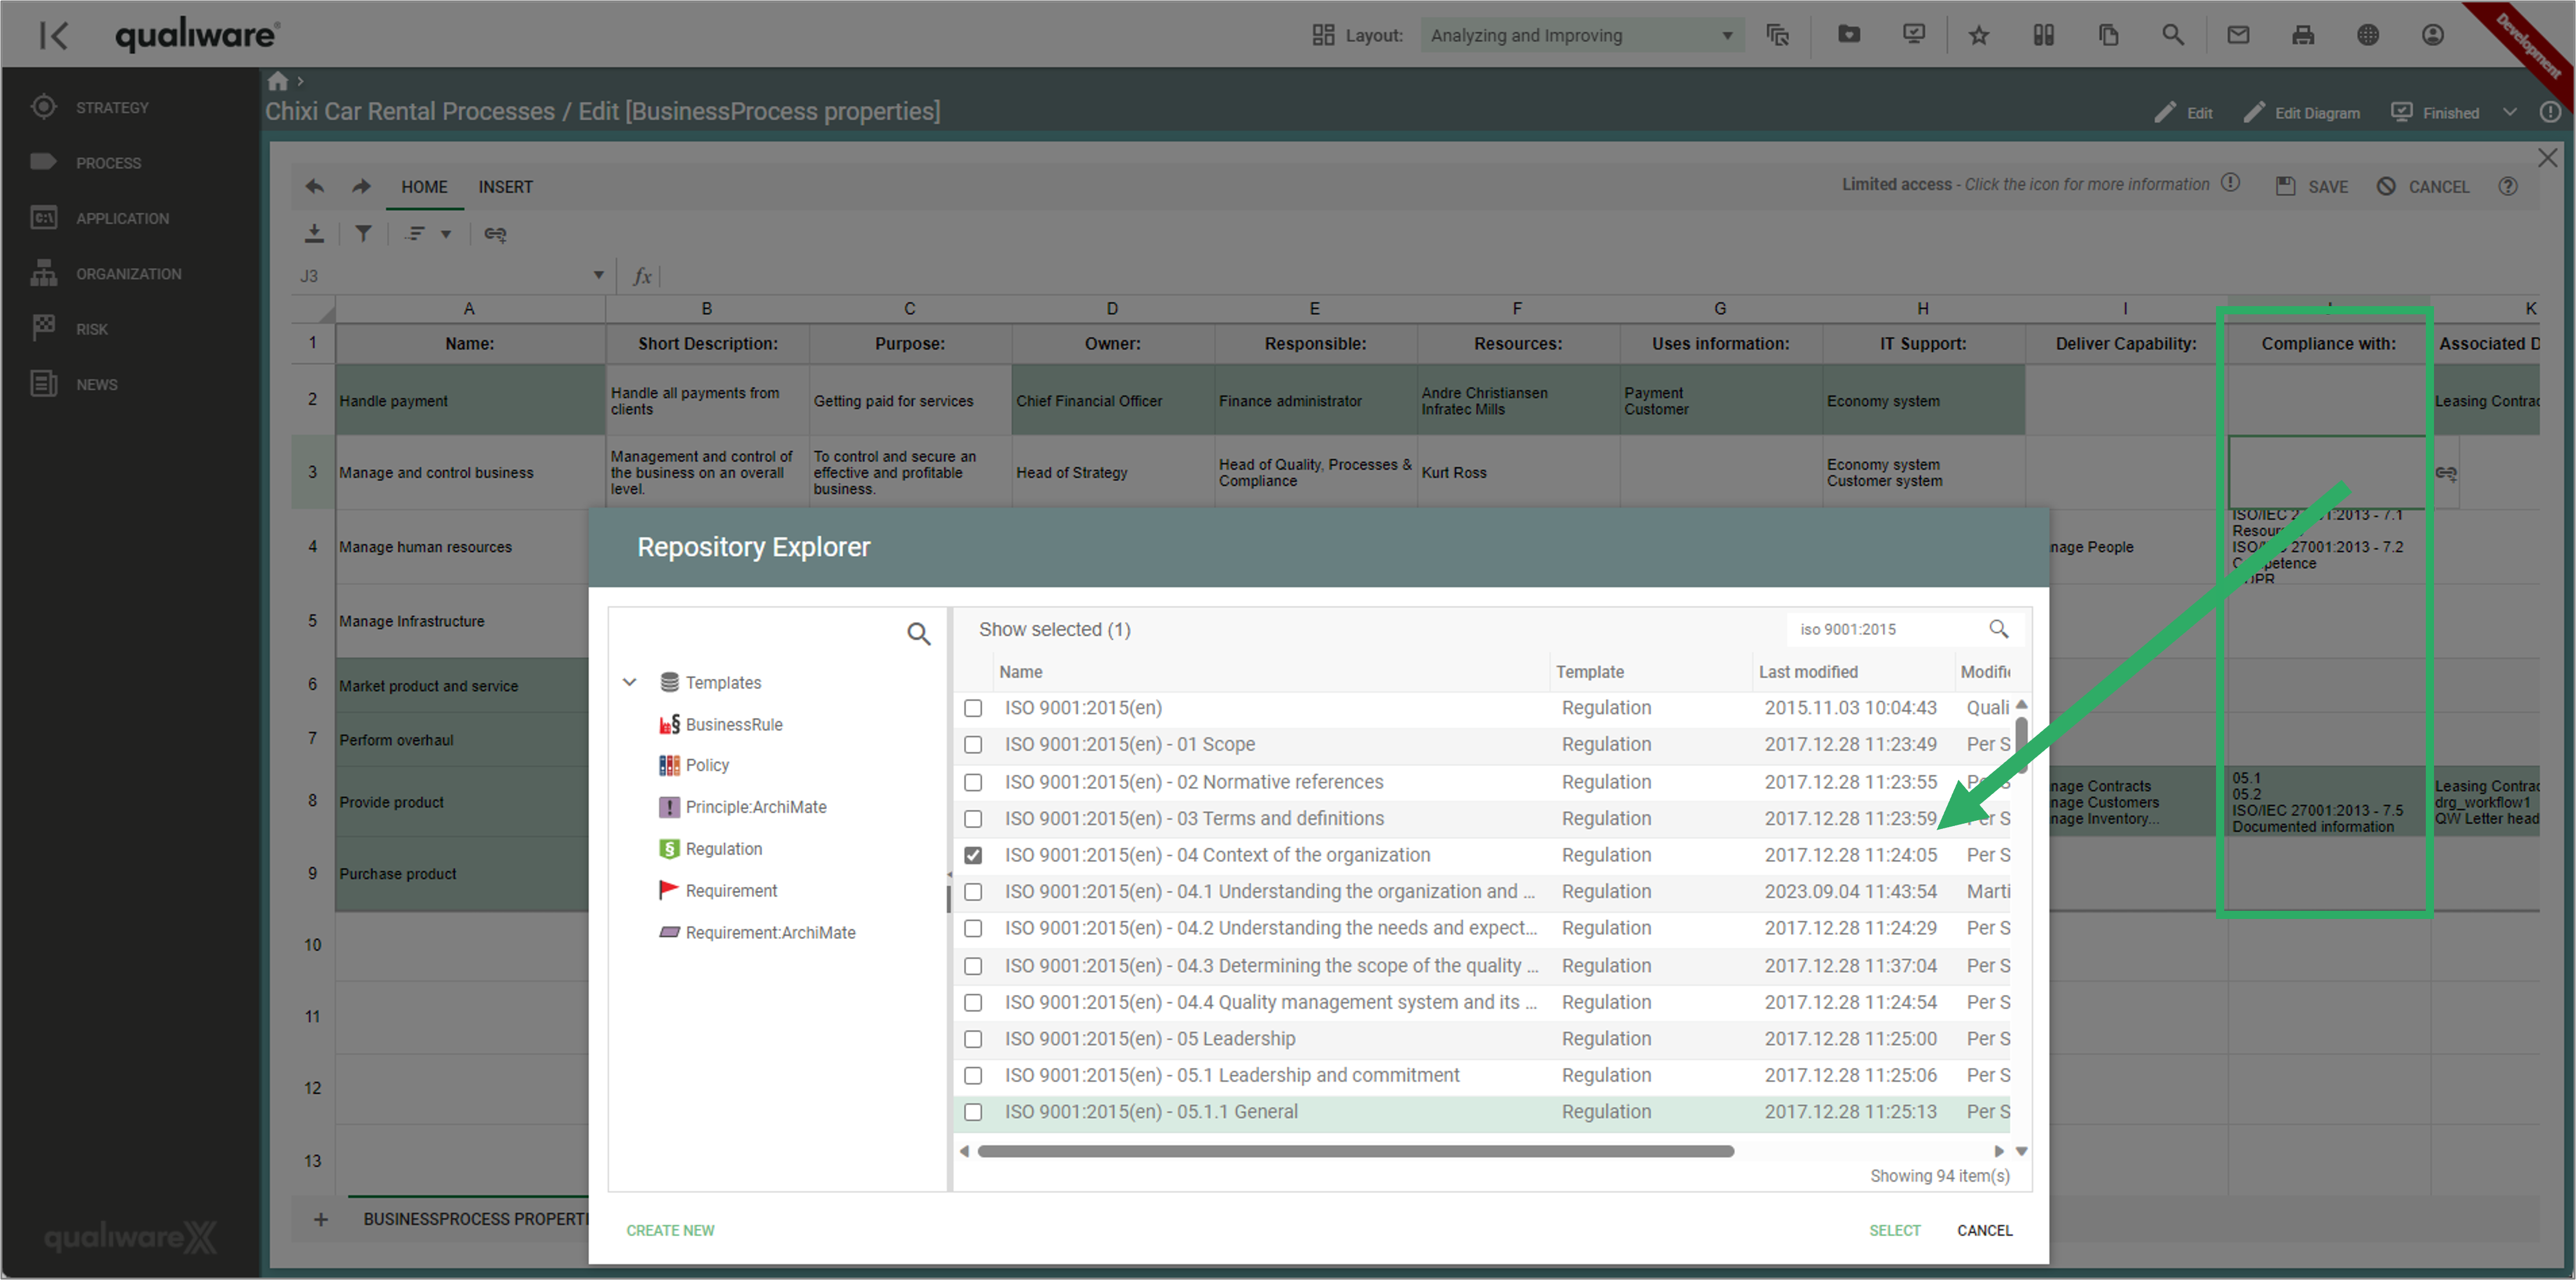
Edit
The Edit tile contains a set of Spreadsheets grouped around 4 areas:

Justify relevance and associate complying objects

These Spreadsheets enable you to easily Enrich Regulations with details, map relevance, and associate complying objects:
Regulations Edit (Spreadsheet)
This Spreadsheet lists all regulations (column B) in the RegulationDiagram (column A), and from here it is possible to:
-
- Mark whether a regulation is relevant – or not relevant for the business. Relevant regulations are in scope for the compliance activities, i.e. these are the ones you aim to document compliance for,
- Add paragraph (number), paragraph text, and regulation name for each regulation.
- See/create link to complying object(s) mapped to each regulation, and for each complying object you can see/update:
- Template (this is derived from the complying object and cannot be changed. To change you must map a relevant object in Column G)
- See/Change Responsible for the Complying object (or Add if missing)
- See/Change Short description associated to the Complying object

Regulations Justifications (Spreadsheet)
This Spreadsheet lists all regulations (column B) in the RegulationDiagram (column A), and from here it is possible to:
-
- Mark whether a regulation is relevant – or not relevant for the business. Relevant regulations are in scope for the compliance activities, i.e. these are the ones you aim to document compliance for,
- See/update paragraph text for each regulation.
- See/create link to a justification related to the regulation, this can be used to elaborate (and document) justification for why a regulation is relevant (or not), and if relevant describe the intention and map target complying object
- See/create link to complying object(s) mapped to each regulation, and for each complying object you can see/update:
- Template (this is derived from the complying object and cannot be changed. To change you must map a relevant object in Column L)
- See/Change Responsible for the Complying object (or Add if missing)
- See/Change Short description associated to the Complying object

Audit Planning and Scope

These Spreadsheets enable you to plan and scope audits related to the regulations. There are 2 spreadsheets, each focusing on a particular audit scope:
- Audit Regulation Plan (Focus on Audits where the regulation is Target Regulation)
- Audit Plan Complying Object (Focus on Audits where the regulations Complying object(s) are Target Process)
Audit Regulation Plan (Spreadsheet)
This Spreadsheet lists all regulations (column A) and focusing on audit related to each of the regulation:
-
- Mark whether a regulation is relevant – or not relevant for the business. Relevant regulations are in scope for the compliance activities, i.e. these are the ones that could be target in audit(s),
- See/create links to Audit(s) as (target regulation) for each regulation, and see/update:
- Audit date for the linked audit(s)
- See/create link to Audit Program associated to the Audit

Audit Plan Complying Object (Spreadsheet)
This Spreadsheet lists all regulations (column A) and focusing on audit related to each of the regulation:
-
- Mark whether a regulation is relevant – or not relevant for the business. Relevant regulations are in scope for the compliance activities, i.e. these are the ones where the complying objects could be target in audit(s),
- See/create links to Complying Object(s) for each regulation
- See/create links to Audit(s) as (target process) for each Complying Object, and see/update:
- Audit date for the linked audit(s)
- See/create link to Audit Program associated to the Audit

Risks

These Spreadsheets enable you to work with Risk(s) related to the Regulation(s) on the Diagram and to risk(s) associated with the Complying object(s) related to the regulations:
- Symbol Risk for Diagram (Focus on Risk(s) related to the Regulation)
- Risk Complying Object Regulations (Focus on Risk(s) concerning the Complying object(s) related to the regulations)
Symbol Risk for Diagram (Spreadsheet)
This is the standard Risk Spreadsheet (available on Analyzing Diagram Dashboards) focusing on Risk related to the Symbols on the Diagram, i.e. the spreadsheet lists:
-
- Regulations (column A) on the Regulation Diagram
- Risk(s) related to each of the regulations, along with a set of properties related to the Risk
- 2a Likelihood, Significance, Impacts scores
- 2b Residual Likelihood and Significance for the risk after the:
- Control activity mitigating the risk to is residual score (2b), and who is responsible for the Control activity

Risk Complying Object Regulations (Spreadsheet)
This Spreadsheet lists all regulations (column A) and focusing on Risk related to each of the Complying objects related to each regulation:
-
- Regulation name and relevanse,
- See/create links to Complying Object(s) for each regulation
- See/create links to Risk(s) as concerned with each Complying Object, and see/update:
- 3a Likelihood. Significance, Short Description for the Risk
- 3b Residual Likelihood and Significance score for the risk after the:
- Control activity mitigating the risk to is residual score (3b), and who is responsible for the Control activity

Associated Regulation

This Spreadsheet enables you to work with two set of regulations and identifying gaps and similarities between the different – yet similar – standards or to identify changes and gaps between two different versions of the same standard:
Regulation-Link-Regulation (Spreadsheet)
This Spreadsheet supports the linkage of a regulation to an associated regulation:
-
- Regulations (column B) on the Regulation Diagram, including relevance score, paragraph number and paragraph text
- See/add Complying Object(s) to the regulation
- See/add Associated Regulation to the Regulation, and explore/compare:
- Relevance score, paragraph number and paragraph text
- Complying Object(s) related to associated regulation
This spreadsheet can be used to compare two sets of regulations, e.g.:
- to indenty gaps between two standards (e.g. identify changes between two different versions of the same standard)
- Compare standard X to standard Y, to ensure consistency and to match the complying objects to similar regulations in different regulation sets.

Highlight
The Highlight tile contains a set of Advanced highlights that are based upon derived relationships and underlying data. This enables the user to get an easy and comprehensive view whether a regulatory object is relevant for business, has complying objects and if so when it has last been audited.

Regulation Highlight – Relevant for Business
Highlight regulations whether they are marked as relevant for business or not.


Relevant and with complying objects
Highlight regulations whether they are marked as relevant for business or not, and wheter there are complying objects linked to the regulation.


Audit Scope and Schedule (Complying objects)
Highlight regulations based upon their most recent/planned audit of the complying object related to each regulation, that are marked as relevant for business (target process in the audit).


Audit Scope and Schedule (Target Regulation)
Highlight regulations based upon their most recent/planned audit for each relevant regulation (target regulation in the audit).

Analyses
The Analyses tile contains a set of filterable QRVs each focusing on a relevant subset of properties and relation to the regulations:

Audit View – Relevant for Business & Complying objects
The Audit View shows an automatically generated Gantt Chart, based upon the Relevant Regulations, and their complying objects and their associated audits:
- all the Regulations, that are relevant for business
- all complying object related to the regulation
- all audits that are related to the complying object


The Gantt Chart is explorable, it is possible to click the small triangles to the left of the objects, to drill down to see the next level for each of the rows.


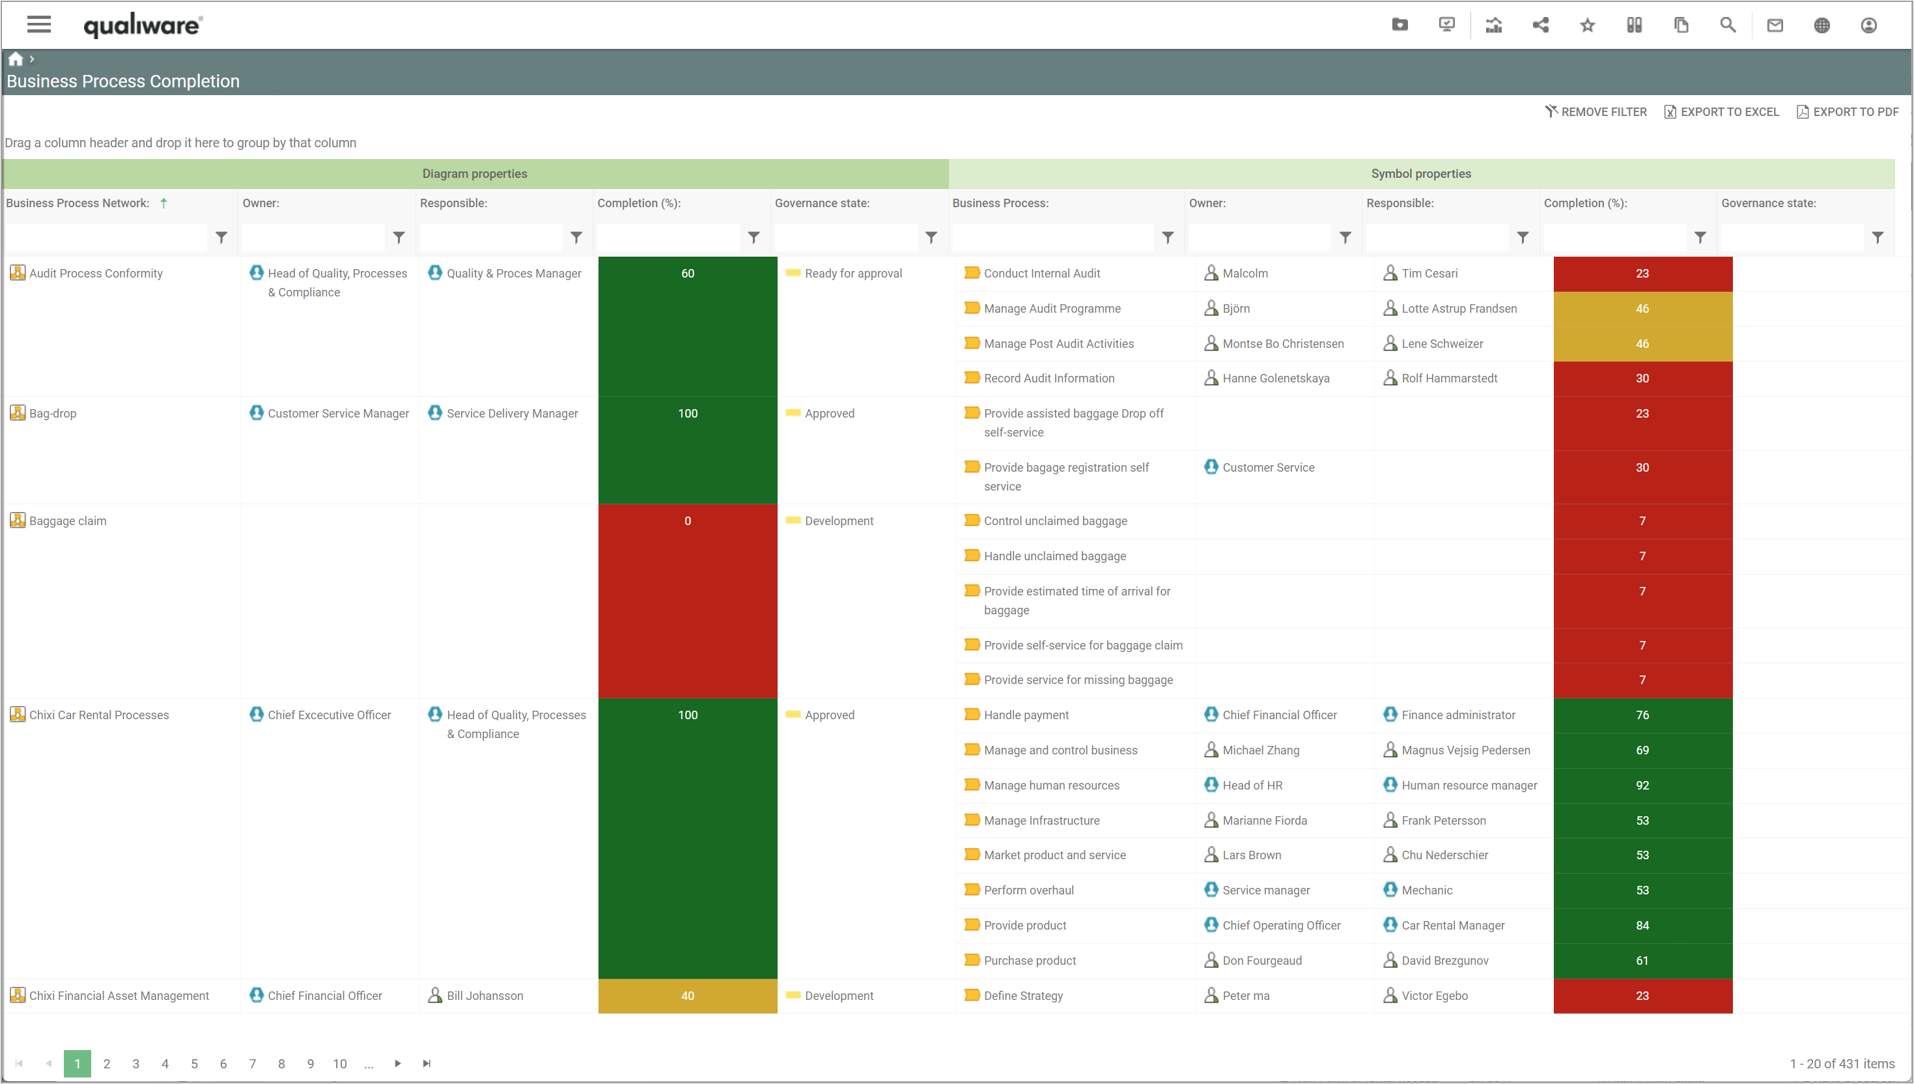

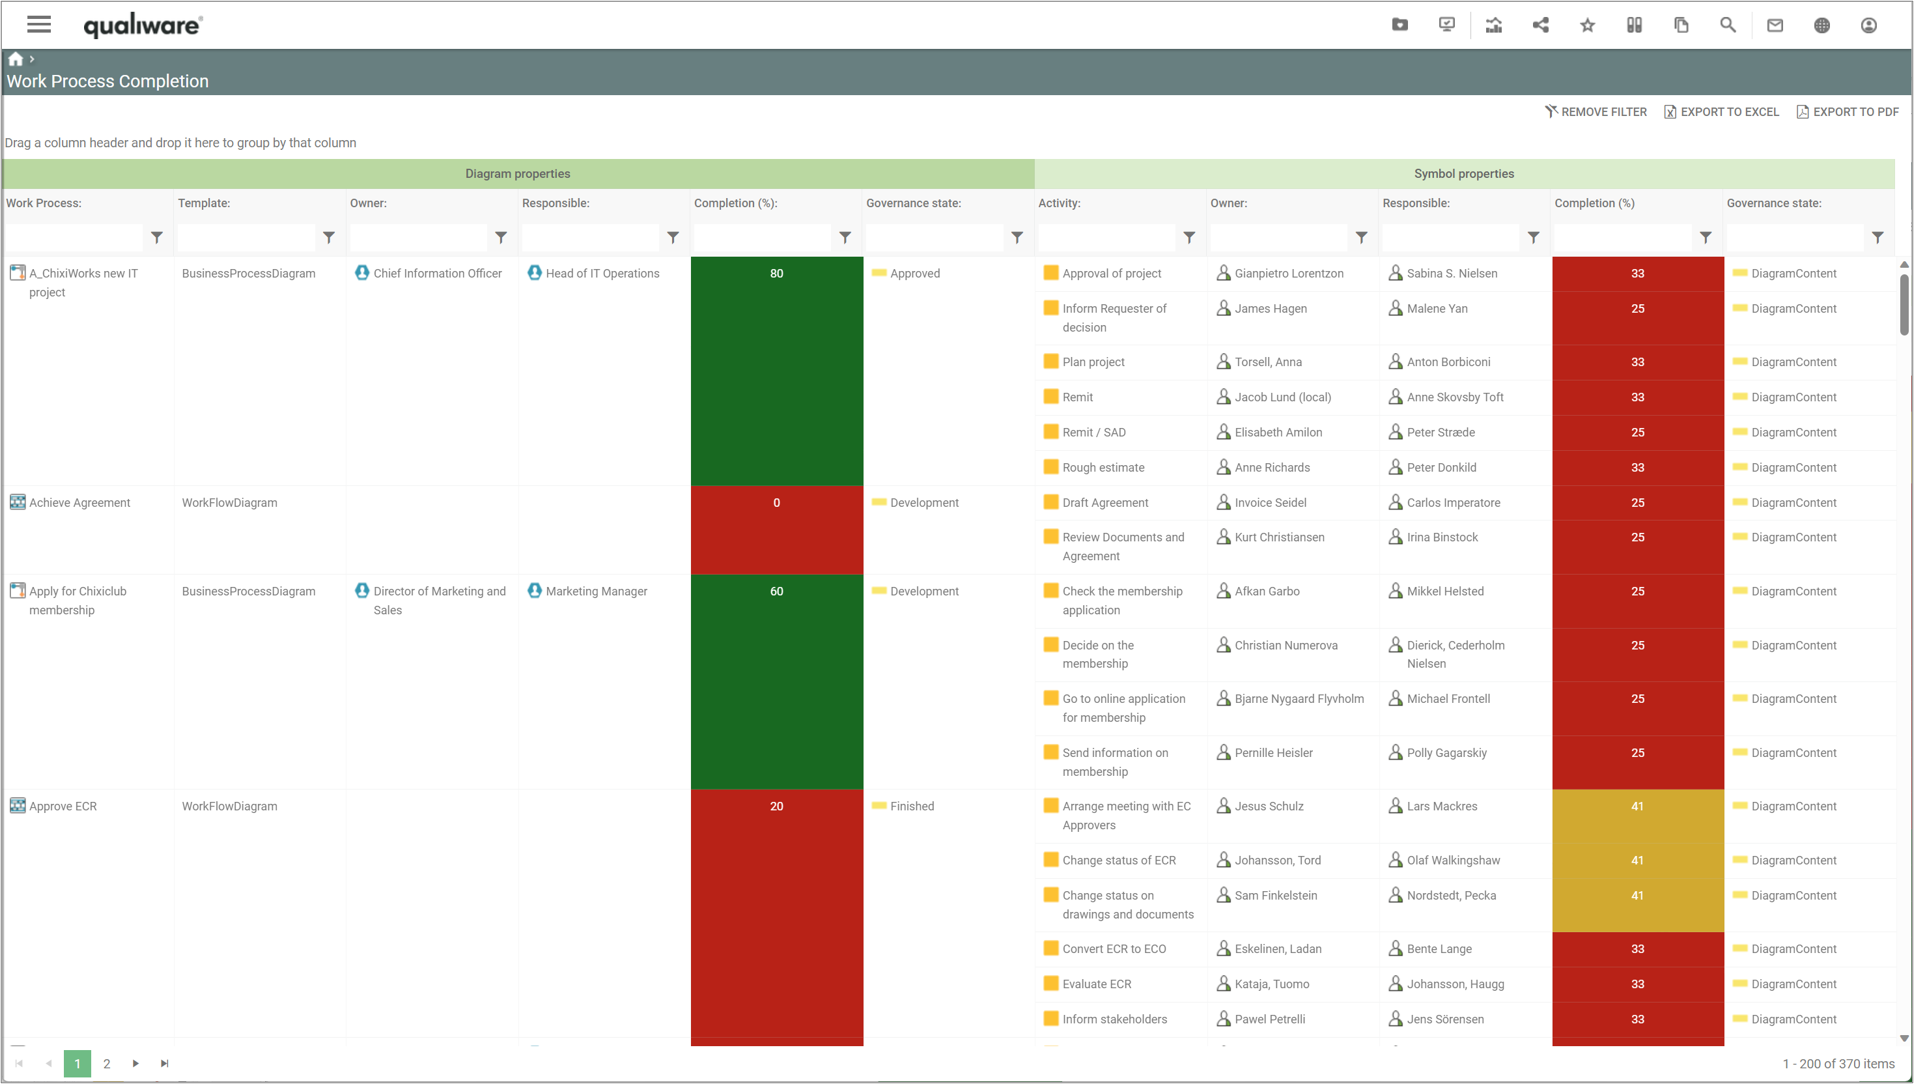
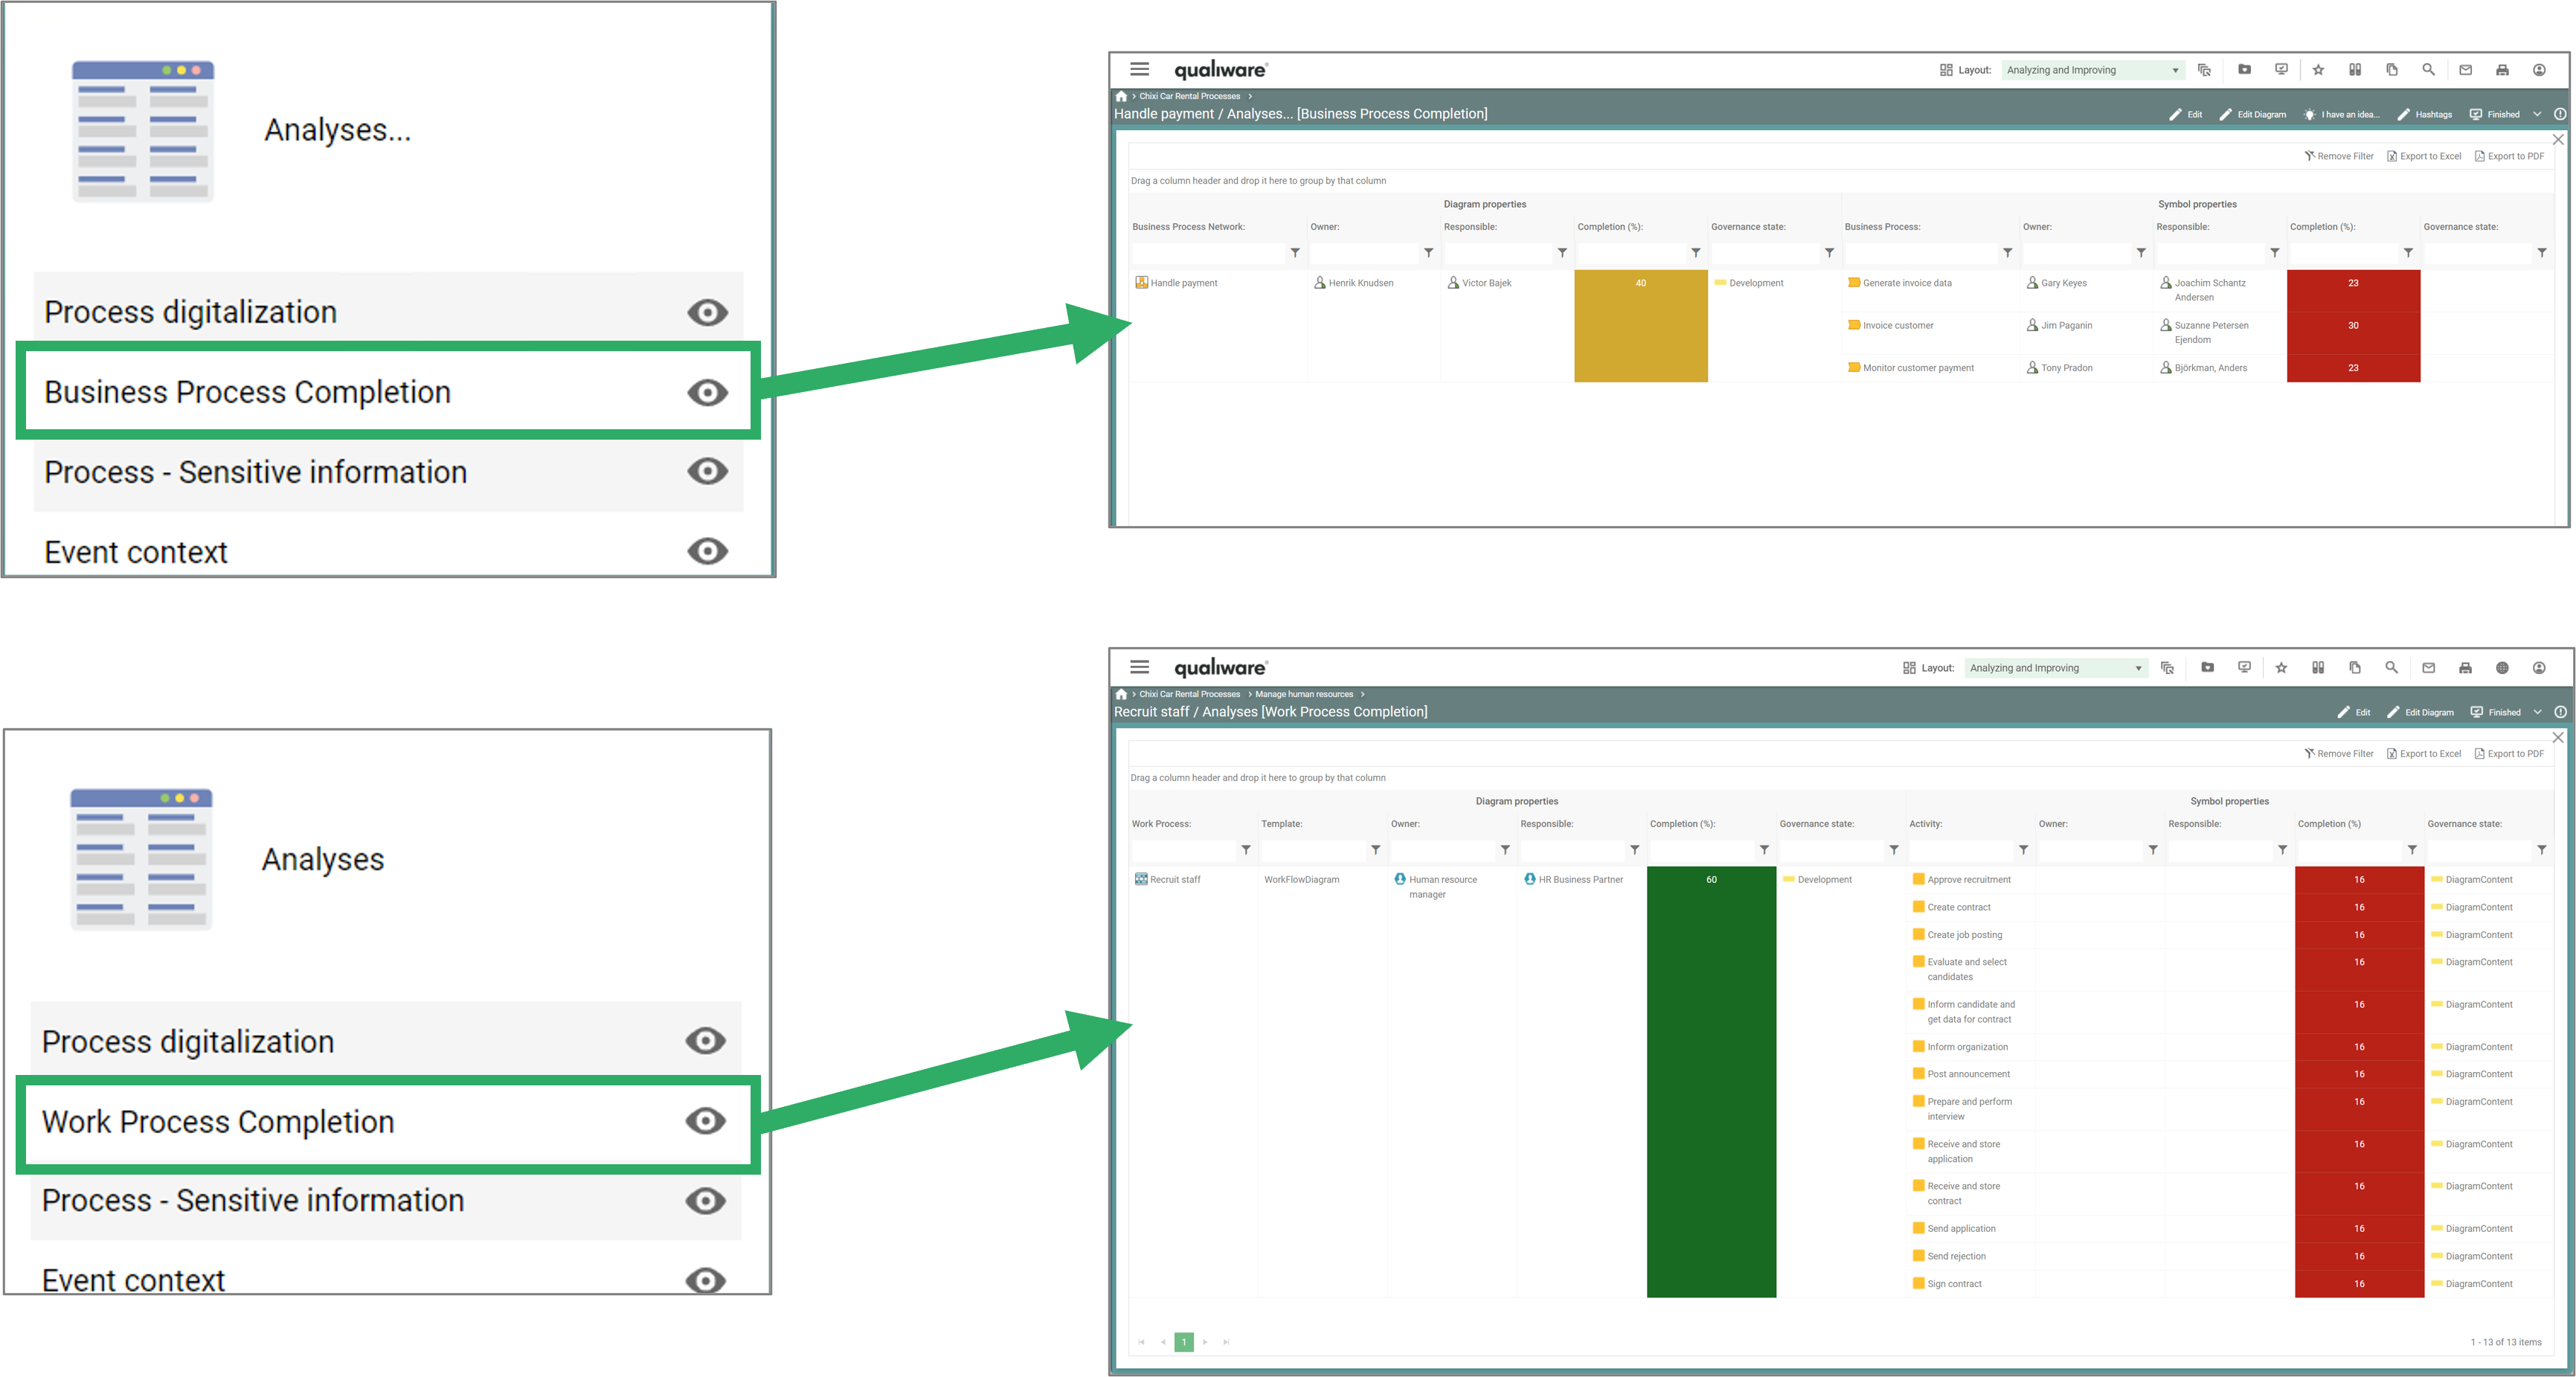
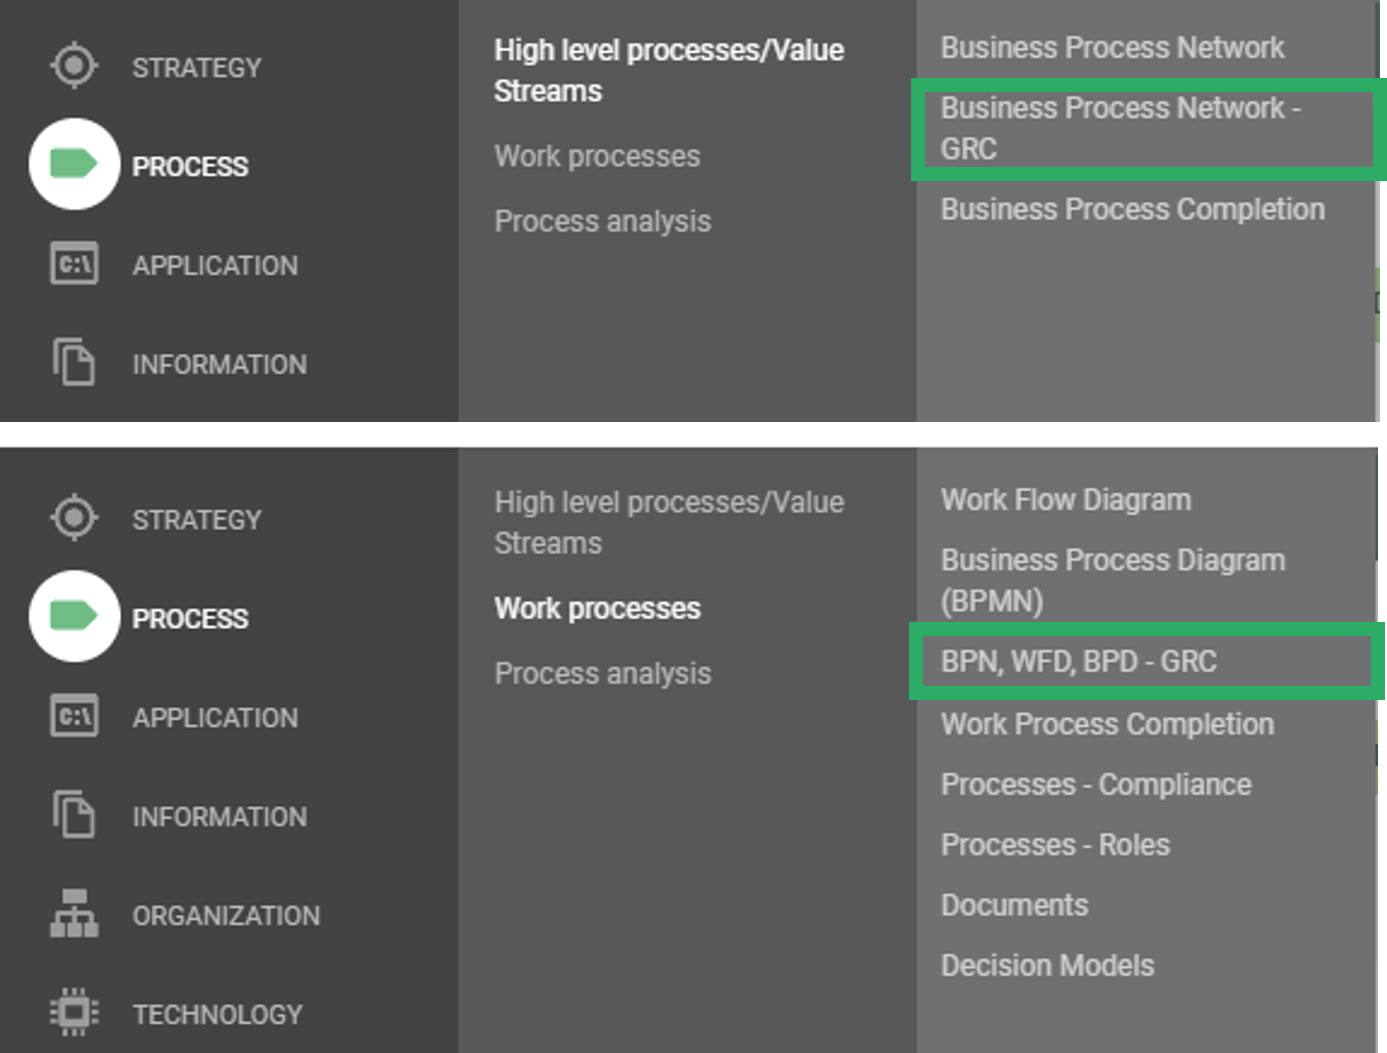 Two lists of processes are available from the standard Process menu. The lists are structured in a similar way, but differs in the scope.

 The
The