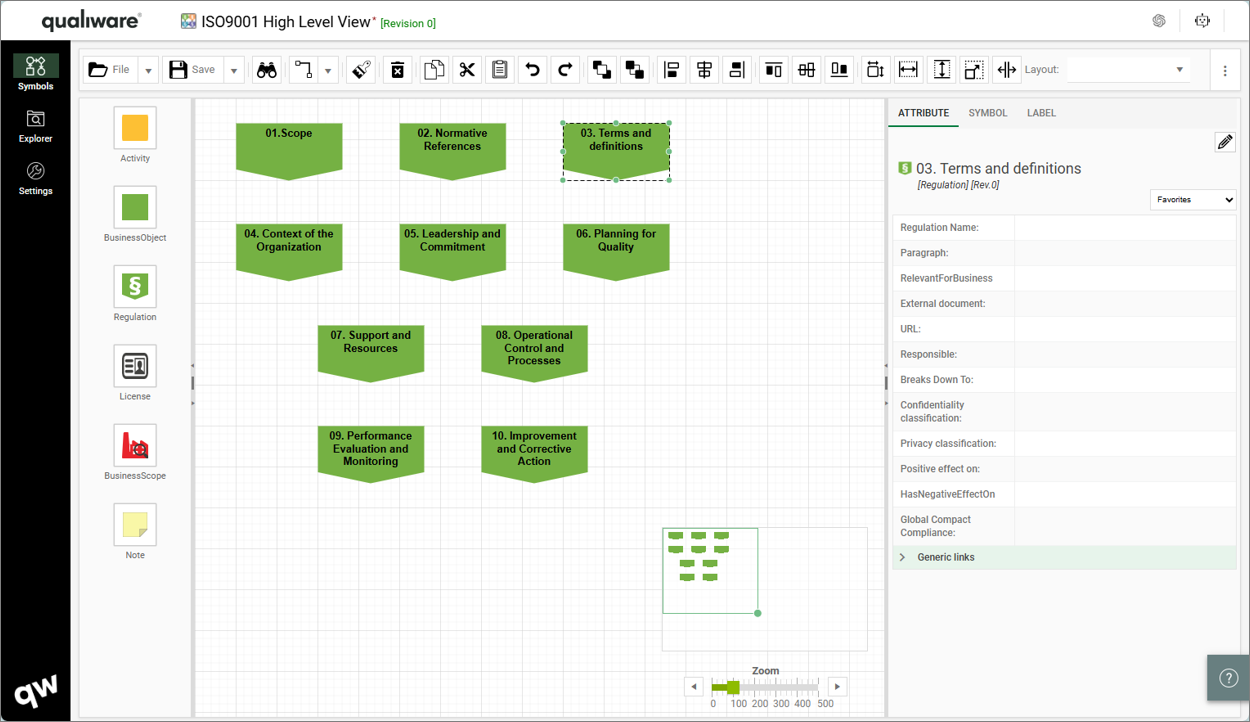
From the repository explorer you can explore and search content in the repository. The repository explorer enables the user to search for a specific object type, list details, and see selection in the preview window.
In addition to finding the relevant object fast, the repository explorer also provides easy access to edit funtions, and a whole set off options from the content menu including visualizations, and relations to the object.
Video Highlight
Using the Repository Explorer Feature
When on the web front-end click on the Repository Explorer button in the upper right corner in the toolbar.

Once clicked the Repository Explorer will open and enable you to search for and explore folders and object in the windows, and via the content menu.
The Repository Explorer contains of 3 parts:
- a folder view in the left
- a list view in the middle
- a preview view in the right view, including easy access to available governance actions.

The folder view in the left window consists of a set of folders. Each of the folders can be unfolded in a treeview, clicking the “>” to the left of the folder/object.
As default a template folder is included in the top of the folder list (the content of the folder is managed via the HTML Publisher).
Additional folders can be added via the publisher, or by using the 3 dot sushi menu.


Once a folder/object is selected in the left window, a list of objects is listed in the center window.
- if a template type is selected all the object of the selected type is listed in the middle window.

- if a specific object is selected all related objects is listed in the middle window, and the object is shown in the right preview window together with its description

Search
It is possible to search for content in both the left and middle window.

In the list window, you can select two different searches:
- Quick Search: Searches within the object in the list window
- Global Search: Searches withen the whole repository

Context menu
You can find the context menu to the right of an object, in the form of 3 dots sushi menu.
- When you click on the context menu to a template, you can create a new template of the selected template type, or create a new repository folder.

When you click on the context menu to an object, you get a more comprehensive menu, which offers all necessary features to maintain and analyse the content of the repository. The menu will also offer the relevant governance actions for the selected object, which enables a faster governance process, as it is not required to open the object to move it forward in the lifecycle. The content of the menu in configured in the HTMLContextMenu.

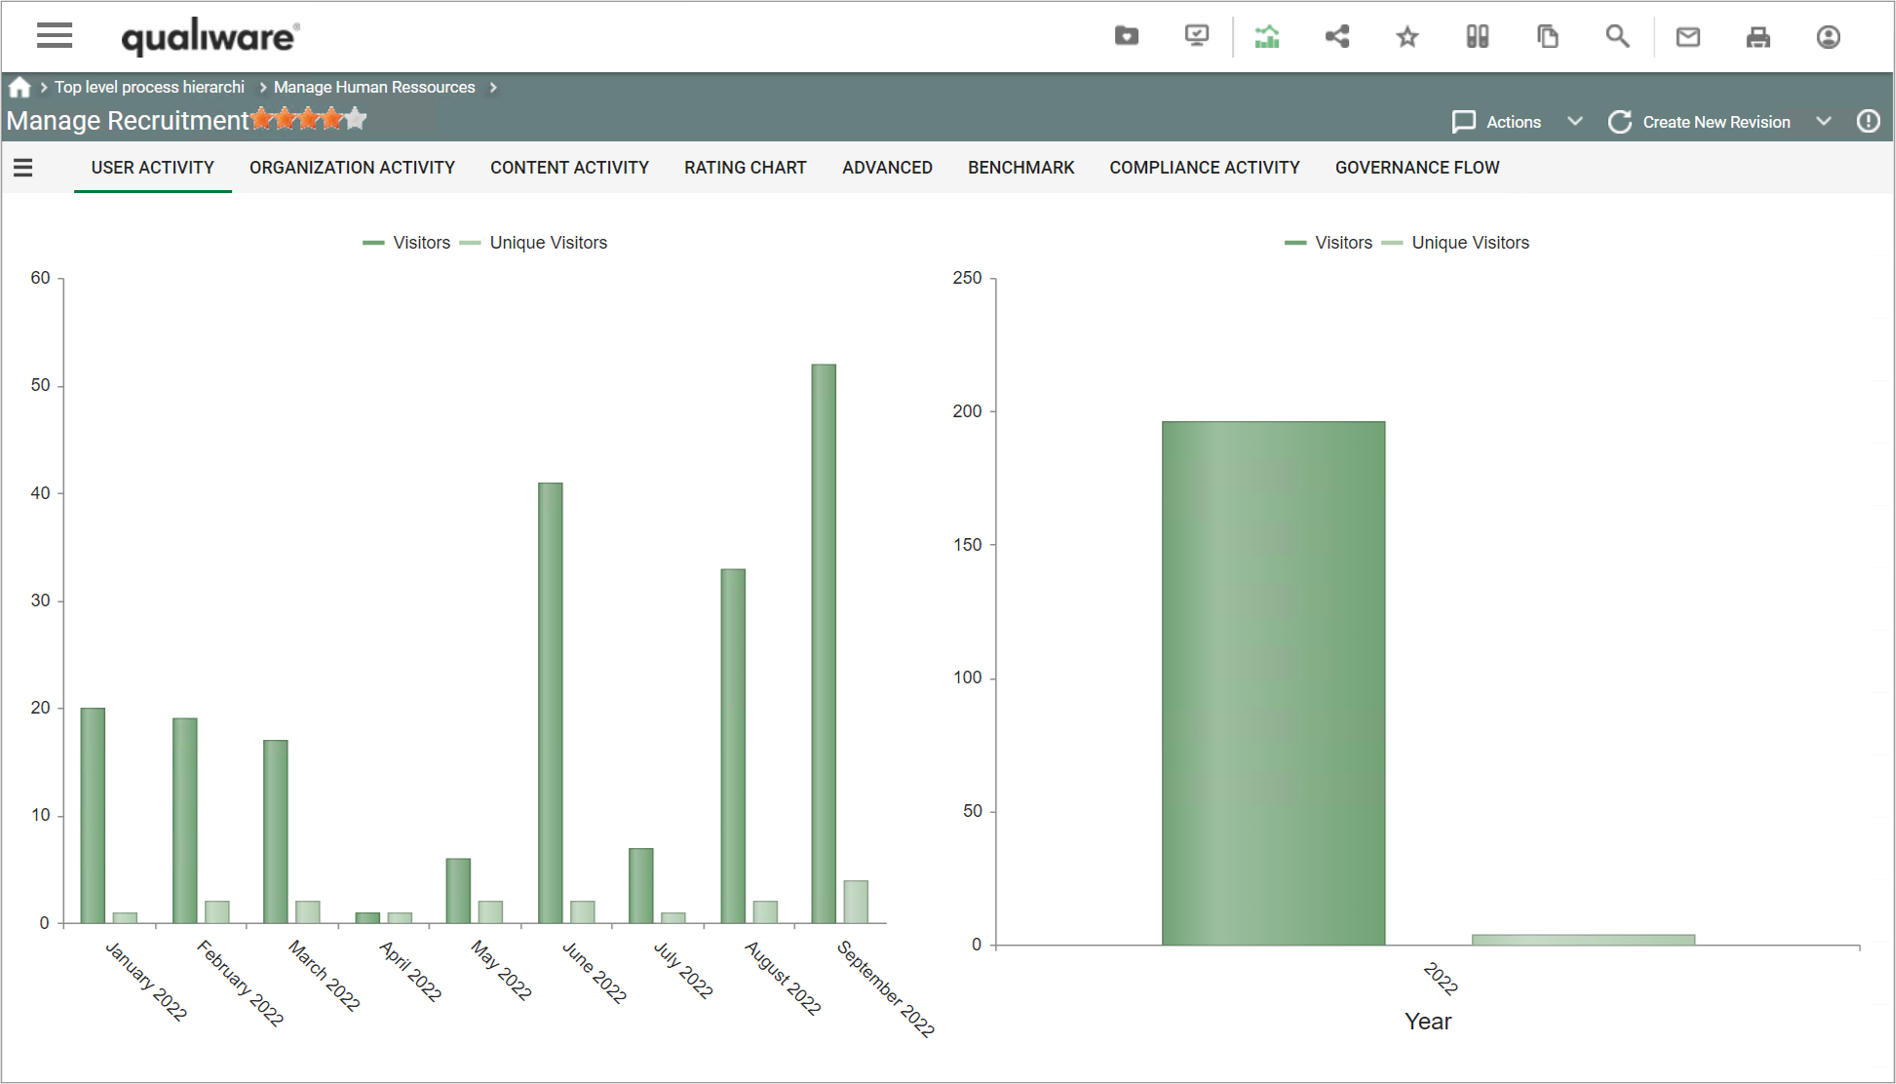
- View: views the object on the web (shows the corresponding dashboard or IFrame for the selected object)
- Properties: open the web-dialog for the object, to edit the properties
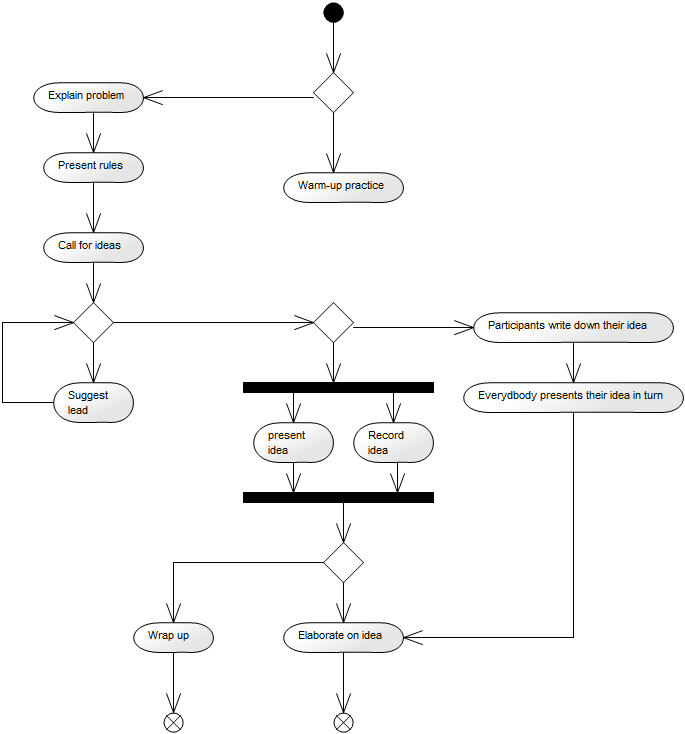
- Edit diagram: open diagram in the web-modeler
- Revision:
- Create new revision
- Compare configuration revisions: Open the object in the repository compare
- Governance History: Shows governance history of the object
- Language: Create a language variant of the object (in the selected language)
- Manage Hashtags: Manage hashtags associated with the object
- Collaborate:
- Create a Change Request to the object
- Create a Non-Conformance to the object
- Create a comment to the object
- Rate the object
- Subscribe to the object
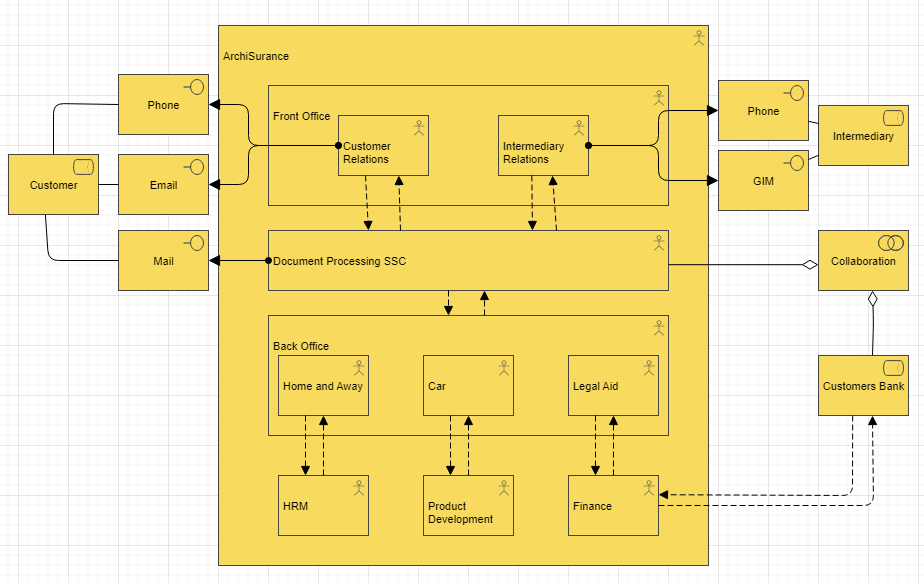
- Visualize: Open the object in the visualizer
- Relations: See all types of relations to the object:
- Links to / Linked by / Contained in / Sends / Sends to / Receives / Receives from / Frames / Framed by)
- Share: Send object to a folder, E-mail or Print
- Create: new object or folder
- Remove / Replace / Rename the object
- Governance: select among available governance actions for the object
Repository Explorer Properties
In QualiWare 10.9 the repository explorer was enhanced with some more features that enables you to see more properties and relations to the objects.
In the lower left corner there has been added at windows showing backwards relations to the selected object. This is similar to the window known from the QLM application.
Furthermore, you can now choose between a “Full” and a “Simple” view of the selected object to explore the properties of object in the right frame.
- The simple view is the usual view in the repository explorer
- The Full view is a new view showing all “tabs” of the objects where there data/relations filled in.


Another addition to the repository explorer is the possibility to change the scope of the view. This is also a wellknown feature from the QLM application.
The user can choose between the default view and see all revisions, all language variants or all revisions and language variants.
As in QLM the default object in the repository is the revision where the is a (*) besides the revision number of the object.